. 2023 Jun;62(6):332-341.
doi: 10.1002/gcc.23133. Epub 2023 Mar 8.

Germline variation in RASAL2 may predict survival in patients with RAS-activated colorectal cancer

Affiliations

Germline variation in RASAL2 may predict survival in patients with RAS-activated colorectal cancer

Christopher Wills et al. Genes Chromosomes Cancer. 2023 Jun.

Abstract

Background: Therapeutic agents that specifically target patients with RAS mutant colorectal cancer (CRC) are needed. We sought potential drug targets by relating genome-wide association study and survival data in patients with advanced CRC profiled for mitogen-activated protein kinase (MAPK) pathway mutations.

Methods: In total, 694 patients from the clinical trials COIN and COIN-B had MAPK-activated CRCs (assigned as KRAS, NRAS, or BRAF mutant). Genome-wide single nucleotide polymorphism (SNP), gene, and gene-set analyses were performed to identify determinants of survival. For rs12028023 in RAS protein activator-like 2 (RASAL2), we studied its effect by MAPK pathway activation status (by comparing to 760 patients without MAPK-activated CRCs), MAPK gene mutation status, surface area of the primary tumor (as a marker of proliferation), and expression on RASAL2.

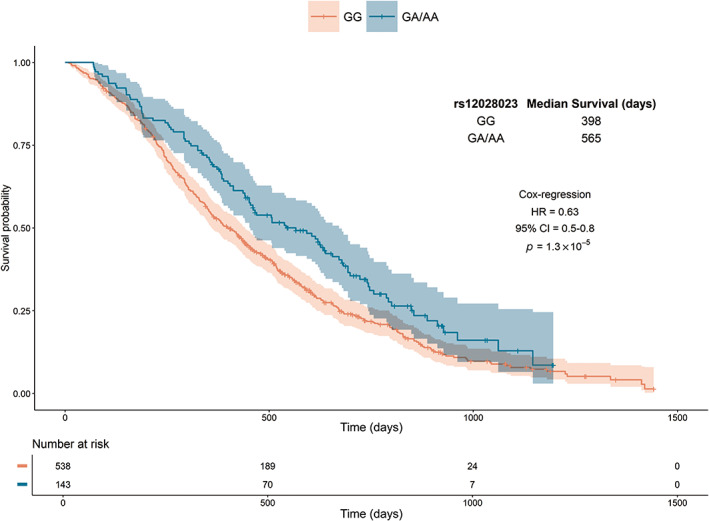
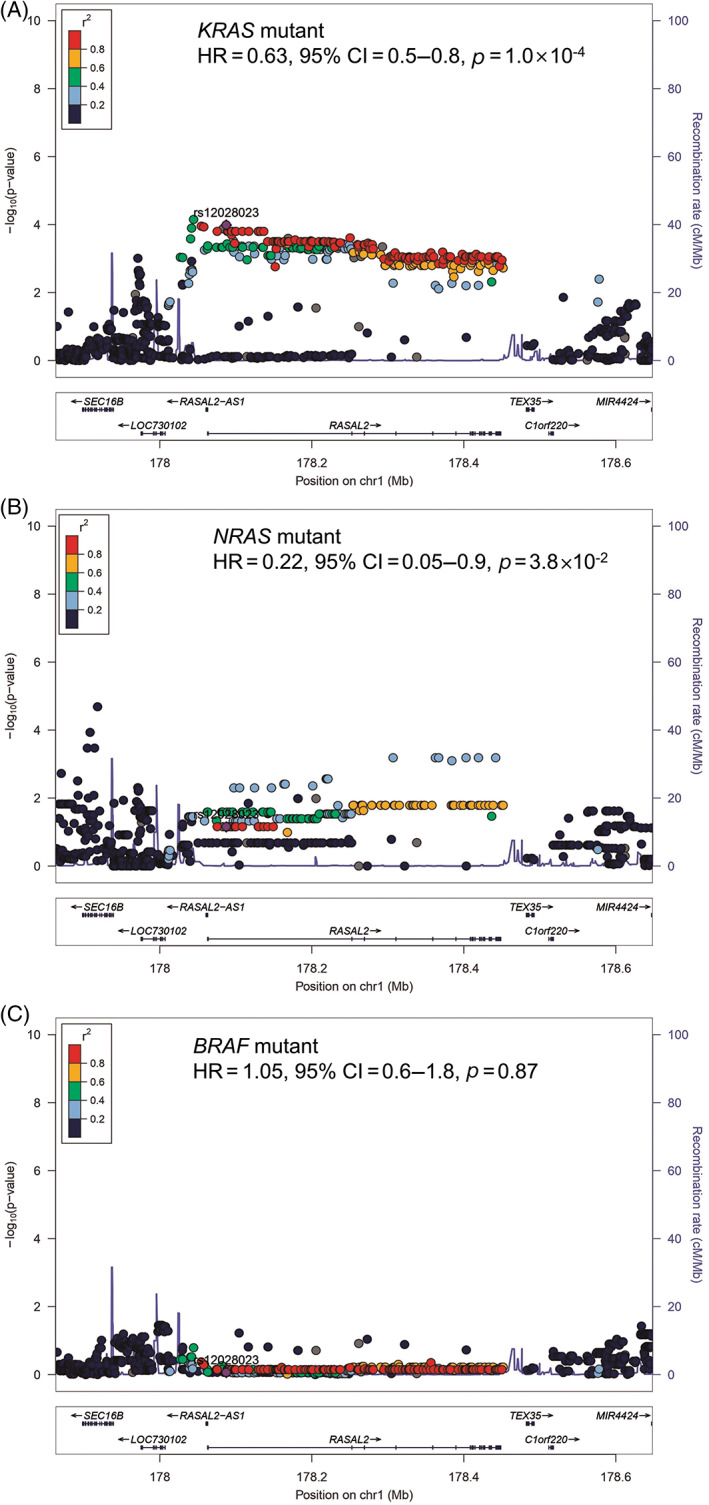
Results: In MAGMA genome-wide analyses, RASAL2 was the most significant gene associated with survival (p = 2.0 × 10⁻⁵ ). Patients carrying the minor (A) allele in the lead SNP, rs12028023 in intron 1 of RASAL2, had a median increase in survival of 167 days as compared with patients carrying the major allele. rs12028023 was predictive for survival by MAPK-activation status (pZ-test = 2.1 × 10⁻³ ). Furthermore, rs12028023 improved survival in patients with RAS mutant (hazard ratio [HR] = 0.62, 95% confidence intervals [CI] = 0.5-0.8, p = 3.4 × 10⁻⁵ ) but not BRAF mutant (p = 0.87) CRCs. The rs12028023 A-allele was associated with reduced surface area of the primary tumor (Beta = -0.037, standard error [SE] = 0.017, p = 3.2 × 10⁻² ) and reduced RASAL2 expression in cultured fibroblasts (p = 1.6 × 10⁻¹¹ ).

Conclusion: Our data demonstrate a prognostic role for RASAL2 in patients with MAPK-activated CRCs, with potential as a therapeutic target.

Keywords: MAPK-activation; RAS; RASAL2; colorectal cancer; survival.


Conflict of interest statement

The authors declare no conflicts of interest.

Figures

FIGURE 1
FIGURE 1
Flow diagram of patients with mitogen‐activated protein kinase (MAPK)‐activated colorectal cancers (CRCs). Of the 1948 patients with germline genotyping and survival data, 694 had MAPK‐activated tumors without somatic PIK3CA mutations (no Akt activation) or microsatellite instability and had covariate data. Nine patients had CRCs with two MAPK‐activating mutations (eight with KRAS and NRAS mutations and one with KRAS and BRAF mutations). In total, 760 patients did not have MAPK‐activated tumors, defined as KRAS, NRAS, and BRAF wild‐type.
FIGURE 2
FIGURE 2
Relationship between gene, genotype and survival in 694 patients with mitogen‐activated protein kinase‐activated colorectal cancers. (A) Manhattan plot of gene associations with overall survival (OS). Genes are ordered by chromosome position and plotted against the −log10(p) for their association with OS. The red line represents the threshold for genome‐wide significance (p = 2.5 × 10−6). (B) Regional locus zoom plot shows results of the analysis for single nucleotide polymorphisms (SNPs) and recombination rates. −log10(p) (y‐axis) of the SNPs are shown according to their chromosomal positions (x‐axis) for an area 200 kb upstream and downstream of RASAL2. The sentinel SNP (purple) is labeled by its rsID. The color intensity of each symbol reflects the extent of linkage disequilibrium with the sentinel SNP, deep blue (r 2 = 0) through to dark red (r 2 = 1.0). Genetic recombination rates, estimated using 1000 Genomes Project samples, are shown with a blue line. Physical positions are based on NCBI build 37 of the human genome. Also shown are the relative positions of genes and transcripts mapping to the region of association. Genes have been redrawn to show their relative positions; therefore, maps are not to physical scale.
FIGURE 3
FIGURE 3
Kaplan–Meier plot of the relationship between rs12028023 genotype and overall survival in patients with mitogen‐activated protein kinase‐activated colorectal cancers. Time in days plotted against survival probability for patients homozygous for the major allele (GG) and heterozygous (GA) or homozygous for the minor allele (AA). Shaded areas represent 95% confidence intervals. The number of patients still at risk at each time point is shown beneath. 95% CI, 95% confidence intervals; HR, hazard ratio.
FIGURE 4
FIGURE 4
Relationship between inherited genetic variation in RASAL2 and survival by mitogen‐activated protein kinase gene mutation status. Regional locus zoom plots for single nucleotide polymorphism (SNP) associations with overall survival in patients with colorectal cancers carrying (A) KRAS mutations (n = 521), (B) NRAS mutations (n = 44) and (C) BRAF mutations (n = 120). Plots show results of the analysis for SNPs and recombination rates. −log10(p) (y‐axis) of the SNPs are shown according to their chromosomal positions (x‐axis) for an area 200 kb upstream and downstream of RASAL2. The sentinel SNP (purple) is labeled by its rsID. The color intensity of each symbol reflects the extent of linkage disequilibrium with the sentinel SNP, deep blue (r 2 = 0) through to dark red (r 2 = 1.0). Genetic recombination rates, estimated using 1000 Genomes Project samples, are shown with a blue line. Physical positions are based on NCBI build 37 of the human genome. Also shown are the relative positions of genes and transcripts mapping to the region of association. Genes have been redrawn to show their relative positions; therefore, maps are not to physical scale. Hazard ratio (HR), 95% confidence intervals (CI), and p‐values are given for rs12028023.

References

    1. Guren TK, Thomsen M, Kure EH, et al. Cetuximab in treatment of metastatic colorectal cancer: final survival analyses and extended RAS data from the NORDIC‐VII study. Br J Cancer. 2017;116(10):1271‐1278. doi:10.1038/bjc.2017.93 - DOI - PMC - PubMed
    1. Karapetis CS, Khambata‐Ford S, Jonker DJ, et al. K‐ras mutations and benefit from cetuximab in advanced colorectal cancer. N Engl J Med. 2008;359(17):1757‐1765. doi:10.1056/NEJMoa0804385 - DOI - PubMed
    1. Li R, Liang M, Liang X, Yang L, Su M, Lai KP. Chemotherapeutic effectiveness of combining Cetuximab for metastatic colorectal cancer treatment: a system review and meta‐analysis. Front Oncol. 2020;10:868. doi:10.3389/fonc.2020.00868 - DOI - PMC - PubMed
    1. Stintzing S, Modest DP, Rossius L, et al. FOLFIRI plus cetuximab versus FOLFIRI plus bevacizumab for metastatic colorectal cancer (FIRE‐3): a post‐hoc analysis of tumour dynamics in the final RAS wild‐type subgroup of this randomised open‐label phase 3 trial. Lancet Oncol. 2016;17(10):1426‐1434. doi:10.1016/s1470-2045(16)30269-8 - DOI - PubMed
    1. Khattak MA, Martin H, Davidson A, Phillips M. Role of first‐line anti‐epidermal growth factor receptor therapy compared with anti‐vascular endothelial growth factor therapy in advanced colorectal cancer: a meta‐analysis of randomized clinical trials. Clin Colorectal Cancer. 2015;14(2):81‐90. doi:10.1016/j.clcc.2014.12.011 - DOI - PubMed

Publication types

MeSH terms

Substances