. 2023 May 4;141(18):2261-2274.
doi: 10.1182/blood.2022017712.

Ribosome dysfunction underlies SLFN14-related thrombocytopenia

Affiliations

Ribosome dysfunction underlies SLFN14-related thrombocytopenia

Fabienne Ver Donck et al. Blood. .

Abstract

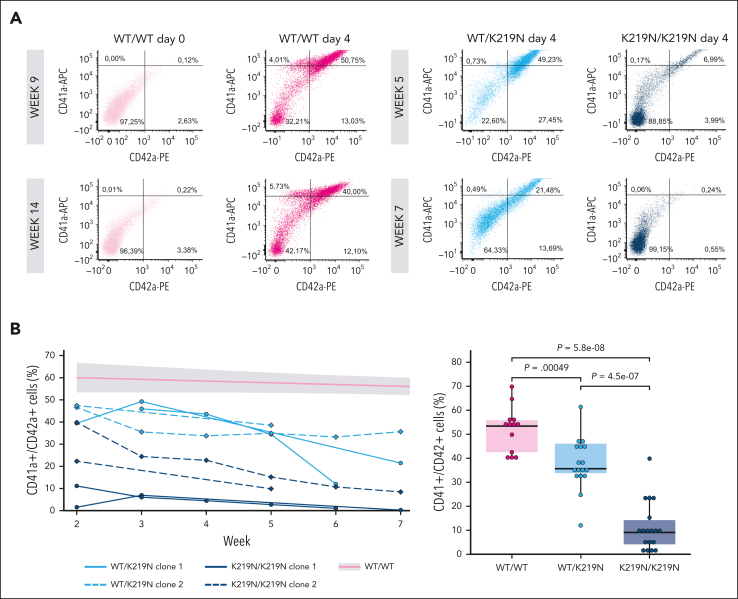
Pathogenic missense variants in SLFN14, which encode an RNA endoribonuclease protein that regulates ribosomal RNA (rRNA) degradation, are known to cause inherited thrombocytopenia (TP) with impaired platelet aggregation and adenosine triphosphate secretion. Despite mild laboratory defects, the patients displayed an obvious bleeding phenotype. However, the function of SLFN14 in megakaryocyte (MK) and platelet biology remains unknown. This study aimed to model the disease in an immortalized MK cell line (imMKCL) and to characterize the platelet transcriptome in patients with the SLFN14 K219N variant. MK derived from heterozygous and homozygous SLFN14 K219N imMKCL and stem cells of blood from patients mainly presented with a defect in proplatelet formation and mitochondrial organization. SLFN14-defective platelets and mature MK showed signs of rRNA degradation; however, this was absent in undifferentiated imMKCL cells and granulocytes. Total platelet RNA was sequenced in 2 patients and 19 healthy controls. Differential gene expression analysis yielded 2999 and 2888 significantly (|log2 fold change| >1, false discovery rate <0.05) up- and downregulated genes, respectively. Remarkably, these downregulated genes were not enriched in any biological pathway, whereas upregulated genes were enriched in pathways involved in (mitochondrial) translation and transcription, with a significant upregulation of 134 ribosomal protein genes (RPGs). The upregulation of mitochondrial RPGs through increased mammalian target of rapamycin complex 1 (mTORC1) signaling in SLFN14 K219N MK seems to be a compensatory response to rRNA degradation. mTORC1 inhibition with rapamycin resulted in further enhanced rRNA degradation in SLFN14 K219N MK. Taken together, our study indicates dysregulation of mTORC1 coordinated ribosomal biogenesis is the disease mechanism for SLFN14-related TP.


Conflict of interest statement

Conflict-of-interest disclosure: The authors declare no competing financial interests.

Figures

None
Graphical abstract
Figure 1.
Figure 1.
Pedigree and platelet characteristics of SLFN14 K219N carriers. (A) Pedigree showing affected family members (black symbols) with TP. The presence of the K219N SLFN14 variant is indicated when tested. (B) Peripheral blood smears (May-Grünwald-Giemsa stain; original magnification ×500) of patients IV.2 and III.4 showing platelet anisocytosis with the presence of small and large, hypogranular, platelets. Note the presence of microcytic erythrocytes. (C) Representative immunoblot analysis of SLFN14 protein expression in platelets from patients IV.2 and III.4 and 2 unrelated age- and gender-matched controls for each patient (top). The expression of GP1BA was used as a loading control and for normalization. Marker lanes are indicated as M. Quantification of triplicate immunoblots show a significant reduction in SLFN14 expression in platelets from patients with SLFN14 compared with 4 healthy controls (bottom). Boxplots represent the middle 50% of the data points, with 25% outliers as whiskers and the mean as a black horizontal line. All individual data points were added as dots to the graph. Three technical replicates were performed for each sample. P values were determined using the Wilcoxon test. (D) Representative electrophoresis image showing rRNA degradation of the 28S and 18S peaks (arrows) for platelet RNA samples of patients IV.2 and III.4, compared with platelet RNA from 3 unrelated controls. The concentration of total RNA (ng/μL) for the different samples was added below the figure. (E) Representative brightfield microscopy images illustrating proplatelet formation in blood-derived stem cell cultures after 8 days of MK differentiation showing shorter proplatelets with reduced ramification in cultures from patients IV.2 and III.4, compared with the control. Scale bar, 100 μm. (F) Quantification of the RIN values obtained for RNA samples from days 6 and 8 MK differentiated from blood-derived stem cells of patients IV.2 and III.4 vs a control (4 technical replicates for control days 6 and 8, patient IV.2 days 6 and 8, and patient III.4 day 8, 5 technical replicates for patient III.4 day 6). Statistical analyses were performed using the Wilcoxon test.
Figure 2.
Figure 2.
SLFN14 deficiency results in defective MK differentiation. (A) Example plots of flow cytometry analysis of day 4 differentiated imMKCL cells, indicating the percentage of CD41a+, CD42a+, and CD41a+/CD42a+ MK. WT/WT cells were measured at passage weeks 9 and 14, and WT/K219N and K219N/K219N cells were measured at passage weeks 2 and 7. (B) Percentage of CD41a+/CD42a+ cells over time for 2 clones each of WT/K219N and K219N/K219N cells (left). A trend line with error margins (gray area) was fitted for WT/WT cells measured over 14 weeks in culture and added to the graph. Comparison of mean CD41a+/CD42a+ cells for WT/WT, WT/K219N, and K219N/K219N cells show a significant decrease in double positive cells in SLFN14-deficient cells, as measured during different passage weeks (right). Boxplots represent the middle 50% of the data points, with 25% outliers as whiskers and the mean as a black horizontal line. All individual data points were added as dots to the graph. P values were determined using the pairwise Wilcoxon test.
Figure 3.
Figure 3.
SLFN14-deficient MKs display reduced proplatelet formation. (A) Representative brightfield microscopy images illustrating proplatelet formation on differentiation day 5 in WT/WT, WT/K219N, and K219N/K219N cells (left). Proplatelets formed in WT/K219N and K219N/K219N cells are shorter and with a reduced ramification compared with those formed in WT/WT cells (arrows). Imaging was performed on cells at passage week 5 for WT/WT and WT/K219N, and week 3 for K219N/K219N. Quantification of proplatelet-forming cells on day 5 for 3 independent differentiations shows a significant decrease in both WT/K219N and K219N/K219N cells compared with WT/WT (right). On average, 133, 114, and 120 total number of cells were counted for WT/WT, WT/K219N, and K219N/K219N cells, respectively. Statistics performed with a pairwise Wilcoxon test. Boxplots represent the middle 50% of the data points with 25% outliers as whiskers and the mean as a black horizontal line. All individual data points were added as dots to the graph. (B) SiR-tubulin in vivo staining of day 5 differentiated MK shows the presence of shorter proplatelets with reduced ramification for WT/K219N and K219N/K219N conditions compared with WT/WT MK (representative images from a blinded assay). Scale bars, 100 μm.
Figure 4.
Figure 4.
SLFN14-deficient MKs show a mitochondrial defect. (A) Transmission EM imaging of differentiation day 3 MK cells shows abnormal mitochondria in SLFN14-deficient MK compared with WT/WT MK. Images taken after a blinded analysis of MK at passage week 17 for WT/WT and WT/K219N and week 3 for K219N/K219N. (B) Confocal imaging of day 4 MK cells from WT and mutant imMKCL with MitoTracker Red to visualize (top) and quantify (bottom) mitochondria. Imaging performed at passage week 6 for WT/K219N and K219N/K219N, and week 13 for WT/WT. Quantification of the mean number (nr) of branches per mitochondrial network (bottom left) and mean mitochondrial branch length (bottom right) as calculated by the Mitochondrial Network Analysis software for 25 randomly selected MK containing a single nucleus for each condition. P values were determined using the pairwise Wilcoxon test for all comparisons. (C) Confocal imaging of day 8 MK from blood-derived stem cells using the ATP5E antibody (green) to visualize (top) and quantify (bottom) mitochondria. Phalloidin staining in red. Quantification of the mean number of branches per mitochondrial network (bottom) as calculated by the Mitochondrial Network Analysis software for 25 randomly selected MK containing a single nucleus for each condition. P values were determined using the Wilcoxon test. (D) OCR measurements were obtained over time (minutes) using the extracellular flux analyzer from Seahorse Bioscience for WT/WT, WT/K219N, and K219N/K219N MK on day 4 (left). Values represent the mean and standard deviation for each condition of the Seahorse assays obtained for 4 replicates from 2 differentiation experiments. The mitochondrial stress test was used to obtain diverse parameters: ATP-linked OCR (by adding the ATP synthase inhibitor oligomycin), maximal OCR (by adding the uncoupling agent FCCP), and complete inhibition of the mitochondria (by adding the inhibitor antimycin) (right top). The maximal respiration capacity and ATP-linked respiration were significantly reduced for WT/K219N and K219N/K219N MK compared with WT/WT MK (right). Statistics using a pairwise Wilcoxon test was performed. Boxplots in all panels represent the middle 50% of the data points with, 25% outliers as whiskers and the mean as a black horizontal line. All individual data points were added as dots to the graph. (E) Representative gel electrophoresis image showing rRNA degradation fragments (red arrows) for day 4 differentiated WT/K219N and K219N/K219N MK that are not present in WT/WT MK or undifferentiated cells (left). Experiments performed at passage week 5 for day 0 and week 7 for day 4. The concentration of total RNA (ng/μL) for the different samples was added below the figure. Quantification of the RIN values obtained for RNA samples of imMKCL cells from 4 (day 0) and 9 (day 4) independent differentiation experiments on days 0 and 4 WT/WT, WT/K219N, and K219N/K219N MK (multiple technical replicates included per time point per condition) (right). Experiments performed at passage weeks 2, 3, 4, 5, 7, 9, 12, 23, and 25. Boxplots represent the middle 50% of the data points with, 25% outliers as whiskers and the mean as a black horizontal line. All individual data points were added as dots to the graph. Statistical analyses were performed using the pairwise Wilcoxon test for all comparisons. Scale bars, 1 μm (A) and 10 μm (B-C).
Figure 5.
Figure 5.
Platelet RNA-seq analysis shows extensive gene expression differences with upregulation of translation and transcription pathways in SLFN14 K219N carriers. (A) Dotplot showing the RIN value vs rRNA ratio of platelet RNA-seq samples from SLFN14 patients IV.2 and III.4, 19 healthy controls, and 26 unrelated, undiagnosed patients with a platelet function (PF) defect or TP. (B) Principal component (PC) analysis plot based on the top 500 genes with the highest variance among samples. (C) Boxplot showing tmm-normalized counts for SLFN14 in patients IV.2 and III.4 and 20 controls as detected by total RNA-seq. Boxplots represent the middle 50% of the data points with, 25% outliers as whiskers and the mean as a black horizontal line. (D) Heatmap showing tmm-normalized counts for all expressed (>10 reads on average in the control group) mitochondrial (M) RPGs and RPGs in patients IV.2 and III.4 and controls. Statistics were performed using the Wilcoxon test. (E) A gene-gene association network for all significantly upregulated genes (log2 fold change >1, false discovery rate <0.05) in platelets from patients IV.2 and III.4, created in Cytoscape. Five subnetworks among the 2762 nodes were identified in the largest connected network. The zoom-in images show the mitochondrial RPGs (green) and RPGs (light blue). TCA, tricarboxylic acid.
Figure 6.
Figure 6.
Overactivation of mTORC1 pathway acts as a compensatory mechanism for rRNA degradation. (A) Schematic overview of the mTORC1 pathway. We hypothesized that increased rRNA degradation mediated by SLFN14 K219N stimulates mTORC1 signaling as a compensatory mechanism. Active mTORC1 signaling stimulates ribosomal biogenesis via phosphorylation of S6K1-T389. In addition, mTORC1 is involved in cell growth, survival, motility, and mitochondrial biogenesis. Figure created using BioRender.com. (B) Representative immunoblots showing phosphorylated S6K1-T389 protein expression in undifferentiated cells and day 4 MK for WT/WT, WT/K219N, and K219N/K219N conditions (left). Glyceraldehyde-3-phosphate dehydrogenase (GAPDH) was used as the loading control for normalization. Quantification of immunoblot data for 6 (day 0) and 7 (day 4) independent differentiation experiments show a significant increase in S6K1-T389 phosphorylation in WT/K219N and K219N/K219N day 4 MK compared with WT/WT, whereas no difference was seen in undifferentiated cells (day 0). Analysis performed on cells between passage weeks 10 to 13 for WT/WT and between weeks 3 and 6 for WT/K219N and K219N/K219N (right). Statistics were performed with a pairwise Wilcoxon test for all comparisons. (C) Immunoblot analysis showing a complete lack of S6K1-T389 phosphorylated protein in day 4 MK treated with rapamycin (and without) at passage week 5. GAPDH was used as a loading control. (D) Gel electrophoresis analysis shows rapamycin treatment exacerbates rRNA degradation in SLFN14 K219N cells. Analysis of cells at passage week 5. (E) Electrophoresis traces of rapamycin-treated cells show increased RNA degradation fragment peaks (red arrows) and reduced 28S peaks (light blue arrows) in WT/K219N cells and an even stronger effect in K219N/K219N day 4 MK. Analysis performed on cells at passage week 5. (F) Treatment with rapamycin significantly reduces the area of the 28S peak for both WT/K219N and K219N/K219N on day 4 MK. Analysis performed on cells between passage weeks 3 to 5. Statistics were performed with a pairwise Wilcoxon test for all comparisons. Boxplots for all panels represent the middle 50% of the data points, with 25% outliers as whiskers and the mean as a black horizontal line. All individual data points were added as dots to the graph. FU, fluorescence units; NT, nucleotides.
Figure 7.
Figure 7.
Variants in positively charged patches flanking the binding valley of SLFN14 result in altered protein function. (A) Sequence homology between human SLFN14 and SLFN13 shows conservation of positively charged amino acid side chains for known TP-related variants (yellow highlight). “∗” indicates a fully conserved residue; “:” a conservation between groups of strongly similar properties, scoring >0.5 in the Gonnet PAM 250 matrix; and “.” a conservation between groups of weakly similar properties, scoring ≤0.5 in the Gonnet PAM 250 matrix. (B) Overview of the complete SLFN14 monomer (P0C7P3). Model based on known SLFN13 protein structure. Important function regions have been highlighted. (C) Closeup view of the valley region of SLFN14, containing positively charged residues with known variants related to TP (K218, K219, V220, and R223).

Comment in

References

    1. Liu F, Zhou P, Wang Q, Zhang M, Li D. The Schlafen family: complex roles in different cell types and virus replication. Cell Biol Int. 2018;42(1):2–8. - PubMed
    1. Fletcher SJ, Johnson B, Lowe GC, et al. SLFN14 mutations underlie thrombocytopenia with excessive bleeding and platelet secretion defects. J Clin Invest. 2015;125(9):3600–3605. - PMC - PubMed
    1. Stapley RJ, Pisareva VP, Pisarev AV, Morgan NV. SLFN14 gene mutations associated with bleeding. Platelets. 2020;31(3):407–410. - PMC - PubMed
    1. Marconi C, di Buduo CA, Barozzi S, et al. SLFN14-related thrombocytopenia: identification within a large series of patients with inherited thrombocytopenia. Thromb Haemost. 2016;115(5):1076–1079. - PubMed
    1. Fletcher SJ, Pisareva VP, Khan AO, Tcherepanov A, Morgan NV, Pisarev AV. Role of the novel endoribonuclease SLFN14 and its disease-causing mutations in ribosomal degradation. RNA. 2018;24(7):939–949. - PMC - PubMed

Publication types

MeSH terms