. 2023 May 24;33(11):7100-7119.
doi: 10.1093/cercor/bhad024.

Poorer sleep health is associated with altered brain activation during cognitive control processing in healthy adults

Affiliations

Poorer sleep health is associated with altered brain activation during cognitive control processing in healthy adults

Hanne Smevik et al. Cereb Cortex. .

Abstract

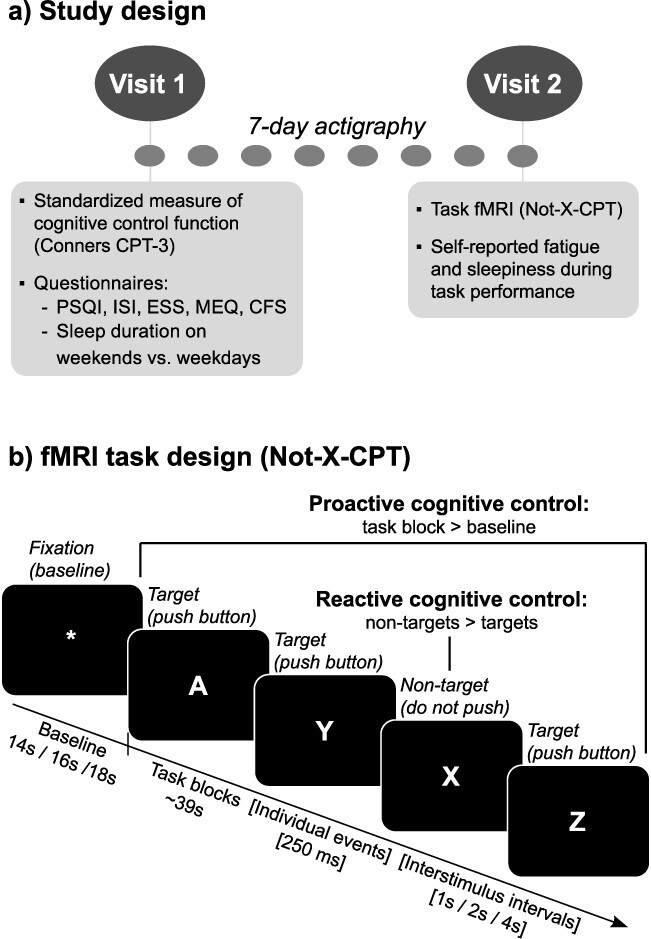
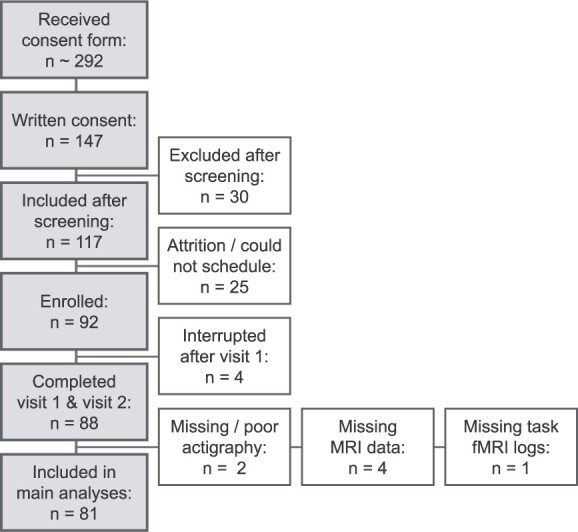
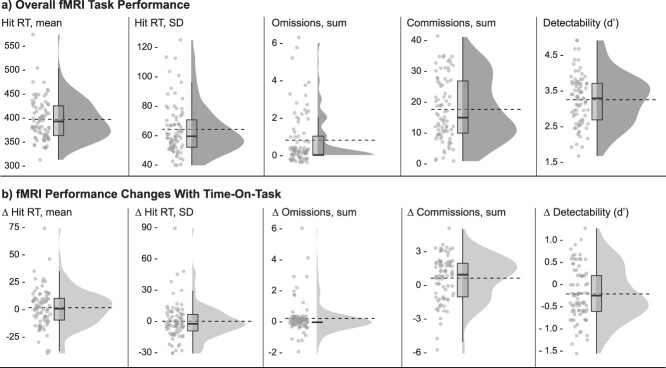
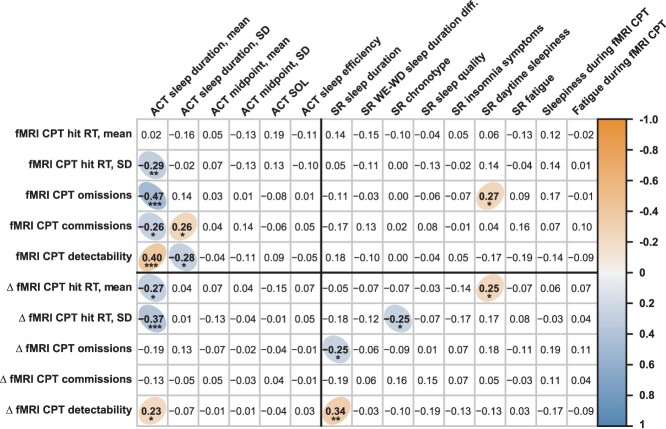
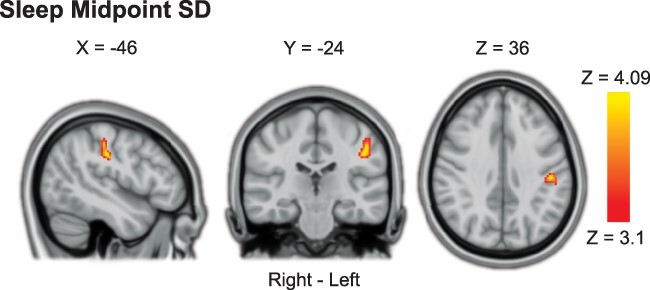
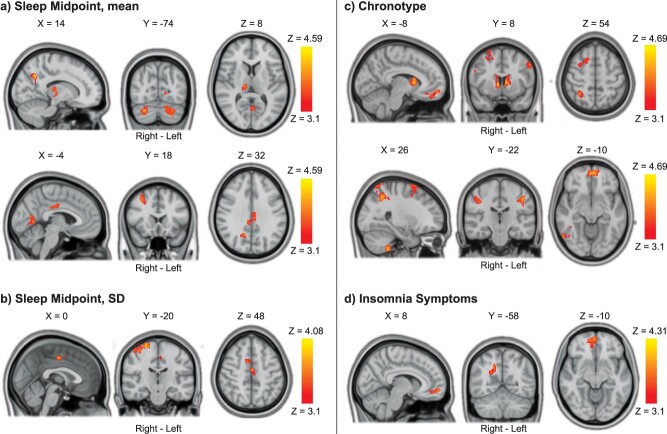
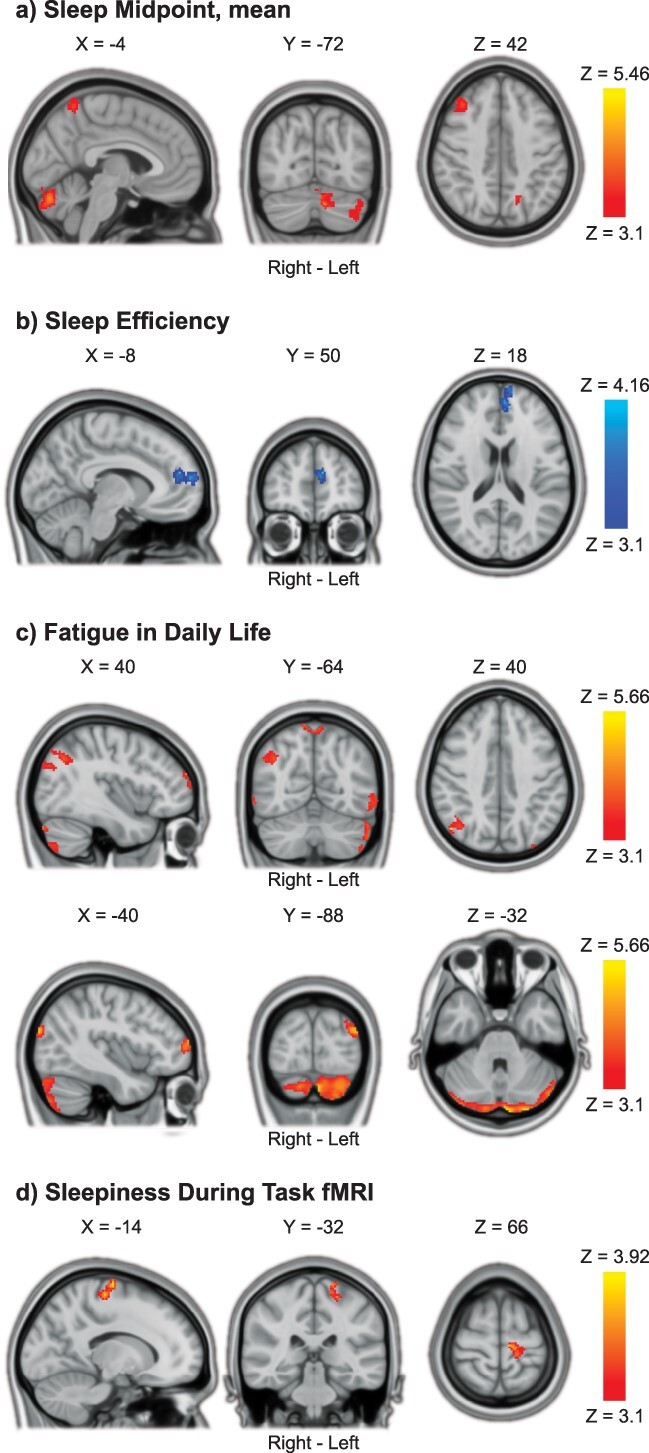
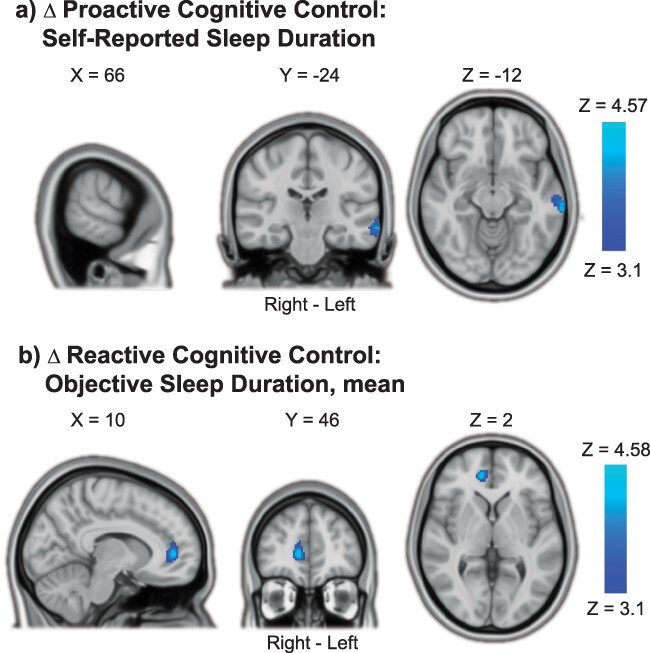
This study investigated how proactive and reactive cognitive control processing in the brain was associated with habitual sleep health. BOLD fMRI data were acquired from 81 healthy adults with normal sleep (41 females, age 20.96-39.58 years) during a test of cognitive control (Not-X-CPT). Sleep health was assessed in the week before MRI scanning, using both objective (actigraphy) and self-report measures. Multiple measures indicating poorer sleep health-including later/more variable sleep timing, later chronotype preference, more insomnia symptoms, and lower sleep efficiency-were associated with stronger and more widespread BOLD activations in fronto-parietal and subcortical brain regions during cognitive control processing (adjusted for age, sex, education, and fMRI task performance). Most associations were found for reactive cognitive control activation, indicating that poorer sleep health is linked to a "hyper-reactive" brain state. Analysis of time-on-task effects showed that, with longer time on task, poorer sleep health was predominantly associated with increased proactive cognitive control activation, indicating recruitment of additional neural resources over time. Finally, shorter objective sleep duration was associated with lower BOLD activation with time on task and poorer task performance. In conclusion, even in "normal sleepers," relatively poorer sleep health is associated with altered cognitive control processing, possibly reflecting compensatory mechanisms and/or inefficient neural processing.

Keywords: continuous performance test; executive function; magnetic resonance imaging; neuropsychology; sleep.


Conflict of interest statement

PMT received partial grant support from Biogen, Inc., for research unrelated to this manuscript. AO is an owner and medical advisor for Nordic Brain Tech AS.

Figures

Fig. 1
Fig. 1
Overview of study design and sleep health measures. a) Participants completed two study visits, and naturalistic, habitual sleep was measured during the 7 nights between visits using actigraphy. Visits were at the same time of day (between 8 AM and 3 PM) for each participant. At visit 1, participants completed a computerized, standardized test of cognitive control (Conners CPT-3), as well as a series of validated questionnaires on sleep health and fatigue. They also received actigraphs and sleep diaries (used for quality control of actigraphy data). At visit 2, participants completed a ~30-min task fMRI session and were asked to report their current level of mental fatigue and sleepiness halfway through the task. b) To test cognitive control function, we used a “Not-X-CPT” task adapted to a mixed block/event-related fMRI design (Olsen et al. 2013, 2018). Letters were consecutively presented on the screen and participants were asked to respond to press a response button as quickly and accurately as possible whenever a target (letters A–Z) was presented, and not respond when a nontarget (letter X) was presented. The task consisted of a total of 480 stimuli (10% nontargets), with a stimulus duration of 250 ms, and varying interstimulus intervals of 1, 2, or 4 s (jittered), to allow for event-related fMRI analysis (Petersen and Dubis 2012). The task was presented in two separate runs, each lasting ~15 min, containing 16 task blocks (duration ~39 s) and 16 baseline blocks (varying interblock intervals of 14, 16, or 18 s). To eliminate systematic order effects, the different task parameters (interblock intervals, stimulus type, block type, and interstimulus intervals) were counterbalanced within and between the two task runs. See Olsen et al. (2013, 2018) for more details on the task design. For use in our primary/secondary analyses, the following contrasts were computed: (i) Proactive Cognitive Control (task blocks > fixations), Reactive Cognitive Control (nontargets > targets), as well as (ii) TOT change for each contrast (∆ Proactive Cognitive Control and ∆ Reactive Cognitive Control). CPT = continuous performance test, PSQI = Pittsburgh Sleep Quality Index, ISI = Insomnia Severity Index, ESS = Epworth Sleepiness Scale, MEQ = Morningness-Eveningness Questionnaire, CFS = Chalder Fatigue Scale, TOT = time-on-task.
Fig. 2
Fig. 2
Overview of inclusion process.
Fig. 3
Fig. 3
fMRI task performance. Individual means for each outcome variable are plotted as raincloud plots (Allen et al. 2021) with overlaid boxplots, as well as dashed horizontal lines indicating group means. a) Overall task performance and b) performance change scores (∆) with time on task (Time epoch 4—Time epoch 1). Hit RT and hit RT SD refer to target responses (letters A–Z). Omissions refer to missed target letters (A–Z), and commissions refer to pushed nontargets (X). Detectability (d’) refers to the ability to discriminate targets from nontargets.
Fig. 4
Fig. 4
Partial correlations between task fMRI performance and sleep health measures. The correlogram depicts partial correlation coefficients (Spearman’s rho; adjusted for age, sex, and education) between fMRI task performance measures (Y-axis) and the different sleep health measures (X-axis). Measures of overall task performance are listed above the horizontal black line and measures of TOT changes (∆) are listed below the line. Objective measures of sleep (actigraphy-derived) are listed to the left of the vertical black line and self-report measures are listed to the right of the line. Statistically significant correlations (P < 0.05, not corrected for multiple comparisons) are marked with colored ellipses (positive correlations in orange and negative correlations in blue). Given the explorative purpose of this analysis, no formal correction for multiple comparisons was performed, and results should therefore be considered preliminary. To indicate which findings would survive stricter statistical thresholds, significant correlations have been labeled according to their uncorrected P-value (* = P < 0.05, ** = P < 0.01, *** = P < 0.001). ACT = actigraphy, SR = self-reported, CPT = continuous performance test.
Fig. 5
Fig. 5
Association between proactive cognitive control processing and sleep midpoint SD. More variable sleep midpoint (midpoint SD) was associated with stronger proactive cognitive control activation in the left postcentral gyrus. Results were obtained using mixed-effects models and are presented on a 1-mm MNI standard space template. Cluster-based inference was used to control the FWE rate in each model (cluster-defining threshold = Z > 3.1, cluster probability threshold = P < 0.05). Slices that best represent the cluster have been selected. As these are 2D representations of 3D volumes, the cluster may only be partly visible. See Table 3 for details on cluster size/coordinates. MNI = Montreal Neurological Institute.
Fig. 6
Fig. 6
Associations between reactive cognitive control processing and sleep health. a) Later sleep midpoint was associated with higher reactive cognitive control activations in the cerebellum, lingual gyrus, thalamus, right precuneus cortex, posterior cingulate gyrus, and right middle frontal gyrus. b) More variable sleep midpoint (midpoint SD) was associated with higher reactive cognitive control activation in the precentral/postcentral gyrus and in the juxtapositional lobule (supplementary motor area). c) Later chronotype preference was associated with widespread higher reactive cognitive control activation, including frontal, parietal, and temporal cortex as well as the cerebellum, caudate, and thalamus. d) Higher levels of insomnia symptoms were associated with higher reactive cognitive control processing in the right precuneus and ventromedial frontal cortex. Results were obtained using mixed-effects models and are presented on a 1-mm MNI standard space template. Cluster-based inference was used to control the FWE rate in each model (cluster-defining threshold = Z > 3.1, cluster probability threshold = P < 0.05). Slices that are most representative for the overall findings (anatomical, and across different clusters) have been selected. As these are 2D representations of 3D volumes, some of the clusters may only be partly visible. See Table 3 for details on cluster size/coordinates. MNI = Montreal Neurological Institute.
Fig. 7
Fig. 7
TOT increases in proactive cognitive control associated with sleep health. a) Later sleep midpoint was associated with increased proactive cognitive control activations in the cerebellum, precuneus cortex, and right middle frontal gyrus with TOT. b) Lower sleep efficiency was associated with increased proactive cognitive control activations in the paracingulate gyrus/left frontal pole with TOT. c) More problems with fatigue in daily life were associated with increased proactive cognitive control activations in widespread areas of the brain, including the cerebellum, occipital cortex, precuneus, and frontal pole with TOT. d) Higher levels of sleepiness during fMRI task performance were associated with increased proactive cognitive control activations in the left precentral/postcentral gyrus with TOT. Results were obtained using mixed-effects models and are presented on a 1-mm MNI standard space template. Cluster-based inference was used to control the FWE rate in each model (cluster-defining threshold = Z > 3.1, cluster probability threshold = P < 0.05). Slices that are most representative for the overall findings (anatomical, and across different clusters) have been selected. As these are 2D representations of 3D volumes, some of the clusters may only be partly visible. See Table 4 for details on cluster size/coordinates. TOT = time on task, MNI = Montreal Neurological Institute.
Fig. 8
Fig. 8
TOT decreases in cognitive control processing with shorter sleep duration. a) Shorter self-reported sleep duration was associated with decreased proactive cognitive control activations in the left middle temporal gyrus with TOT. b) Shorter objective sleep duration (7-day mean) was associated with decreased reactive cognitive control activation in the right paracingulate/anterior cingulate gyrus with TOT. Results were obtained using mixed-effects models and are presented on a 1-mm MNI standard space template. Cluster-based inference was used to control the FWE rate in each model (cluster-defining threshold = Z > 3.1, cluster probability threshold = P < 0.05). Slices that best represent the clusters have been selected. As these are 2D representations of 3D volumes, the clusters may only be partly visible. See Table 4 for details on cluster size/coordinates. TOT = time on task, MNI = Montreal Neurological Institute.

Similar articles

Cited by

References

    1. Abraham A. The world according to me: personal relevance and the medial prefrontal cortex. Front Hum Neurosci. 2013:7. - PMC - PubMed
    1. Akerstedt T, Gillberg M. Subjective and objective sleepiness in the active individual. Int J Neurosci. 1990:52:29–37. - PubMed
    1. Alfini AJ, Tzuang M, Owusu JT, Spira AP. Later-life sleep, cognition, and neuroimaging research: an update for 2020. Curr Opin Behav Sci, Sleep and cognition. 2020:33:72–77. - PMC - PubMed
    1. Allen S, Elder G, Longstaff L, Gotts Z, Sharman R, Akram U, Ellis J. Exploration of potential objective and subjective indicators of sleep health in normal sleepers. Nat Sci Sleep. 2018:10:303–312. - PMC - PubMed
    1. Allen M, Poggiali D, Whitaker K, Marshall TR, Langen J van, Kievit RA. Raincloud plots: a multi-platform tool for robust data visualization [version 2; peer review: 2 approved]. Wellcome Open Res. 2021:4:63. - PMC - PubMed

Publication types