. 2022 Jul;178(3):488-503.
doi: 10.1002/ajpa.24521. Epub 2022 Apr 14.

Genomic analysis reveals geography rather than culture as the predominant factor shaping genetic variation in northern Kenyan human populations

Affiliations

Genomic analysis reveals geography rather than culture as the predominant factor shaping genetic variation in northern Kenyan human populations

Angela M Taravella Oill et al. Am J Biol Anthropol. 2022 Jul.

Abstract

Objectives: The aim of this study was to characterize the genetic relationships within and among four neighboring ethnolinguistic groups in northern Kenya in light of cultural relationships to understand the extent to which geography and culture shape patterns of genetic variation.

Materials and methods: We collected DNA and demographic information pertaining to aspects of social identity and heritage from 572 individuals across the Turkana, Samburu, Waso Borana, and Rendille of northern Kenya. We sampled individuals across a total of nine clans from these four groups and, additionally, three territorial sections within the Turkana and successfully genotyped 376 individuals.

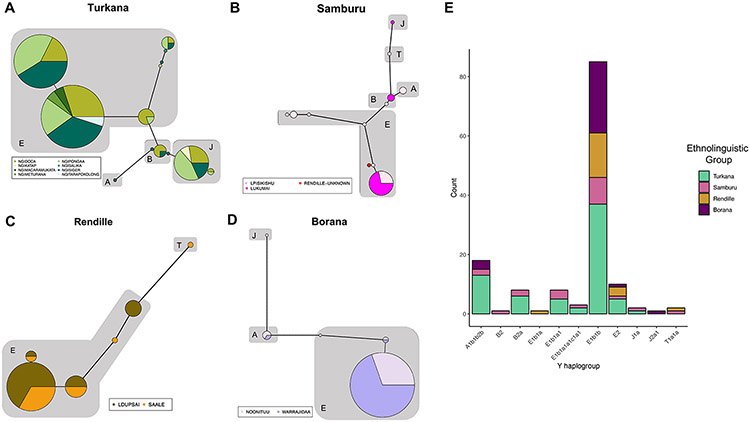
Results: Here we report that geography predominately shapes genetic variation within and among human groups in northern Kenya. We observed a clinal pattern of genetic variation that mirrors the overall geographic distribution of the individuals we sampled. We also found relatively higher rates of intermarriage between the Rendille and Samburu and evidence of gene flow between them that reflect these higher rates of intermarriage. Among the Turkana, we observed strong recent genetic substructuring based on territorial section affiliation. Within ethnolinguistic groups, we found that Y chromosome haplotypes do not consistently cluster by natal clan affiliation. Finally, we found that sampled populations that are geographically closer have lower genetic differentiation, and that cultural similarity does not predict genetic similarity as a whole across these northern Kenyan populations.

Discussion: Overall, the results from this study highlight the importance of geography, even on a local geographic scale, in shaping observed patterns of genetic variation in human populations.

Keywords: Africa; Kenya; cultural FST; culture; genetic FST; genetic structure; geography; social organization.


Conflict of interest statement

Declaration of Interests

The authors declare no competing interests.

Figures

Figure 1.
Figure 1.. Intermarriage among ethnolinguistic groups contributes to the clinal pattern of genetic variation.
Sampling regions, patterns of genetic variation, and rates of intermarriage across northern Kenya human populations. A) We sampled 376 individuals across four ethnolinguistic groups in northern Kenya and for the Turkana only, we additionally sampled across three territorial sections. B) Autosomal principal components analysis (PCA). C) Rate of intermarriage across each ethnolinguistic group. Points in A and B represent sampled ethnolinguistic groups and Turkana territorial sections. Colors represent ethnolinguistic group affiliation, and shapes represent Turkana territorial section affiliation. Each point in A represents the geographic location of each sampled group, while the points in B represent individuals.
Figure 2.
Figure 2.. The Turkana have additional variation and geography-based substructuring.
A) ADMIXTURE analysis for 10 replicates of K = 2 - 5 for the autosomes. Each vertical bar represents an individual, and the colors represent the proportion of ancestry corresponding to K. Samples are organized by ethnolinguistic groups (separated by thick black vertical bars), then by Turkana territorial sections (separated by medium black vertical bars), and lastly by natal clan affiliation (separated by thin black vertical bars). We observe no substructure based on natal clan affiliation but do observe geographic substructuring in the Turkana based on territorial section (purple and blue clusters at K = 4 and 5). B) Autosomal genetic differentiation (FST) among Turkana territorial sections. Individuals from Ngibochoros territorial section are more genetically different than individuals from the other sampled territories. C) Autosomal FST among each Turkana territorial section and the other sampled ethnolinguistic groups. We performed a series of pairwise permutations and found that there is no statistical difference in genetic differentiation among Turkana territorial sections and ethnolinguistic groups. P-values from the permutation tests are annotated on the plot.
Figure 3.
Figure 3.. Y chromosome haplotypes do not consistently cluster by natal clan affiliation.
Haplotype networks constructed from Y chromosome SNP data from A) Turkana, B) Samburu, C) Rendille and D) Borana male samples. The size of each node (circle) is proportional to the number of samples in the node (larger nodes have more samples and smallest nodes have 1 sample). Colors within each node represent natal clan affiliation corresponding to the key in each panel.
Figure 4.
Figure 4.. Mitochondrial DNA haplotypes do not consistently cluster by natal clan or ethnolinguistic group affiliation.
Haplotype networks constructed from mitochondrial DNA SNP data from A) Turkana, B) Samburu, C) Rendille and D) Borana male and female samples. The size of each node (circle) is proportional to the number of samples in the node (larger nodes have more samples and smallest nodes have 1 sample). Colors within each node represent natal clan affiliation corresponding to the key in each panel. Major haplogroups are also annotated on each network in grey. E) Stacked bar plots of mitochondrial DNA haplogroups of male and female samples. Bars are colored by ethnolinguistic group affiliation.
Figure 5.
Figure 5.. Geography primarily impacts patterns of genetic differentiation among ethnolinguistic groups.
We calculated autosomal FST (top) and outgroup f3 (bottom) among ethnolinguistic groups. For the outgroup f3 calculations, Yoruba from the 1000 Genomes Resource were used as the outgroup population. Bars are ordered by FST. Dark orange (left) are groups furthest geographically, while the lighter orange bars are groups closest geographically. The Samburu and Rendille (pale orange) are two neighboring groups that speak languages from different language families, yet have the lowest genetic FST observed in our study. Line graph corresponds to the geographic distance between each pair of ethnolinguistic groups.
Figure 6.
Figure 6.. Cultural differentiation does not predict genetic differentiation among human ethnolinguistic groups in northern Kenya.
We performed a series of Pearson's correlations to explore whether cultural differentiation may impact genetic FST. Pearson correlations for A) genetic FST and geographic distance, B) cultural FST and geographic distance, C) genetic FST and cultural FST, D) genetic FST and linguistic distance, E) cultural FST and linguistic distance, and F) geographic distance and linguistic distance. R corresponds to the correlation coefficient; p corresponds to the p-value.

Similar articles

References

    1. 1000 Genomes Project Consortium, Auton Adam, Brooks Lisa D., Durbin Richard M., Garrison Erik P., Kang Hyun Min, Korbel Jan O., et al. 2015. “A Global Reference for Human Genetic Variation.” Nature 526 (7571): 68–74. - PMC - PubMed
    1. Alexander David H., Novembre John, and Lange Kenneth. 2009. “Fast Model-Based Estimation of Ancestry in Unrelated Individuals.” Genome Research 19 (9): 1655–64. - PMC - PubMed
    1. Alsmadi Osama, Thareja Gaurav, Alkayal Fadi, Rajagopalan Ramakrishnan, John Sumi Elsa, Hebbar Prashantha, Behbehani Kazem, and Thanaraj Thangavel Alphonse. 2013. “Genetic Substructure of Kuwaiti Population Reveals Migration History.” PloS One 8 (9): e74913. - PMC - PubMed
    1. Babiker Hiba Ma, Schlebusch Carina M., Hassan Hisham Y., and Jakobsson Mattias. 2011. “Genetic Variation and Population Structure of Sudanese Populations as Indicated by 15 Identifiler Sequence-Tagged Repeat (STR) Loci.” Investigative Genetics 2 (1): 12. - PMC - PubMed
    1. Behr Aaron A., Liu Katherine Z., Liu-Fang Gracie, Nakka Priyanka, and Ramachandran Sohini. 2016. “Pong: Fast Analysis and Visualization of Latent Clusters in Population Genetic Data.” Bioinformatics 32 (18): 2817–23. - PMC - PubMed

Publication types

LinkOut - more resources