. 2023 Feb 1;6(2):e2255978.
doi: 10.1001/jamanetworkopen.2022.55978.

Seroprevalence of Antibodies to SARS-CoV-2 in Rural Households in Eastern Uganda, 2020-2022

Affiliations

Seroprevalence of Antibodies to SARS-CoV-2 in Rural Households in Eastern Uganda, 2020-2022

Jessica Briggs et al. JAMA Netw Open. .

Abstract

Importance: Estimating the true burden of SARS-CoV-2 infection has been difficult in sub-Saharan Africa owing to asymptomatic infections and inadequate testing capacity. Antibody responses from serologic surveys can provide an estimate of SARS-CoV-2 exposure at the population level.

Objective: To estimate SARS-CoV-2 seroprevalence, attack rates, and reinfection in eastern Uganda using serologic surveillance from 2020 to early 2022.

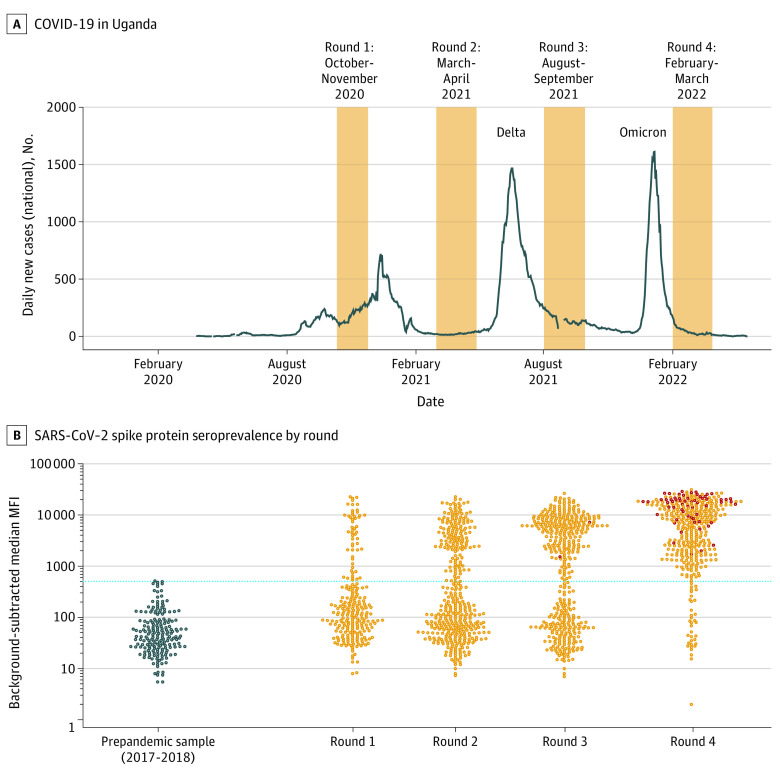
Design, setting, and participants: This cohort study was conducted in the Tororo and Busia districts of eastern Uganda. Plasma samples from participants in the Program for Resistance, Immunology, Surveillance, and Modeling of Malaria in Uganda Border Cohort were obtained at 4 sampling intervals: October to November 2020, March to April 2021, August to September 2021, and February to March 2022. Each participant contributed up to 4 time points for SARS-CoV-2 serology, with almost half of all participants contributing at all 4 time points, and almost 90% contributing at 3 or 4 time points. Information on SARS-CoV-2 vaccination status was collected from participants, with the earliest reported vaccinations in the cohort occurring in May 2021.

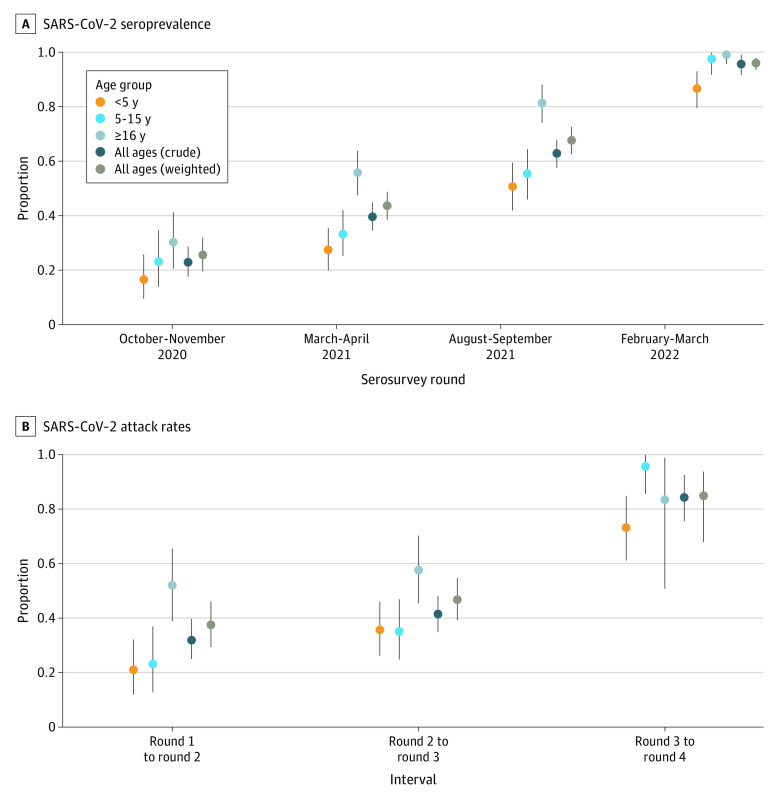
Main outcomes and measures: The main outcomes of this study were antibody responses to the SARS-CoV-2 spike protein as measured with a bead-based serologic assay. Individual-level outcomes were aggregated to population-level SARS-CoV-2 seroprevalence, attack rates, and boosting rates. Estimates were weighted by the local age distribution according to census data.

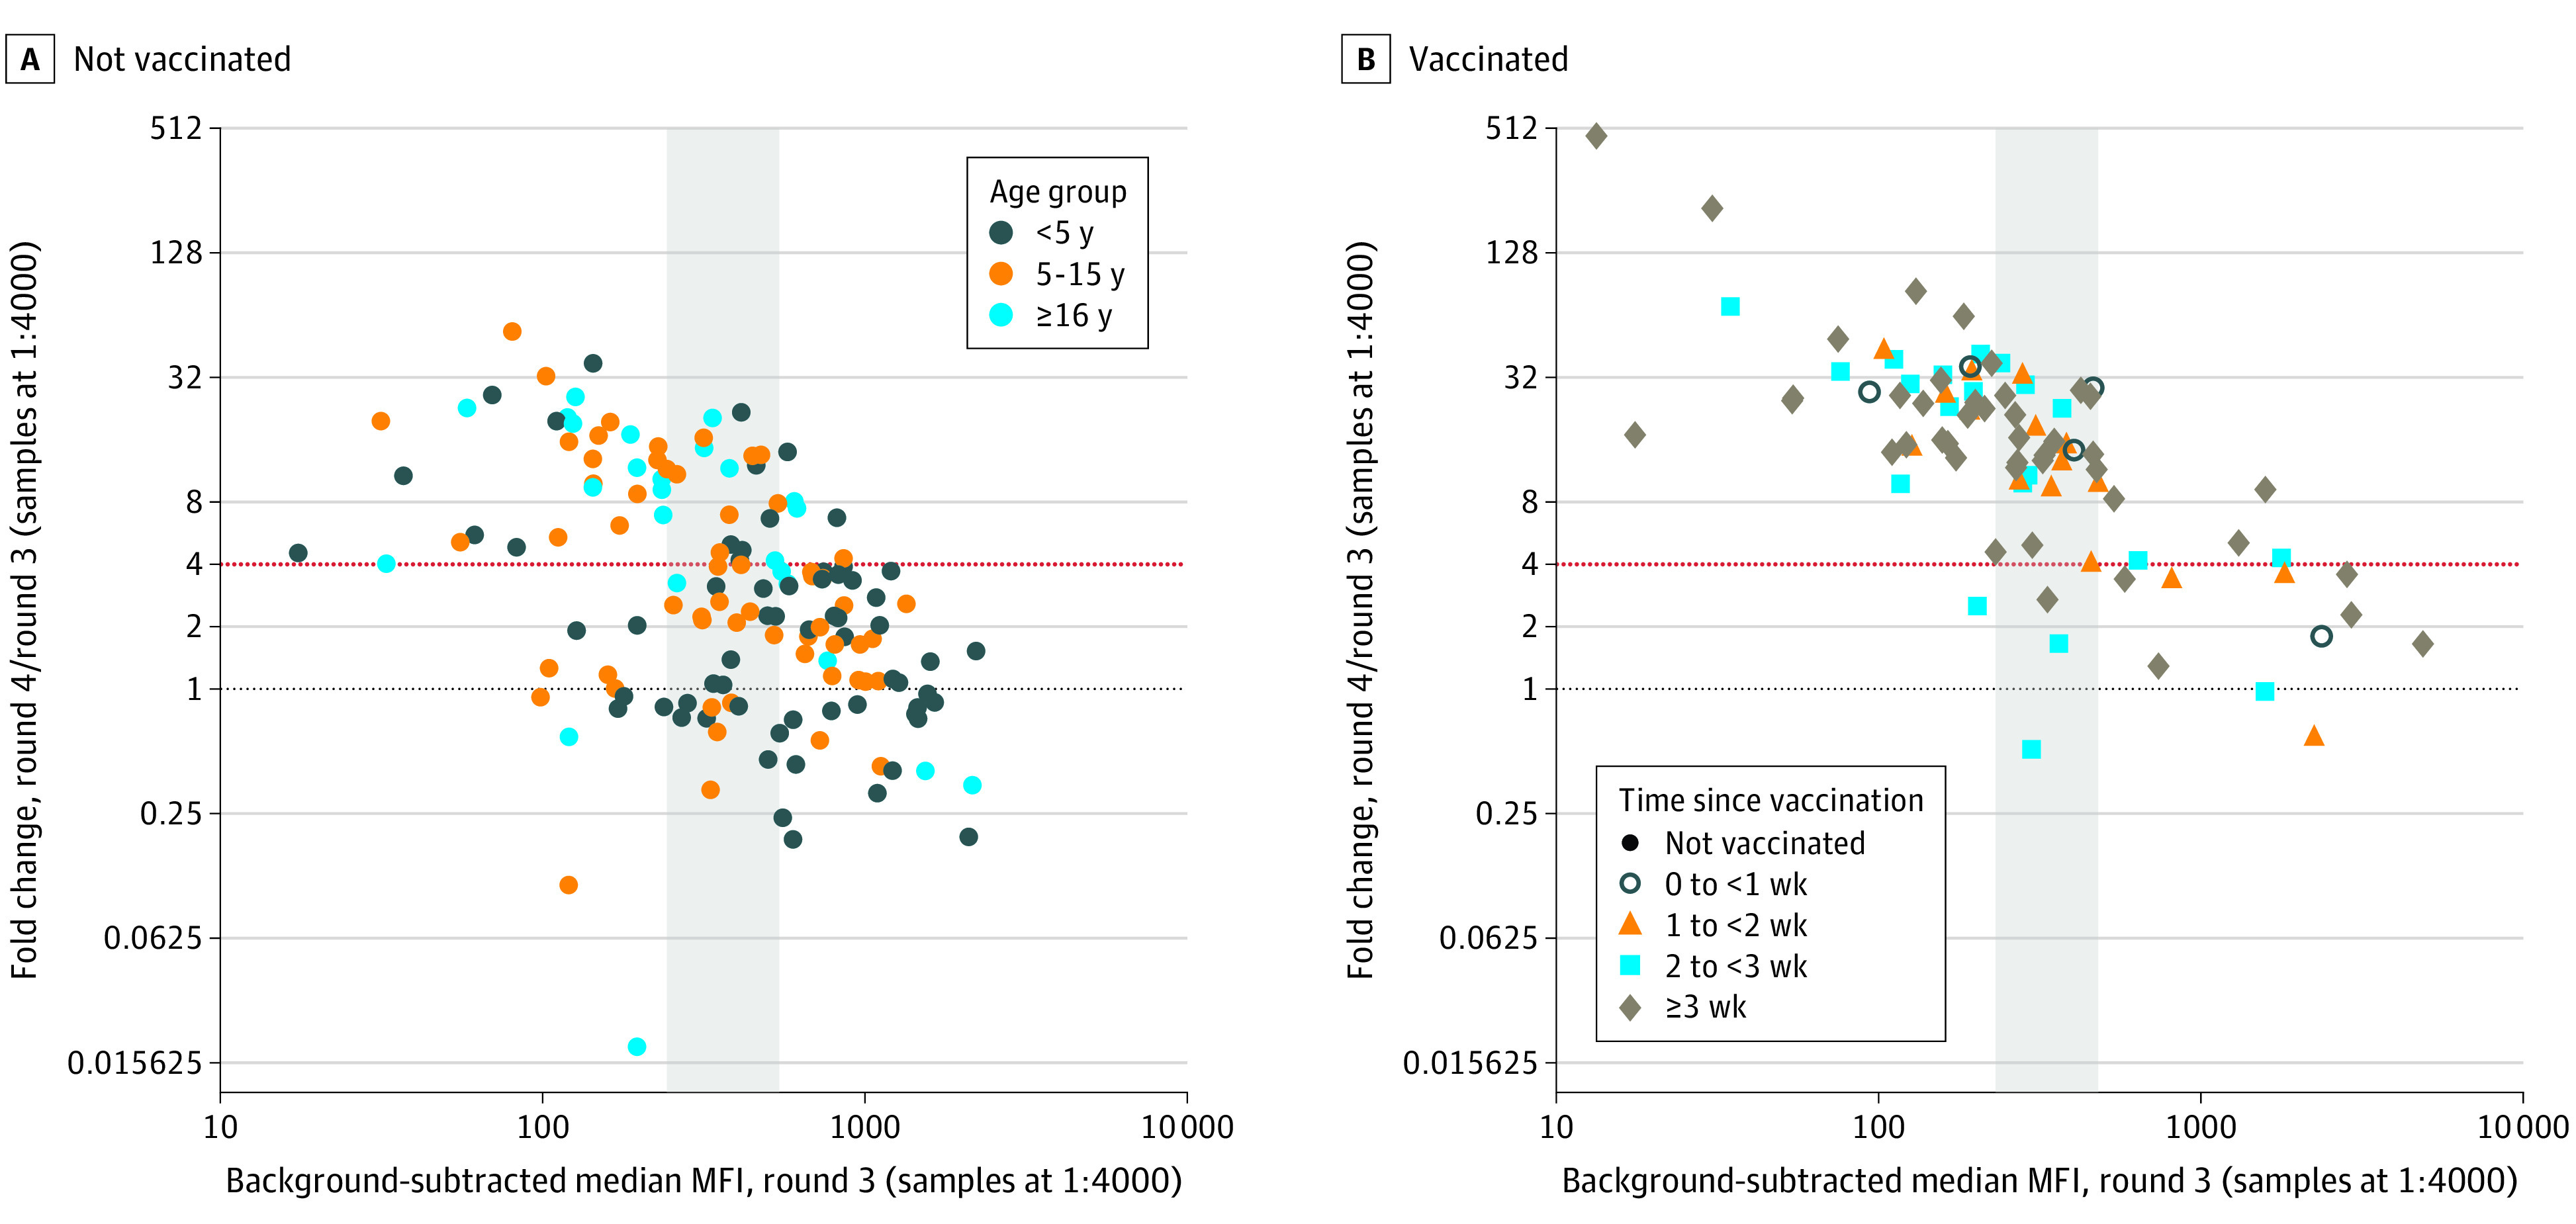
Results: A total of 1483 samples from 441 participants living in 76 households were tested. Of the 441 participants, 245 (55.6%) were female, and their mean (SD) age was 16.04 (16.04) years. By the end of the Delta wave and before widespread vaccination, adjusted SARS-CoV-2 seroprevalence was 67.7% (95% credible interval [CrI], 62.5%-72.6%) in the study population. During the subsequent Omicron wave, 84.8% (95% CrI, 67.9%-93.7%) of unvaccinated, previously seronegative individuals were infected for the first time, and 50.8% (95% CrI, 40.6%-59.7%) of unvaccinated, already seropositive individuals were likely reinfected, leading to an overall seropositivity of 96.0% (95% CrI, 93.4%-97.9%) in this population. These results suggest a lower probability of reinfection in individuals with higher preexisting antibody levels. There was evidence of household clustering of SARS-CoV-2 seroconversion. No significant associations were found between SARS-CoV-2 seroconversion and gender, household size, or recent Plasmodium falciparum malaria exposure.

Conclusions and relevance: In this cohort study in a rural population in eastern Uganda, there was evidence of very high SARS-CoV-2 infection rates throughout the pandemic inconsistent with national level case data and high reinfection rates during the Omicron wave.


Conflict of interest statement

Conflict of Interest Disclosures: None reported.

Figures

Figure 1.
Figure 1.. The SARS-CoV-2 Epidemic in Uganda and in the Program for Resistance, Immunology, Surveillance, and Modeling of Malaria (PRISM) Border Cohort Study
A, Reported daily new COVID-19 cases in Uganda (7-day rolling average), obtained from the Our World in Data database. One week in late August 2021 when more than 21 000 cases were reported in 1 day is omitted. The 4 rounds of the PRISM Border Cohort SARS-CoV-2 serosurveys are shaded orange. B, SARS-CoV-2 seroprevalence by round. The y-axis shows the background-subtracted median mean fluorescent intensity (MFI) of the spike protein antibody response. The left-most bee-swarm plot (dark blue circles) shows responses from 192 prepandemic control samples from the PRISM-2 study (also in Tororo District, Uganda), collected in 2017 to 2018. The subsequent bee-swarm plots show the distribution of antibody responses by serosurvey round. Visits from participants who had received SARS-CoV-2 vaccination by 3 weeks before the serosurvey sample (ie, to allow for seroconversion after vaccination) are shown as dark red circles. The cutoff for seropositivity is shown in the blue dotted line (background-subtracted median MFI = 516). The raw seroprevalence was 22.0% in round 1, 37.9% in round 2, 59.9% in round 3, and 91.0% in round 4.
Figure 2.
Figure 2.. SARS-CoV-2 Seroprevalence and Attack Rates by Age Group and Serosurvey Round
A, Graph shows posterior median (dots) and 95% credible intervals (error bars) for seroprevalence based on spike protein mean fluorescent intensity (MFI), accounting for test performance characteristics. B, Graph shows posterior median (dots) and 95% credible intervals (error bars) for attack rate based on spike protein MFIs. Individuals who had received SARS-CoV-2 vaccination by a serosurvey round are removed from the attack rate estimation (eg, individuals who were vaccinated at round 4 are removed from the attack rate estimation between round 3 and round 4). The colors represent age group-specific estimates. The dark blue values represent the crude estimates in the cohort. The brown values represent estimates weighted by the local age distribution using 2014 census data from the 3 parishes in Uganda in which study participants reside. All estimates are adjusted for test performance characteristics.
Figure 3.
Figure 3.. SARS-CoV-2 Antibody Boosting Between Rounds 3 and 4
A, Round 4 antibody responses among the 232 participants who were seropositive at round 3 (65 participants aged <5 years, 58 participants aged 5-15 years, and 109 participants aged ≥16 years) are shown. The round 3 spike protein antibody response is shown on the x-axis, and the fold change between the round 4 and round 3 spike antibody responses is shown on the y-axis. We defined boosting as a 4-fold or greater increase (red dotted line). B, Participants were separated by vaccination status at round 4 and by tertiles of round 3 response (the second tertile is shown in the gray shaded rectangle). The colors of the points represent age groups, and the shapes of the points represent binned time since SARS-CoV-2 vaccination at the round 4 sample. Note that in panel B, boosting was observed in 41 of 47 participants vaccinated more than 3 weeks before their round 4 sample was collected. Among individuals who were not vaccinated, the proportion who demonstrated antibody boosting was 71% in the first tertile, 42% in the second tertile, and 11% in the third tertile. Among vaccinated individuals, the proportion who demonstrated antibody boosting was 97% in the first tertile, 91% in the second tertile, and 33% in the third tertile.

Similar articles

Cited by

References

    1. Arora RK, Joseph A, Van Wyk J, et al. . SeroTracker: a global SARS-CoV-2 seroprevalence dashboard. Lancet Infect Dis. 2021;21(4):e75-e76. doi:10.1016/S1473-3099(20)30631-9 - DOI - PMC - PubMed
    1. Lewis HC, Ware H, Whelan M, et al. . SARS-CoV-2 infection in Africa: a systematic review and meta-analysis of standardised seroprevalence studies, from January 2020 to December 2021. BMJ Global Health. 2022;7:e008793. doi:10.1136/bmjgh-2022-008793 - DOI - PMC - PubMed
    1. Emily AB, Barekye B, Bower H, et al. . Population-based serosurveys for SARS-CoV-2: key findings from five African countries: November 2020 to June 2021. SSRN. Preprint posted online February 22, 2022. doi:10.2139/ssrn.4040702 - DOI
    1. Nankabirwa J, Bousema T, Blanken SL, et al. . Measures of malaria transmission, infection, and disease in an area bordering two districts with and without sustained indoor residual spraying of insecticide in Uganda. PLoS One. Published online December 30, 2022. doi:10.1371/journal.pone.0279464 - DOI - PMC - PubMed
    1. Tusting LS, Rek J, Arinaitwe E, et al. . Why is malaria associated with poverty? findings from a cohort study in rural Uganda. Infect Dis Poverty. 2016;5(1):78. doi:10.1186/s40249-016-0164-3 - DOI - PMC - PubMed

Publication types

Substances