

Machine Learning Analysis of Postkeratoplasty Endothelial Cell Images for the Prediction of Future Graft Rejection
- PMID: 36790821
- PMCID: PMC9940770
- DOI: 10.1167/tvst.12.2.22
Machine Learning Analysis of Postkeratoplasty Endothelial Cell Images for the Prediction of Future Graft Rejection
Abstract
Purpose: This study developed machine learning (ML) classifiers of postoperative corneal endothelial cell images to identify postkeratoplasty patients at risk for allograft rejection within 1 to 24 months of treatment.
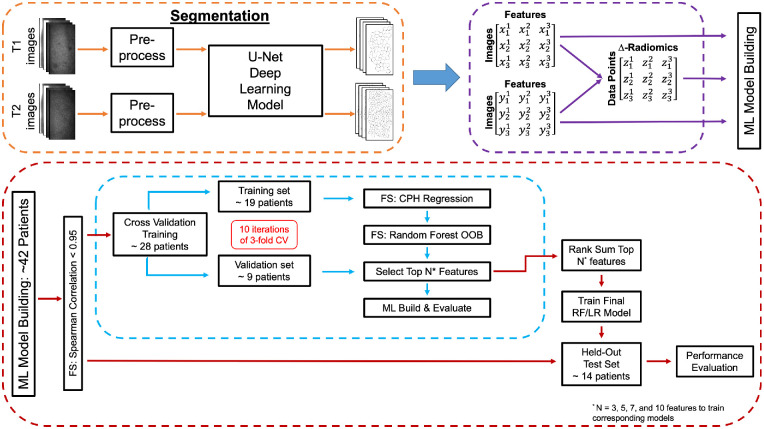
Methods: Central corneal endothelium specular microscopic images were obtained from 44 patients after Descemet membrane endothelial keratoplasty (DMEK), half of whom had experienced graft rejection. After deep learning segmentation of images from all patients' last and second-to-last imaging, time points prior to rejection were analyzed (175 and 168, respectively), and 432 quantitative features were extracted assessing cellular spatial arrangements and cell intensity values. Random forest (RF) and logistic regression (LR) models were trained on novel-to-this-application features from single time points, delta-radiomics, and traditional morphometrics (endothelial cell density, coefficient of variation, hexagonality) via 10 iterations of threefold cross-validation. Final assessments were evaluated on a held-out test set.
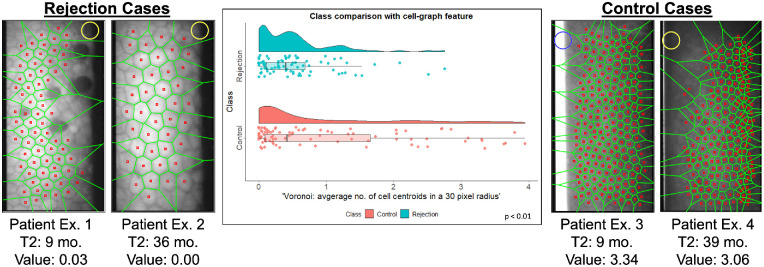
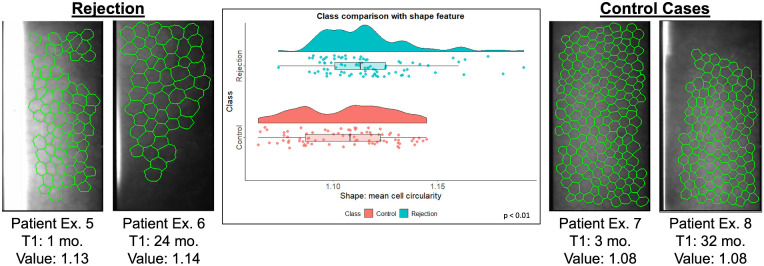
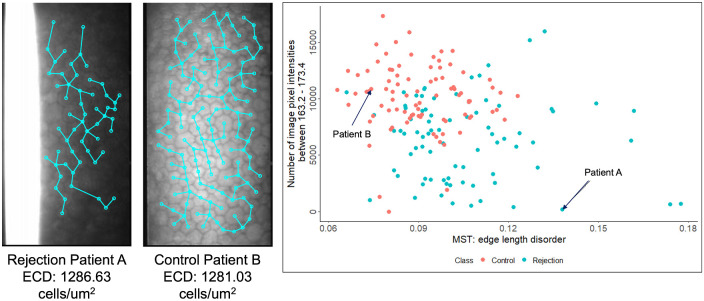
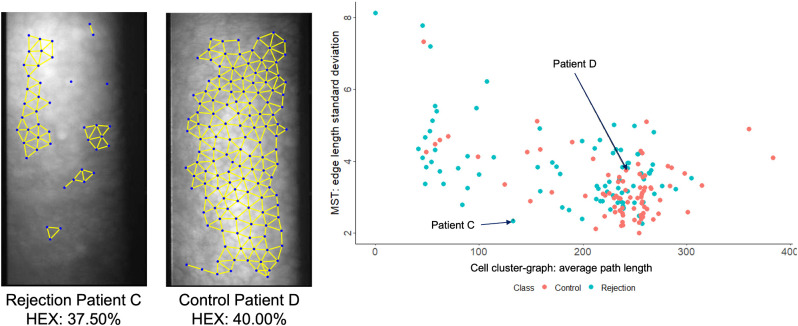
Results: ML classifiers trained on novel-to-this-application features outperformed those trained on traditional morphometrics for predicting future graft rejection. RF and LR models predicted post-DMEK patients' allograft rejection in the held-out test set with >0.80 accuracy. RF models trained on novel features from second-to-last time points and delta-radiomics predicted post-DMEK patients' rejection with >0.70 accuracy. Cell-graph spatial arrangement, intensity, and shape features were most indicative of graft rejection.
Conclusions: ML classifiers successfully predicted future graft rejections 1 to 24 months prior to clinically apparent rejection. This technology could aid clinicians to identify patients at risk for graft rejection and guide treatment plans accordingly.
Translational relevance: Our software applies ML techniques to clinical images and enhances patient care by detecting preclinical keratoplasty rejection.
Conflict of interest statement
Disclosure:
Figures
Similar articles
-
Descemet Membrane Endothelial Keratoplasty for Graft Failure After Descemet Stripping Endothelial Keratoplasty: Clinical Results and Histopathologic Findings.JAMA Ophthalmol. 2015 Jul;133(7):813-9. doi: 10.1001/jamaophthalmol.2015.0906. JAMA Ophthalmol. 2015. PMID: 25928903
-
Combined specular microscopy and Scheimpflug imaging to improve detection of an upcoming allograft rejection after DMEK.Acta Ophthalmol. 2020 May;98(3):261-266. doi: 10.1111/aos.14234. Epub 2019 Sep 4. Acta Ophthalmol. 2020. PMID: 31486268
-
Endothelial cell changes as an indicator for upcoming allograft rejection following descemet membrane endothelial keratoplasty.Am J Ophthalmol. 2014 Sep;158(3):485-95. doi: 10.1016/j.ajo.2014.05.030. Epub 2014 May 28. Am J Ophthalmol. 2014. PMID: 24879945
-
Descemet stripping automated endothelial keratoplasty versus descemet membrane endothelial keratoplasty: a meta-analysis.Int Ophthalmol. 2018 Apr;38(2):897-905. doi: 10.1007/s10792-017-0533-3. Epub 2017 Apr 17. Int Ophthalmol. 2018. PMID: 28417337 Review.
-
Preventive treatment of allograft rejection after endothelial keratoplasty: A systematic review and meta-analysis.Acta Ophthalmol. 2022 Aug;100(5):e1061-e1073. doi: 10.1111/aos.15154. Epub 2022 Apr 11. Acta Ophthalmol. 2022. PMID: 35411680
Cited by
-
Radiomics in ophthalmology: a systematic review.Eur Radiol. 2025 Jan;35(1):542-557. doi: 10.1007/s00330-024-10911-4. Epub 2024 Jul 21. Eur Radiol. 2025. PMID: 39033472
-
Automatic Determination of Endothelial Cell Density From Donor Cornea Endothelial Cell Images.Transl Vis Sci Technol. 2024 Aug 1;13(8):40. doi: 10.1167/tvst.13.8.40. Transl Vis Sci Technol. 2024. PMID: 39177992 Free PMC article.
-
Current Applications of Artificial Intelligence for Fuchs Endothelial Corneal Dystrophy: A Systematic Review.Transl Vis Sci Technol. 2025 Jun 2;14(6):12. doi: 10.1167/tvst.14.6.12. Transl Vis Sci Technol. 2025. PMID: 40478592 Free PMC article.
References
-
- Maurice D. A scanning slit optical microscope. Invest Ophthalmol Vis Sci. 1974; 13(12): 1033–1037. - PubMed
-
- Bourne WM. Cellular changes in transplanted human corneas. Cornea. 2001; 20(6): 560–569. - PubMed
-
- Patel SV, Hodge DO, Bourne WM.. Corneal endothelium and postoperative outcomes 15 years after penetrating keratoplasty. Am J Ophthalmol. 2005; 139(2): 311–319. - PubMed
-
- Zacks C, Abbott R, Fine M.. Long-term changes in corneal endothelium after keratoplasty: a follow-up study. Cornea. 1990; 9(2): 92–97. - PubMed
-
- Ing JJ, Ing HH, Nelson LR, Hodge DO, Bourne WM.. Ten-year postoperative results of penetrating keratoplasty. Ophthalmology. 1998; 105(10): 1855–1865. - PubMed
Publication types
MeSH terms
Grants and funding
LinkOut - more resources
Full Text Sources
Medical
