. 2023 Apr 1;34(4):ar31.
doi: 10.1091/mbc.E22-11-0498. Epub 2023 Feb 15.

BioID2 screening identifies KIAA1671 as an EPS8 proximal factor that marks sites of microvillus growth

Affiliations

BioID2 screening identifies KIAA1671 as an EPS8 proximal factor that marks sites of microvillus growth

Isabella M Gaeta et al. Mol Biol Cell. .

Abstract

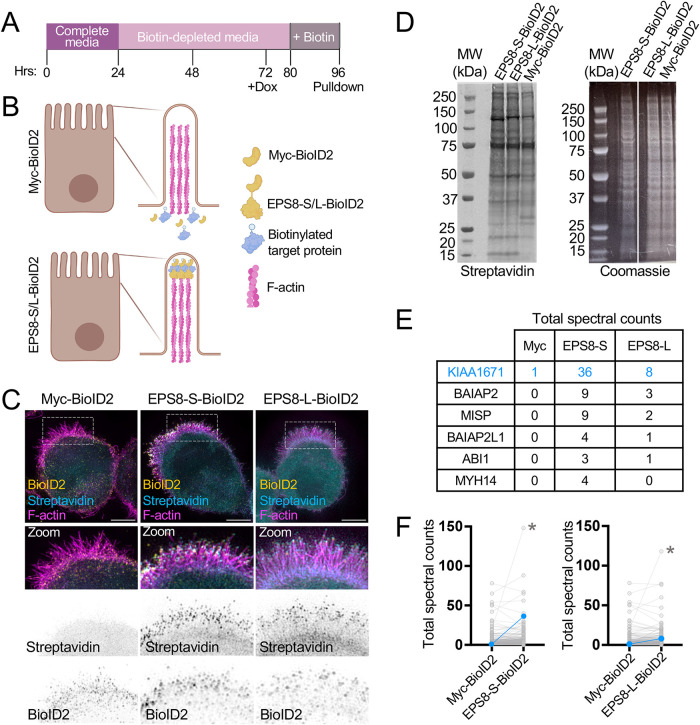
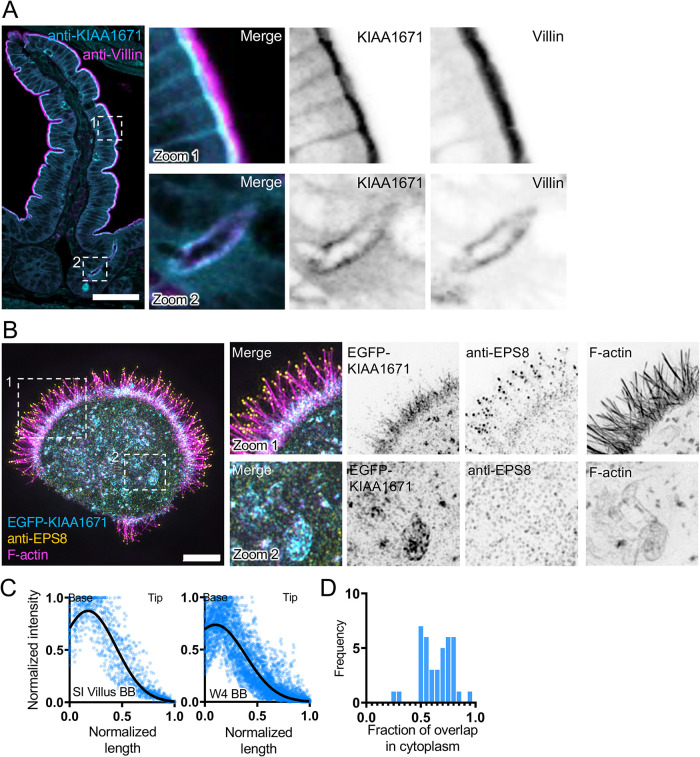
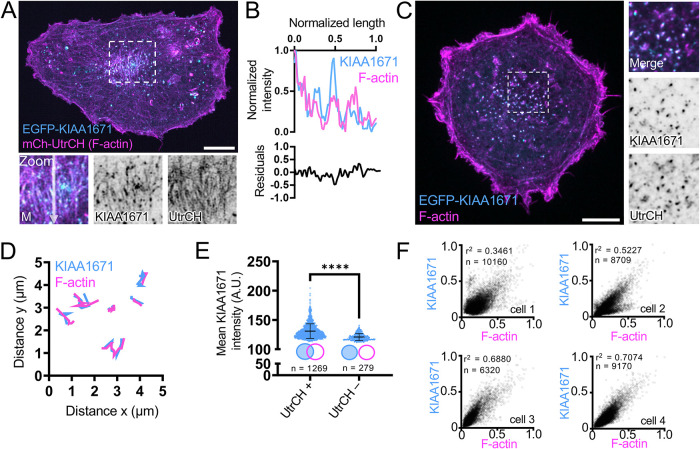
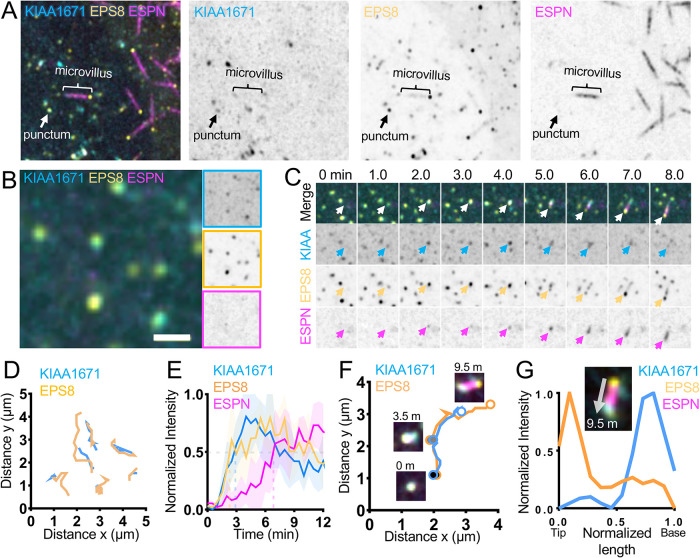
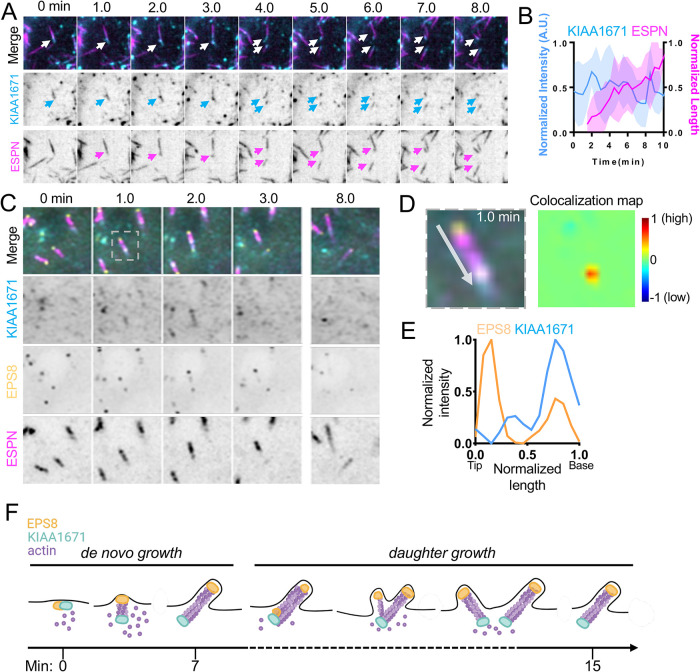
Microvilli are defining morphological features of the apical surfaces in diverse epithelial tissues. To develop our understanding of microvillus biogenesis, we used a biotin proximity-labeling approach to uncover new molecules enriched near EPS8, a well-studied marker of the microvillus distal tip compartment. Mass spectrometry of biotinylated hits identified KIAA1671, a large (∼200 kDa), disordered, and previously uncharacterized protein. Based on immunofluorescent staining and expression of fluorescent protein-tagged constructs, we found that KIAA1671 localizes to the base of the brush border in native intestinal tissue and polarized epithelial-cell culture models, as well as dynamic actin-rich structures in unpolarized, nonepithelial cell types. Live imaging also revealed that during the early stages of microvillar growth, KIAA1671 colocalizes with EPS8 in diffraction-limited puncta. However, once elongation of the core bundle begins, these two factors separate, with EPS8 tracking the distal end and KIAA1671 remaining behind at the base of the structure. These results suggest that KIAA1671 cooperates with EPS8 and potentially other assembly factors to initiate growth of microvilli on the apical surface. These findings offer new details on how transporting epithelial cells builds the brush border and may inform our understanding of how apical specializations are assembled in other epithelial contexts.


Figures

FIGURE 1:
FIGURE 1:
Utilizing biotin proximity labeling to probe for molecules involved in microvilli biogenesis. (A) Schematic timeline of W4 induction and biotin supplementation before streptavidin pull down. (B) Schematic representation of a W4 cell expressing the myc-BioID2 construct and EPS8-S/L-BioID2 constructs. Upon addition of 50 µM biotin to cell culture medium overnight, the BioID2 construct will promiscuously biotinylate proteins within an ∼10–25 nm radius. (C) Representative cells expressing either the myc-BioID2 control, EPS8-BioID2-HA, or EPS8-13xL-BioID2-HA constructs (yellow) and stained with streptavin-488 (cyan) and phalloidin (magenta) to determine the extent of biotinylation in the brush border of W4 cells. (D) Biotinylated proteins from EPS8-S-BioID2-HA, EPS8-L-BioID2-HA, or myc-BioID2 samples separated by SDS page and detected with a fluorescent streptavidin conjugate (left). Coomassie staining of previously stated samples to confirm equal total protein input for pulldown (right). (E) Highlighted raw total spectra counts of known EPS8 interacting proteins or brush border resident proteins detected in myc-BioID2, EPS8-S-BioID2, and EPS8-L-BioID2 samples. (F) Plots comparing total spectral counts between proteins detected in myc-BioID2 vs. EPS8-s-BioID2 or EPS8-L-BioID2 samples. Connected blue data points indicate KIAA1671 spectral counts, and asterisks indicate spectral counts of EPS8-S/L-BioID2 protein in samples.
FIGURE 2:
FIGURE 2:
KIAA1671 is an uncharacterized protein that targets the brush border cytoskeleton. (A) A paraffin-embedded mouse small-intestinal tissue section stained with anti-KIAA1671 (cyan) and anti-Villin (magenta) antibodies. Zoom 1 highlights apical staining on the villus, while Zoom 2 highlights apical staining in intestinal crypts. Scale bar = 50 µm. (B) Representative W4 cell expressing an EGFP-KIAA1671 construct (cyan), stained with an anti-EPS8 antibody (yellow) and phalloidin to mark F-actin (magenta). Zoom 1 highlights KIAA1671 at the base of the brush border, while Zoom 2 highlights KIAA1671 localization in the cytoplasm. (C) Linescans measuring anti-KIAA1671 (Left) or EGFP-KIAA1671 (Right) at the apical surfaces of intestinal tissue and W4 cells, respectively. n = 63 linescans of villus intestinal tissue from one independent staining; n = 40 line cans of W4 brush borders from three independent experiments. (D) Quantification of the fraction of overlap between KIAA1671 and F-actin. Bars indicate the fraction of total KIAA1671 signal that overlaps with F-actin signal. n = 40 cells from three independent experiments. All images are displayed as maximum-intensity projections.
FIGURE 3:
FIGURE 3:
KIAA1671 overlaps with dynamic actin-rich structures in unpolarized cells. (A) A representative B16F1 cell expressing EGFP-KIAA1671 and mCherry-UtrCH to mark F-actin. Zooms highlight linear actin features. Scale bar = 10 µm. (B) Linescan of linear features as highlighted in A, zoom. (C) B16F1 cell displaying cytoplasmic puncta of EGFP-KIAA1671 and mCherry-UtrCH. Scale bar = 10 µm. (D) Representative trajectory analysis of 6 EGFP-KIAA1671 and mCherry-UtrCH puncta as represented in C. Traces measured at 5-s intervals sampled over a 45-s time period from a single imaging field. (E) 2D puncta analysis comparing mean EGFP-KIAA1671 intensities of puncta either associated (UtrCH +) or not associated (UtrCH-) with UtrCH puncta. Plots are representative from a single cell over a 15-min imaging window. **** p < 0.0001 using a two-tailed Mann–Whitney test, n = 1269 UtrCH + puncta; n = 279 UtrCH – puncta. Plots show mean ± SD. (F) Two-dimensional intensity correlations of EGFP-KIAA1671 puncta with mCherry-UtrCH from six cells over two independent experiments. p values were calculated from a two-tailed test. All images are displayed as maximum intensity projections.
FIGURE 4:
FIGURE 4:
KIAA1671 and EPS8 puncta associate and then separate during microvillus growth. (A) CL4 cell displaying microvilli as well as cytoplasmic KIAA1671 and EPS8 puncta in cells expressing Halo-KIAA1671, EGFP-EPS8, and mCherry-ESPN. Box width = 15 µm. (B) Representative image of EGFP-EPS8 and Halo-KIAA1671 puncta in CL4 cells. Single-channel images are denoted by border outline in corresponding color (right). (C) Montage of a de novo microvillus growth event in a CL4 cell expressing EGFP-KIAA1671 (KIAA, cyan), EGFP-EPS8 (yellow), and mCherry-ESPN (magenta). Box width = 4 µm. (D) Trajectory analysis of Halo-KIAA1671 and EGFP-EPS8 puncta as represented in B. Traces are measured at 30-s intervals sampled from a 30-min time period from a single imaging field. (E) Averaged normalized intensity vs. time curves representing 5 de novo microvillus growth events from the imaging experiment shown in C. Solid line represents mean and shaded area represents SD. (F) Trajectory analysis of Halo-KIAA1671 (cyan) and EGFP-EPS8 (yellow) during a de novo microvillus growth event. Large, shaded circles represent indicated time points during the trajectory. (G) Image of the 9.5-min time point indicated in F (Top) with linescan demonstrating separation of the Halo-KIAA1671 and EGFP-EPS8 signals to opposite ends of the microvillus. All images are displayed as maximum-intensity projections.
FIGURE 5:
FIGURE 5:
KIAA1671 and EPS8 puncta overlap during daughter microvillus growth. (A) Representative montage of daughter microvillus growth event. Box width = 9 µm. (B) Quantification of EGFP-KIAA1671 intensity and microvillus length vs. time of daughter growth events. n = 12 daughter growth events from seven cells over two independent experiments. (C) Montage of a daughter microvillus growth event in CL4 cells expressing Halo-KIAA1671, EGFP-EPS8, and mCherry-ESPN. Box width = 5 µm. (D) Zoom of the 1-min timepoint in C (Left), with colocalization heat map analysis (Right). Warmer colors on heat map represent a higher degree of colocalization, while cooler colors represent a low degree of colocalization. (E) Linescan of zoom shown in D. (F) Schematic of both de novo and daughter microvillus growth illustrating KIAA1671 and EPS8 together at early stages of de novo growth, followed by separation as the microvillus matures. During daughter growth KIAA1671 and EPS8 mark spots of new bundle formation on the mother bundle. As the new daughter bundle grows, EPS8 remains at the distal tip while KIAA1671 stays at the base of the microvillus.

References

    1. Avenarius MR, Krey JF, Dumont RA, Morgan CP, Benson CB, Vijayakumar S, Cunningham CL, Scheffer DI, Corey DP, Muller U, et al. (2017). Heterodimeric capping protein is required for stereocilia length and width regulation. J Cell Biol 216, 3861–3881. - PMC - PubMed
    1. Baas AF, Kuipers J, van der Wel NN, Batlle E, Koerten HK, Peters PJ, Clevers HC (2004). Complete polarization of single intestinal epithelial cells upon activation of LKB1 by STRAD. Cell 116, 457–466. - PubMed
    1. Bartles JR, Zheng L, Li A, Wierda A, Chen B (1998). Small espin: a third actin-bundling protein and potential forked protein ortholog in brush border microvilli. J Cell Biol 143, 107–119. - PMC - PubMed
    1. Berryman M, Franck Z, Bretscher A (1993). Ezrin is concentrated in the apical microvilli of a wide variety of epithelial cells whereas moesin is found primarily in endothelial cells. J Cell Sci 105, 1025–1043. - PubMed
    1. Breitsprecher D, Jaiswal R, Bombardier JP, Gould CJ, Gelles J, Goode BL (2012). Rocket launcher mechanism of collaborative actin assembly defined by single-molecule imaging. Science 336, 1164–1168. - PMC - PubMed

Publication types

MeSH terms

LinkOut - more resources