. 2023 Feb 15;48(4):892-895.
doi: 10.1364/OL.482597.

Single-modulator, direct frequency comb spectroscopy via serrodyne modulation

Single-modulator, direct frequency comb spectroscopy via serrodyne modulation

D A Long et al. Opt Lett. .

Abstract

Traditional electro-optic frequency comb spectrometers rely upon the use of an acousto-optic modulator (AOM) to provide a differential frequency shift between probe and local oscillator (LO) legs of the interferometer. Here we show that these modulators can be replaced by an electro-optic phase modulator (EOM) which is driven by a sawtooth waveform to induce serrodyne modulation. This approach enables direct frequency comb spectroscopy to be performed with a single dual-drive Mach-Zehnder modulator (DD-MZM), allowing for lower differential phase noise. Further, this method allows for simpler production of integrated photonic comb spectrometers on the chip scale.


Figures
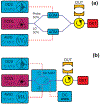
Figure 1.
Figure 1.
(a) Schematic of a typical self-heterodyne spectrometer. (b) Schematic of the single-modulator, direct frequency comb spectrometer presented herein. Abbreviations are direct digital synthesizer (DDS), external-cavity diode laser (ECDL), arbitrary waveform generator (AWG), electro-optic phase modulator (EOM), acousto-optic modulator (AOM), device under test (DUT), photodiode detector (DET), dual-drive Mach Zehnder modulator (DD-MZM).
Fig. 2.
Fig. 2.
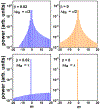
Computed power spectra for sawtooth modulation of the laser phase corresponding to amplitudes of π/2 (upper panels), π (lower panels) and indicated sawtooth symmetry factors, β. Here the x-axes represent normalized detuning about f0 expressed as integer orders, m=(ff0)/fr.
Fig. 3.
Fig. 3.
Typical self-heterodyne comb power spectrum shown as an average of 500 individual power spectra with a total acquisition time of 0.5 s. As can be seen in the inset, the large positive- and negative-order comb teeth are separated by 120 kHz (i.e., twice the serrodyne frequency). The serrodyne harmonics are also visible as the lower magnitude comb teeth with a spacing of 60 kHz.
Fig. 4.
Fig. 4.
Typical spectrum of a given optical cavity mode of the optomechanical accelerometer as well as the corresponding Fano lineshape [15] fit. This spectrum was acquired in 16.7 μs with no averaging performed. Elevated noise is seen near zero detuning as this corresponds to DC in the self-heterodyne spectrum.
Fig. 5.
Fig. 5.
Observed cavity mode detuning recorded with the DD-MZM spectrometer when the electromechanical shaker table was driven with an amplitude-modulated 200 Hz sine wave.

References

    1. Parriaux A, Hammani K, and Millot G, Adv. Opt. Photonics 12, 223–287 (2020).
    1. Wong KK, De La Rue RM, and Wright S, Opt. Lett 7, 546–548 (1982). - PubMed
    1. Johnson LM and Cox CH, J. Lightwave Technol 6, 109–112 (1988).
    1. Laskoskie C, Hung H, El-Wailly T, and Chang CL, J. Lightwave Technol 7, 600–606 (1989).
    1. Poberezhskiy IY, Bortnik B, Chou J, Jalali B, and Fetterman HR, IEEE J. Quantum Electron 41, 1533–1539 (2005).