. 2023 Feb 15;19(2):e1010869.
doi: 10.1371/journal.pcbi.1010869. eCollection 2023 Feb.

Functional duality in group criticality via ambiguous interactions

Affiliations

Functional duality in group criticality via ambiguous interactions

Takayuki Niizato et al. PLoS Comput Biol. .

Abstract

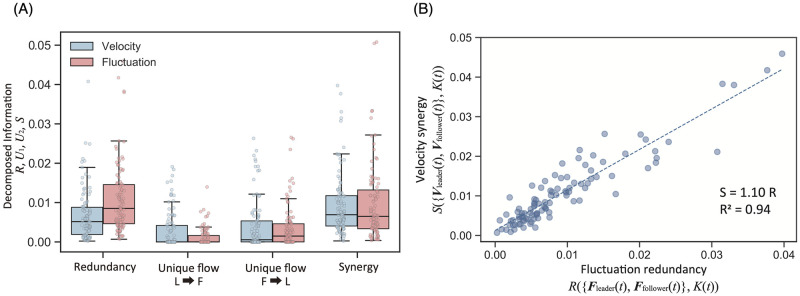
Critical phenomena are wildly observed in living systems. If the system is at criticality, it can quickly transfer information and achieve optimal response to external stimuli. Especially, animal collective behavior has numerous critical properties, which are related to other research regions, such as the brain system. Although the critical phenomena influencing collective behavior have been extensively studied, two important aspects require clarification. First, these critical phenomena never occur on a single scale but are instead nested from the micro- to macro-levels (e.g., from a Lévy walk to scale-free correlation). Second, the functional role of group criticality is unclear. To elucidate these aspects, the ambiguous interaction model is constructed in this study; this model has a common framework and is a natural extension of previous representative models (such as the Boids and Vicsek models). We demonstrate that our model can explain the nested criticality of collective behavior across several scales (considering scale-free correlation, super diffusion, Lévy walks, and 1/f fluctuation for relative velocities). Our model can also explain the relationship between scale-free correlation and group turns. To examine this relation, we propose a new method, applying partial information decomposition (PID) to two scale-free induced subgroups. Using PID, we construct information flows between two scale-free induced subgroups and find that coupling of the group morphology (i.e., the velocity distributions) and its fluctuation power (i.e., the fluctuation distributions) likely enable rapid group turning. Thus, the flock morphology may help its internal fluctuation convert to dynamic behavior. Our result sheds new light on the role of group morphology, which is relatively unheeded, retaining the importance of fluctuation dynamics in group criticality.


Figures

Fig 1
Fig 1. Brief sketch of the quasi-attraction/alignment algorithm.
(A) Reinterpretations of attraction (t = 0) and alignment (t = ∞). The red and black arrows indicate the focal agent and its neighbor, respectively, while the green arrow indicates the next direction. (B) A sketch of the cover function, which returns the minimum cap C on the interaction sphere SP, which covers all points pi (for the mathematical definition, see the Section 2 in S1 Appendix). (C) Left: The quasi-attraction projected on the plane. Each direction is extended to SP, where Catr (yellow) is the minimal sphere cap covering all points tj. Right: The quasi-alignment projected on the plane, where Calg (blue) is the minimal sphere cap covering all points sj. Lower: C (green) is the maximal sphere cap inside CatrCalg. The focal agent selects its next direction randomly based on C. (D) A brief sketch of the avoidance algorithm. Upper: Each direction is extended to the repulsion area SPavd = {r||r| = R}, where Cavd is the minimal sphere cap that covers all points on SPavd. (Lower) The focal agent determines its next direction uniquely as the shortest-distance position to the outside of Cavd.
Fig 2
Fig 2. Overview of algorithm.
One parameter (the maximum velocity vmax) exists when the repulsion radius R is fixed. Each agent checks if there are any other individuals in the repulsion zone, and if not, it executes the quasi-attraction/alignment rule. The update timings are synchronous. The algorithm framework is of the same type as those of previous Boids models and other methods.
Fig 3
Fig 3. Group formation.
(A) Sample time series for group polarity P=|iNvi|/N and flock size Vα13. (B) The negative correlation between Vα13 and its skewness 1 − Vα/Vconv, where Vconv is the full convex volume (Pearson’s correlation test: n = 8000, r = −0.36, p < 10−30). Note that the inequality relation Vα < Vconv holds. (C) Examples of three types of group formation: alignment, twist, and burst.
Fig 4
Fig 4. Lévy walk on the center-of-mass reference frame.
(A) Sample center-of-mass trajectory for 10000 steps. (B) Enlarged version of the blue-circle area (200 steps). The dots indicate individual steps. (C) Sample step-length l distribution for the mass-centered trajectories of 1000 agents. All l distributions obey the truncated power law distribution P(l) ∼ lμ. The average Lévy slope μ is 2.15. (D) The average μ with respect to group size for various velocity vmax parameters.
Fig 5
Fig 5. Jittering behavior on center-of-mass reference frame.
(A) Sample velocity variation time series (i.e., ||xi(t) − xi(t − 1)||). (B) Power spectrum of (A): the slope of fγ is 0.98 (solid line). (C) Average slope 〈γ〉 according to group size for different velocity V parameters, with 〈γ〉 converging to 1.0. The jittering behavior of each agent is highly self-organized in time.
Fig 6
Fig 6. Super diffusion.
(A) Mean square displacement in the center-of-mass reference frame. The diffusion coefficient D = 24.0, the diffusion exponent α = 1.79, the group size N = 1000, and the velocity parameter vmax = 8 (m/s). (B) The α results obtained for different vmax and N; hence, α depends on N but not on vmax.
Fig 7
Fig 7. Relation between correlation length and flock size.
The flock size is defined as the maximum distance between two agents. Instead of trajectory smoothing to cancel the agent noise, we examined the velocity vector v = xt+δtxt when δt was 2, 5, and 10 steps. (A) The correlation between the correlation length ξ and flock size L, where ξ is proportional to L: ξ = aL with a = 0.40 and δt = 2 (Pearson’s correlation test: n = 100, r = 0.93, p < 10−31), a = 0.40 and δt = 5 (Pearson’s correlation test: n = 100, r = 0.93, p < 10−31), and a = 0.40 and δt = 10 (Pearson’s correlation test: n = 100, r = 0.93, p < 10−31). (B) The correlation between the correlation length ξsp and L, where ξsp is proportional to L: ξsp = aL with a = 0.26 and δt = 2 (Pearson’s correlation test: n = 100, r = 0.92, p < 10−31), a = 0.30 and δt = 5 (Pearson’s correlation test: n = 100, r = 0.92, p < 10−31), and a = 0.31 and δt = 10 (Pearson’s correlation test: n = 100, r = 0.92, p < 10−31). For the other parameter settings, see S1 Table.
Fig 8
Fig 8. Algorithm of the scale-free induced subgroup.
The input information is {ri}iN and {u^i}iN (i.e., the fluctuation positions and directional information). The output index is the assignment group number.
Fig 9
Fig 9. Curvature vectors and mutual information obtained for different inputs.
(A) The flock center-of-mass trajectory and its curvature vectors at each point. (B) The probability density P(K) for all series of data where δt = 5 steps. We defined the region with curvature K < 0.05 as the ballistic region, and the region for which K > 0.10 as the group turning region. (C) Mutual information IVI({Vleader(t), Vfollower(t)}; K(t)) and IFI({Fleader(t), Ffollower(t)}; K(t)) for each region. The mutual information (i.e., IV, IF) in the group turning region is significantly larger than in the ballistic region. The detailed statistical test results are listed in S1 Table.
Fig 10
Fig 10. PID for group turning phase.
(A) The PID decomposition for IV (blue) and IF (red) of the turning result in Fig 9C. The velocity synergy is higher than that of the redundancy (paired t-test: t(99) = 2.75, p < 0.01); however, the fluctuation synergy does not exceed the fluctuation redundancy (paired t-test: t(99) = −0.934, p > 0.1). The other statistical test results are listed in S1 Table. (B) The relation between the velocity synergy S({Vlead(t), Vfollow(t)}; K(t)) and fluctuation redundancy R({Flead(t), Ffollow(t)}; K(t)). The correlation efficient is 0.93 (Pearson’s correlation test: n = 100, p < 10−31). The other parameter settings are reported in S1 Table.

References

    1. Buhl J, Sumpter DJT, Couzin ID, Hale JJ, Despland E, Miller ER, Simpson SJ. From Disorder to Order in Marching Locusts. Science. 2006; 312(5778):1402–1406. doi: 10.1126/science.1125142 - DOI - PubMed
    1. Ballerini M, Cabibbo N, Candelier R, Cavagna A, Cisbani E, Giardina I, et al.. Interaction ruling animal collective behavior depends on topological rather than metric distance: Evidence from a field study. Proceedings of the National Academy of Sciences. 2008;105(4):1232–1237. doi: 10.1073/pnas.0711437105 - DOI - PMC - PubMed
    1. Couzin ID. Collective cognition in animal groups. Trends in Cognitive Sciences. 2009;13(1):36–43. doi: 10.1016/j.tics.2008.10.002 - DOI - PubMed
    1. Sumpter D. Collective animal behavior. Princeton University Press; 2010.
    1. Bak P, Tang C, Wiesenfeld K. Self-organized criticality. Phys Rev A. 1988;38:364–374. doi: 10.1103/PhysRevA.38.364 - DOI - PubMed

Publication types