. 2023 Feb 21;120(8):e2217561120.
doi: 10.1073/pnas.2217561120. Epub 2023 Feb 15.

Cholesterol-rich domain formation mediated by ZO proteins is essential for tight junction formation

Affiliations

Cholesterol-rich domain formation mediated by ZO proteins is essential for tight junction formation

Kenta Shigetomi et al. Proc Natl Acad Sci U S A. .

Abstract

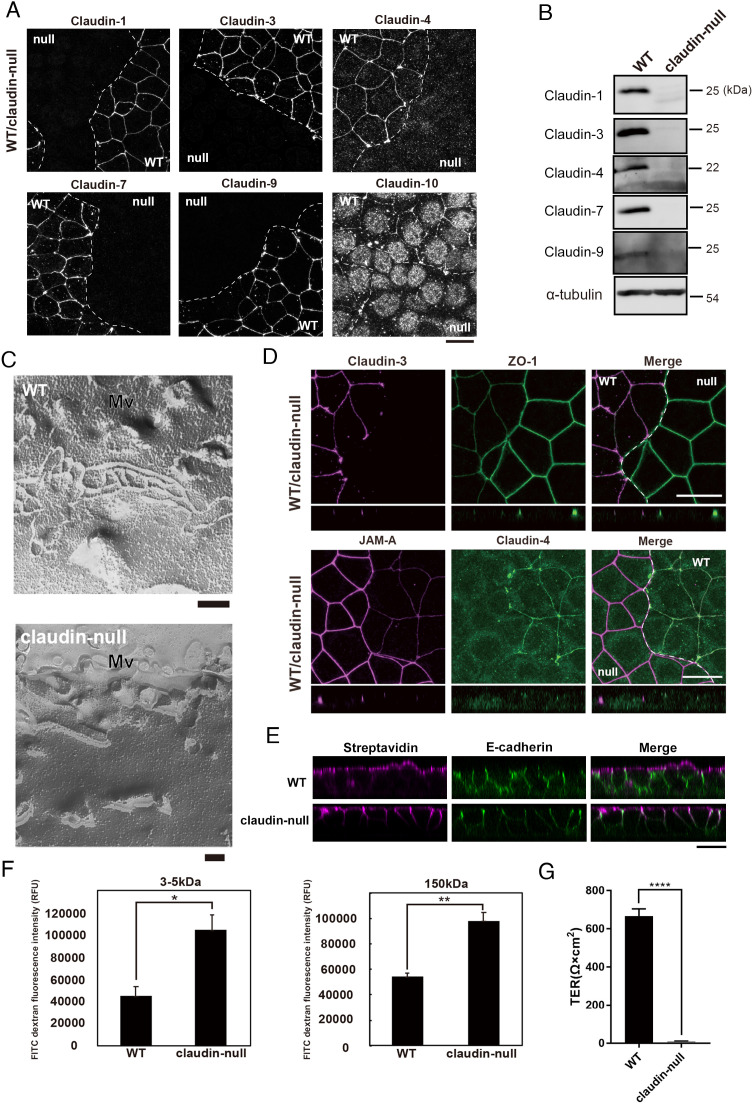
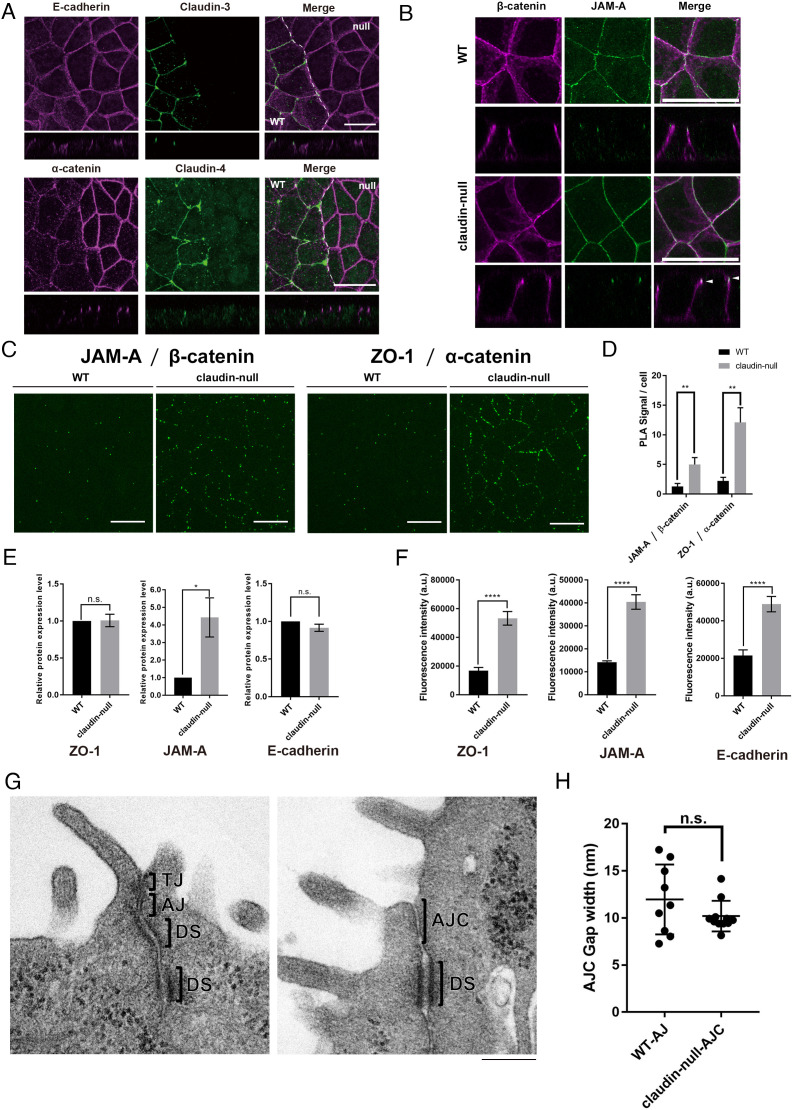
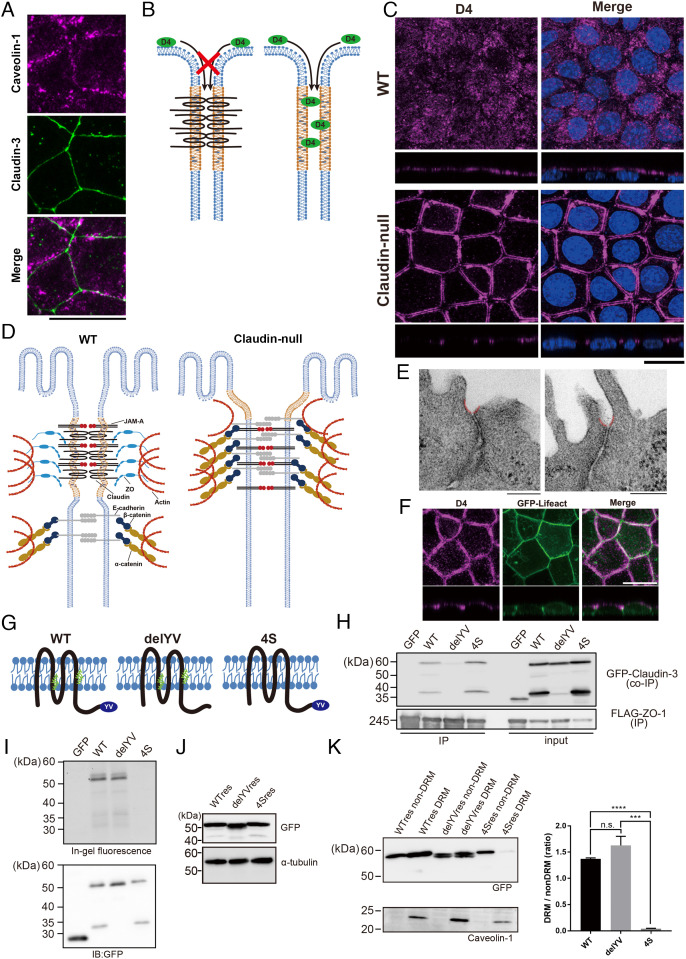
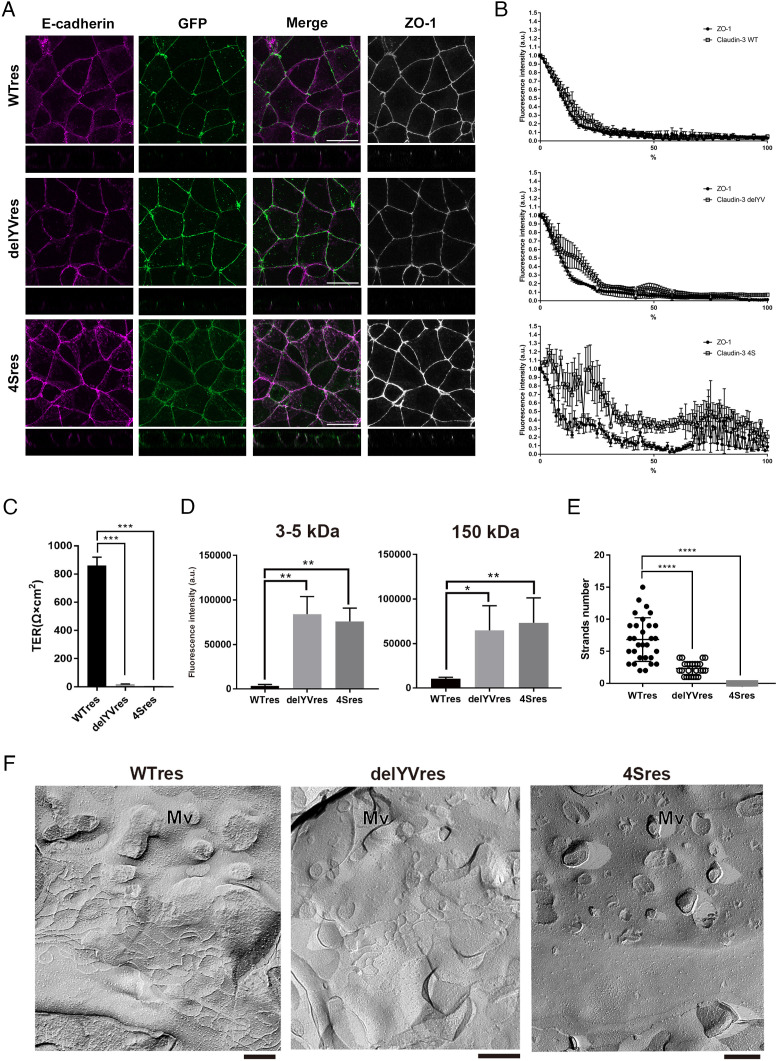
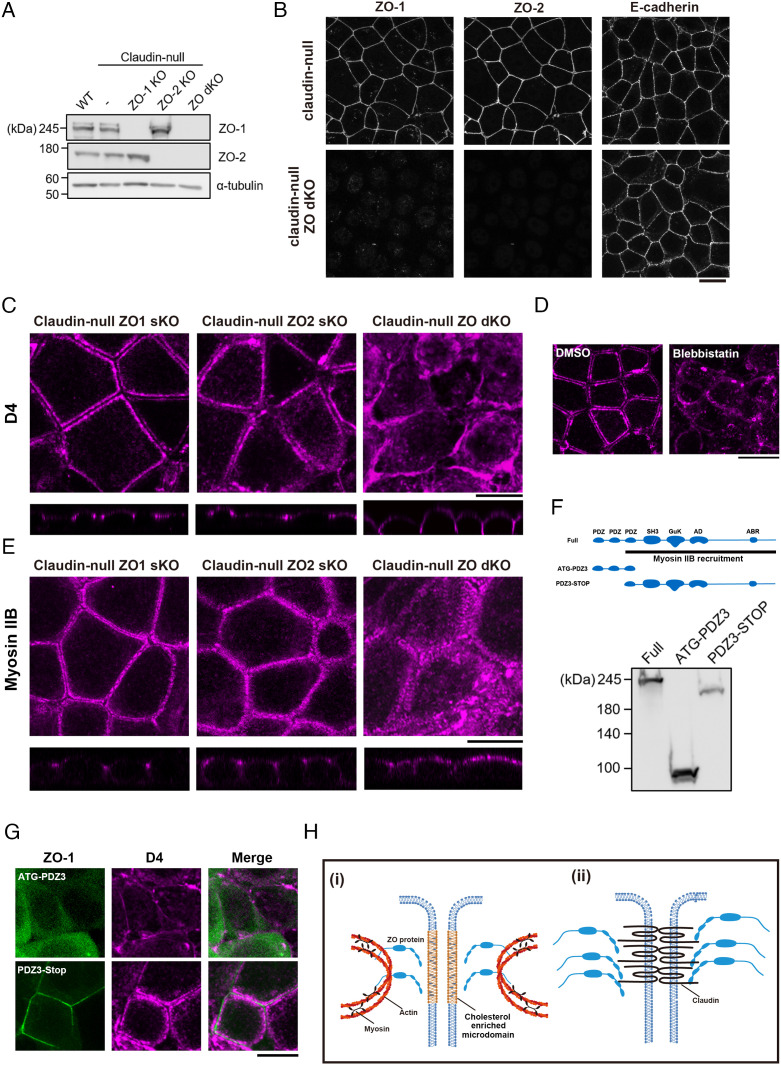
Tight junctions (TJs) are cell-adhesion structures responsible for the epithelial barrier. We reported that accumulation of cholesterol at the apical junctions is required for TJ formation [K. Shigetomi, Y. Ono, T. Inai, J. Ikenouchi, J. Cell Biol. 217, 2373-2381 (2018)]. However, it is unclear how cholesterol accumulates and informs TJ formation-and whether cholesterol enrichment precedes or follows the assembly of claudins in the first place. Here, we established an epithelial cell line (claudin-null cells) that lacks TJs by knocking out claudins. Despite the lack of TJs, cholesterol normally accumulated in the vicinity of the apical junctions. Assembly of claudins at TJs is thought to require binding to zonula occludens (ZO) proteins; however, a claudin mutant that cannot bind to ZO proteins still formed TJ strands. ZO proteins were however necessary for cholesterol accumulation at the apical junctions through their effect on the junctional actomyosin cytoskeleton. We propose that ZO proteins not only function as scaffolds for claudins but also promote TJ formation of cholesterol-rich membrane domains at apical junctions.

Keywords: cholesterol; claudin; epithelial cells; membrane domain; tight junction.


Conflict of interest statement

The authors declare no competing interest.

Figures

Fig. 1.
Fig. 1.
Establishment of claudin-null cells. (A) Representative immunofluorescence images of a coculture of EpH4 WT and claudin-null cells stained for claudin-1, claudin-3, claudin-4, claudin-7, claudin-9, and claudin-10b. (Scale bar, 20 µm.) (B) Immunoblotting of whole-cell lysates of EpH4 WT and claudin-null cells. Claudin-1, claudin-3, claudin-4, claudin-7, and claudin-9 were not detected in claudin-null cells. Endogenous claudin-10b could not be detected by several commercially available antibodies due to its low expression level. (C) Freeze-fracture EM images of TJ strands in EpH4 WT and claudin-null cells. TJ strands were never observed in claudin-null cells. Mv: microvilli. (Scale bar, 200 nm.) (D) Representative immunofluorescence images of a coculture of EpH4 WT and claudin-null cells stained for claudin-3 and ZO-1 (Upper) and JAM-A and claudin-4 (Lower). (Scale bar, 20 µm.) (E) Sulfo-NHS-biotin was added to the apical compartment to visualize the paracellular tracer flux. The distribution of biotin was detected by staining with streptavidin. Lateral membranes are marked by E-cadherin. Note that in claudin-null cells, biotin freely passes through the paracellular space in the absence of the TJ barrier. (Scale bar, 20 µm.) (F) The paracellular permeability to macromolecules in EpH4 WT and claudin-null cells was examined by measuring the flux of membrane-impermeable tracers of various sizes (FITC-dextran, 3 to 5 and 150 kD). Apical-to-basal permeability of 3 to 5 kD and 150 kD FITC-dextran was significantly increased in claudin-null cells (n = 3, Student’s t test, *P < 0.05, **P < 0.01). (G) Transepithelial resistance (TER) was significantly decreased in claudin-null cells indicating loss of epithelial barrier in claudin-null cells (n = 3, Student’s t test, ****P < 0.0001).
Fig. 2.
Fig. 2.
AJs containing JAM-A are formed in claudin-null cells. (A) Representative immunofluorescence images of a coculture of EpH4 WT and claudin-null cells stained for E-cadherin and claudin-3 or α-catenin and claudin-4. (Scale bar, 20 μm.) (B) Representative immunofluorescence images of EpH4 WT and claudin-null cells stained for JAM-A and β-catenin. Arrowhead indicates colocalization of β-catenin and JAM-A. (Scale bar, 20 μm.) (C) Representative fluorescence images of PLA signals between either JAM-A and β-catenin or ZO-1 and α-catenin in EpH4 WT and claudin-null cells. (Scale bar, 20 μm.) (D) Graph showing the average number of PLA signals detected per cell. Details of the experiment are described in Materials and Methods (n = 3, Student’s t test, **P < 0.01). (E) Graph showing the protein levels of ZO-1, JAM-A, and E-cadherin in EpH4 WT and claudin-null cells based on the western blotting analyses (n = 3, Student’s t test, *P < 0.05). (F) Graph showing the signal intensities of ZO-1, JAM-A, and E-cadherin at bicellular junctions in EpH4 WT and claudin-null cells based on the immunofluorescence images (n = 3, Student’s t test, ****P < 0.0001). (G) Representative transmission EM images of ultrathin sections of EpH4 WT and claudin-null cells. TJs with membrane appositions were observed in EpH4 WT. On the other hand, TJs were absent, and the intercellular space was widened in claudin-null cells. (Scale bar, 200 nm.) (H) Quantification of the intracellular gaps at AJs in EpH4 WT and at AJCs in claudin-null cells between adjacent cells based on the transmission EM images of ultrathin sections of EpH4 WT and claudin-null cells (n = 9, Student’s t test).
Fig. 3.
Fig. 3.
Accumulation of cholesterol at AJCs is maintained without TJs in claudin-null cells. (A) Representative immunofluorescence images of EpH4 WT stained for caveolin-1 and claudin-3. (Scale bar, 20 μm.) (B) Schematic of the cholesterol localization analysis using the cholesterol-binding protein, RFP-D4. RFP-D4 cannot access the lateral membrane in WT cells because its bulk and hydrophilicity prohibit its passage across the TJ barrier. Under conditions where the barrier is absent, such as in claudin-null cells, RFP-D4 is able to access the lateral membrane, enabling direct verification of either the presence or the absence of cholesterol enrichment around AJCs. (C) Distribution of cholesterol at the outer leaflet of plasma membrane visualized by D4 staining in EpH4 WT and claudin-null cells. (Scale bar, 20 µm.) (D) In claudin-null cells, the intrinsic contractility of the actomyosin ring anchoring AJCs pulls apart the more apical membrane regions between adjoining cells since they are no longer tethered by TJs. The gap between parallel D4 staining in Fig. 2B reflects this disassociated state at the presumptive TJ region. (E) Representative transmission EM images of ultrathin sections of claudin-null cells. In claudin-null cells, the plasma membrane regions immediately apical to AJCs is caved inward (colored red). (Scale bars, 200 nm.) (F) Representative fluorescence images of GFP-Lifeact-expressing claudin-null cells stained with RFP-D4. (Scale bar, 20 μm.) (G) Molecular schematic of claudin mutants. The delYV mutant lacks the C-terminal PDZ-binding motif (YV) that is essential for binding to ZO proteins. In the 4S mutant, all four cysteine residues that undergo palmitoylation (green) were changed to serine. (H) Binding of GFP-fused claudin mutants to ZO-1 was assessed by immunoprecipitation of FLAG-tagged ZO-1. (I) Palmitoylation was detected using fluorescent palmitic acid. As expected, fluorescent palmitic acid is not incorporated by the 4S mutant. (J) Establishment of claudin-null cells stably expressing GFP-fused WT res, the delYV mutant (delYV res), or the 4S mutant (4S res). Whole-cell lysates were blotted with anti-GFP antibody and anti-alpha tubulin antibody. (K) Immunoblot analysis of the DRM and non-DRM fractions of claudin-null cells stably expressing WT claudin-3 (WT res), the delYV mutant (delYV res), or the 4S mutant (4S res). The DRM fraction is enriched with the DRM marker protein caveolin-1. The ratio of protein levels between DRM and non-DRM fractions were quantified (n = 3, Student’s t test, ***P < 0.001, ****P < 0.0001).
Fig. 4.
Fig. 4.
Claudin-3 delYV mutants induce TJ strand formation in claudin-null cells independently of ZO proteins. (A) Representative immunofluorescence images of WT res, delYV res, or 4S res cells stained for ZO-1 and E-cadherin. (Scale bar, 20 μm.) (B) Enrichment of claudin mutants shown in A relative to the AJC marker ZO-1 was analyzed by line scan analysis. The highest fluorescence of GFP-claudin-3 signal was set as the apical-most point of the lateral membrane, from which cell height was measured along the lateral membrane revealed by E-cadherin immunofluorescence. Total cell height was normalized to 100% to plot the percentage of the lateral membrane covered by the GFP signals. Error bars show SD calculated based on three independent experiments. (C) The TER values were significantly decreased in delYV res cells or 4S res cells as compared to WT res cells (n = 3, Student’s t test, ***P < 0.001). (D) Apical-to-basal permeability of 3 to 5 kD and 150 kD FITC-dextran was compromised in delYV res and 4S res cells as compared to WT res cells (n = 3, Student’s t test, *P < 0.05, **P < 0.01). (E) Number of TJ strands were quantified based on the freeze-fracture EM images (n = 25, Student’s t test, ****P < 0.001). (F) Representative freeze-fracture EM images of TJ strands in WT res, delYV res, and 4S res cells. Mv: microvilli. (Scale bar, 200 nm.)
Fig. 5.
Fig. 5.
ZO proteins enable the formation of cholesterol-rich membrane domains in the vicinity of AJCs via contractile actomyosin cable formation. (A and B) Establishment of claudin-null ZO-1 sKO, claudin-null ZO-2 sKO, and claudin-null dKO cells. Immunoblots of whole-cell lysates prepared from each cell lines are shown in A. Representative immunofluorescence images of claudin-null cells and claudin-null ZO dKO cells stained for ZO-1, ZO-2, and E-cadherin are shown in B. (Scale bar, 20 µm.) (C) Distribution of cholesterol at the outer leaflet of plasma membrane visualized by D4 staining in claudin-null ZO-1 sKO, claudin-null ZO-2 sKO, and claudin-null ZO dKO cells. Note that the accumulation of cholesterol at AJCs is lost and that cholesterol is redistributed uniformly across the lateral membranes in claudin-null ZO dKO cells. (Scale bar, 20 µm.) (D) Distribution of cholesterol at the outer leaflet of plasma membrane visualized by D4 staining in claudin-null cells treated with 100 µM blebbistatin. (Scale bar, 20 µm.) (E) Distribution of Myosin IIB in claudin-null ZO-1 sKO, claudin-null ZO-2 sKO, and claudin-null ZO dKO cells. (Scale bar, 20 µm.) (F) Schematics of the ZO-1 deletion mutants used in this study and immunoblots of whole-cell lysates prepared from HEK293 cells expressing each construct. (G) Distribution of cholesterol at the outer leaflet of plasma membrane visualized by D4 staining in claudin-null ZO dKO cells expressing GFP-tagged ATG-PDZ3 or GFP-tagged PDZ3-STOP. (Scale bar, 20 µm.) (H) Working model of how ZO proteins accumulate claudins at AJCs by two different molecular mechanisms. (i) Contractile actin ring directs accumulation of cholesterol in the vicinity of AJCs. ZO proteins possibly mediate the enrichment of cholesterol directly or indirectly. Palmitoylated claudins are recruited to the cholesterol-rich membrane domains, resulting in the polymerization of claudins into TJ strands. (ii) The polymerization of ZO proteins further increases the density of claudins at the plasma membrane and enables the development of the functional TJ network.

Similar articles

Cited by

References

    1. Tsukita S., Furuse M., Itoh M., Multifunctional strands in tight junctions. Nat. Rev. Mol. Cell Biol. 2, 285–293 (2001). - PubMed
    1. Umeda K., et al. , ZO-1 and ZO-2 independently determine where claudins are polymerized in tight-junction strand formation. Cell 126, 741–754 (2006). - PubMed
    1. Beutel O., Maraspini R., Pombo-García K., Martin-Lemaitre C., Honigmann A., Phase separation of zonula occludens proteins drives formation of tight junctions. Cell 179, 923–936.e911 (2019). - PubMed
    1. Shigetomi K., Ono Y., Inai T., Ikenouchi J., Adherens junctions influence tight junction formation via changes in membrane lipid composition. J. Cell Biol. 217, 2373–2381 (2018). - PMC - PubMed
    1. Nusrat A., et al. , Tight junctions are membrane microdomains. J. Cell Sci. 113, 1771–1781 (2000). - PubMed

Publication types

MeSH terms

LinkOut - more resources