

Thyroid cancer risk prediction model using m6A RNA methylation regulators: integrated bioinformatics analysis and histological validation
- PMID: 36791151
- PMCID: PMC9970309
- DOI: 10.18632/aging.204525
Thyroid cancer risk prediction model using m6A RNA methylation regulators: integrated bioinformatics analysis and histological validation
Abstract
Background: Epigenetic reprogramming has been reported to play a critical role in the progression of thyroid cancer. RNA methylation accounts for more than 60% of all RNA modifications, and N6-methyladenosine (m6A) is the most common modification of RNAs in higher organisms. The purpose of this study was to explore the related modification mode of m6A regulators construction and its evaluation on the clinical prognosis and therapeutic effect of thyroid cancer.
Methods: The levels of 23 m6A regulators in The Cancer Genome Atlas (TCGA) were analyzed. Differentially expressed genes (DEGs) and survival analysis were performed based on TCGA-THCA clinicopathological and follow-up information, and the mRNA levels of representative genes were verified using clinical thyroid cancer data. In order to detect the effects of m6A regulators and their DEGs, consensus cluster analysis was carried out, and the expression of different m6A scores in Tumor Mutation Burden (TMB) and immune double antibodies (PD-1 antibody and CTLA4 antibody) were evaluated to predict the correlation between m6A score and thyroid cancer tumor immunotherapy response.
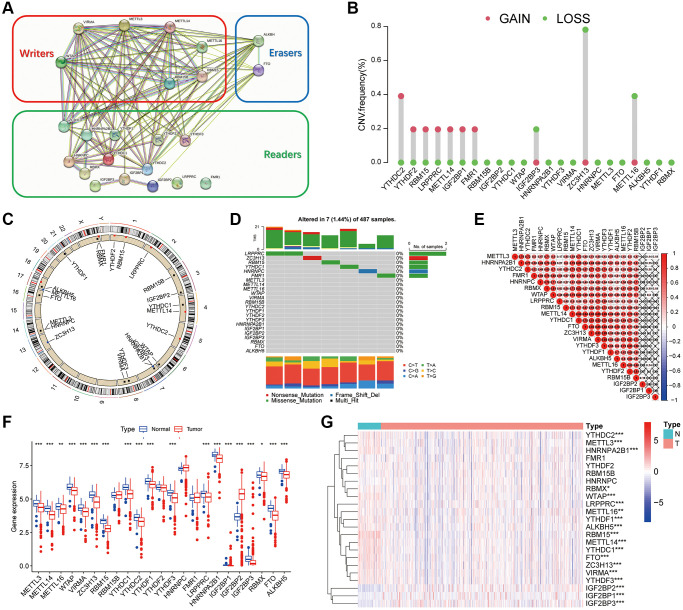
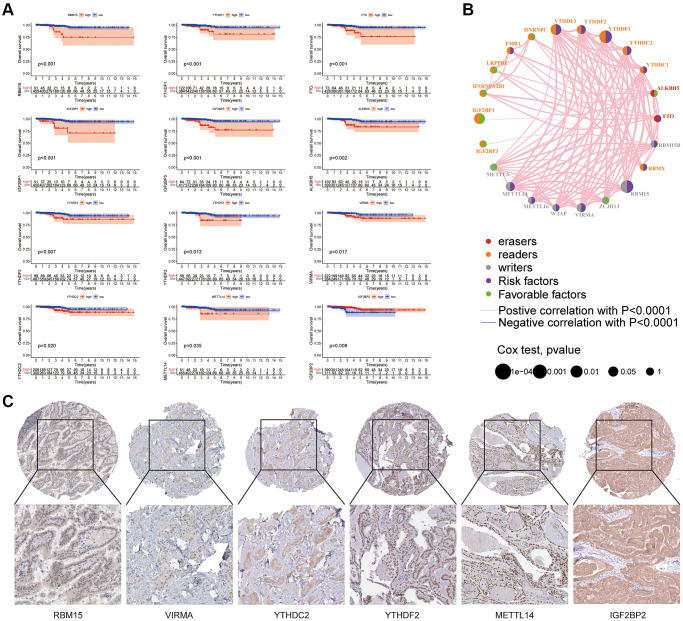
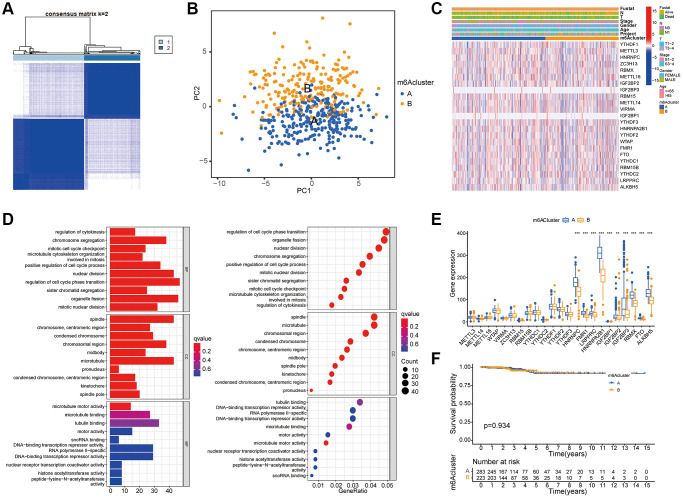
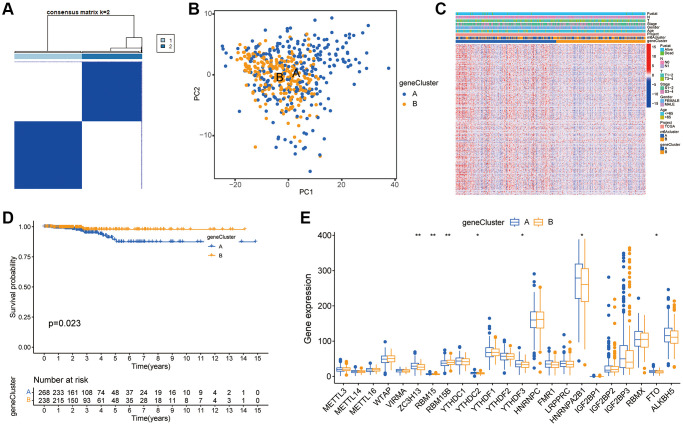
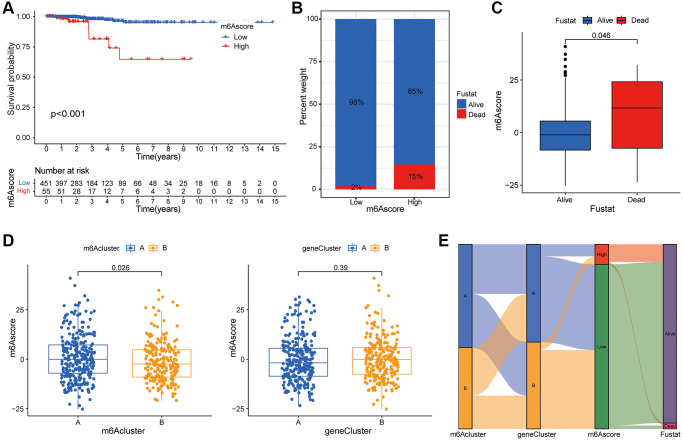
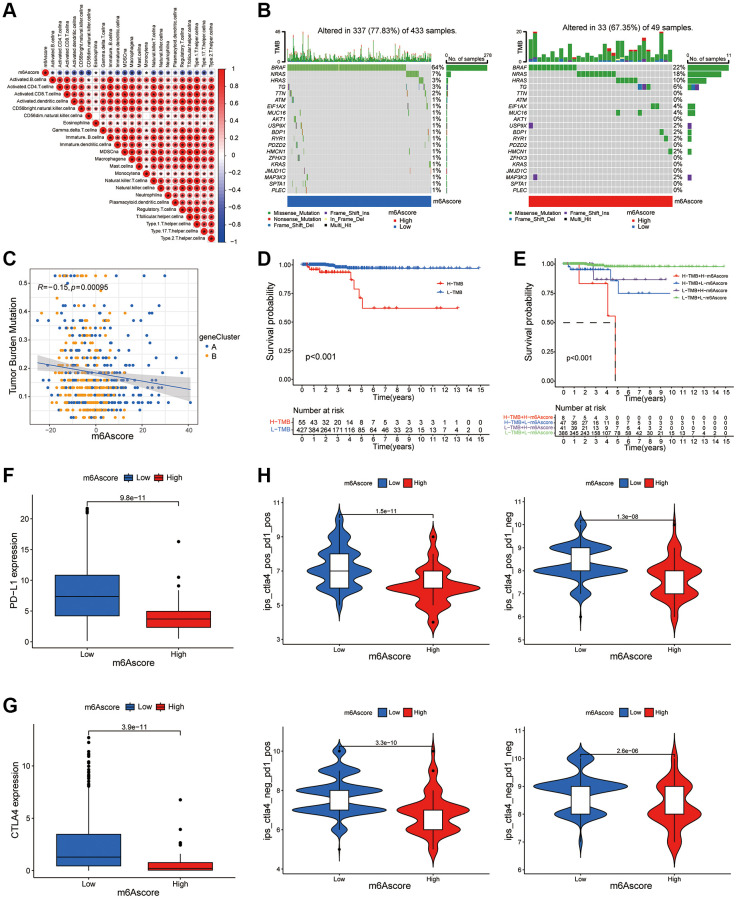
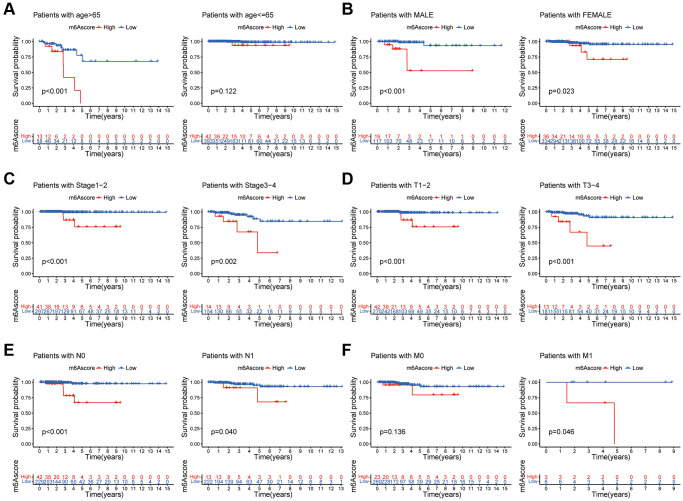
Results: Different expression patterns of m6A regulatory factors were detected in thyroid cancer tumors and normal tissues, and several prognoses related m6A genes were obtained. Two different m6A modification patterns were determined by consensus cluster analysis. Two different subgroups were established by screening overlapping DEGs between two m6A clusters, with cluster A having the best prognosis. According to the m6A score extracted from DEGs, thyroid cancer patients can be divided into high and low score subgroups. Patients with lower m6A score have longer survival time and better clinical features. The relationship between m6A score and Tumor Mutation Burden (TMB) and its correlation with the expression of PD-1 antibody and CTLA4 antibody proved that m6A score could be used as a potential predictor of the efficacy of immunotherapy in thyroid cancer patients.
Conclusions: We screened DEGs from cluster m6A and constructed a highly predictive model with prognostic value by dividing TCGA-THCA into two different clusters and performing m6A score analysis. This study will help clarify the overall impact of m6A modification patterns on thyroid cancer progression and formulate more effective immunotherapy strategies.
Keywords: N6-methyladenosine (m6A); The Cancer Genome Atlas (TCGA); geneCluster; m6Acluster; m6Ascore; thyroid cancer.
Conflict of interest statement
Figures
Similar articles
-
The emerging roles of N6-methyladenosine RNA modifications in thyroid cancer.Eur J Med Res. 2023 Nov 1;28(1):475. doi: 10.1186/s40001-023-01382-2. Eur J Med Res. 2023. PMID: 37915103 Free PMC article. Review.
-
Construction of a risk prediction model using m6A RNA methylation regulators in prostate cancer: comprehensive bioinformatic analysis and histological validation.Cancer Cell Int. 2022 Jan 19;22(1):33. doi: 10.1186/s12935-021-02438-1. Cancer Cell Int. 2022. PMID: 35045837 Free PMC article.
-
Comprehensive Analysis of PD-L1 Expression, Immune Infiltrates, and m6A RNA Methylation Regulators in Esophageal Squamous Cell Carcinoma.Front Immunol. 2021 May 12;12:669750. doi: 10.3389/fimmu.2021.669750. eCollection 2021. Front Immunol. 2021. PMID: 34054840 Free PMC article.
-
N6-Methyladenosine Modification Patterns and Tumor Microenvironment Immune Characteristics Associated With Clinical Prognosis Analysis in Stomach Adenocarcinoma.Front Cell Dev Biol. 2022 Jun 15;10:913307. doi: 10.3389/fcell.2022.913307. eCollection 2022. Front Cell Dev Biol. 2022. PMID: 35813200 Free PMC article.
-
The role of m6A-mediated PD-1/PD-L1 in antitumor immunity.Biochem Pharmacol. 2023 Apr;210:115460. doi: 10.1016/j.bcp.2023.115460. Epub 2023 Feb 21. Biochem Pharmacol. 2023. PMID: 36822438 Review.
Cited by
-
The role of epigenetic methylations in thyroid Cancer.World J Surg Oncol. 2024 Oct 25;22(1):281. doi: 10.1186/s12957-024-03568-2. World J Surg Oncol. 2024. PMID: 39456011 Free PMC article. Review.
-
Development of an m6A subtype classifier to guide precision therapy for patients with bladder cancer.J Cancer. 2024 Aug 13;15(16):5204-5217. doi: 10.7150/jca.99483. eCollection 2024. J Cancer. 2024. PMID: 39247586 Free PMC article.
-
Decoding the molecular symphony: interactions between the m6A and p53 signaling pathways in cancer.NAR Cancer. 2024 Sep 26;6(3):zcae037. doi: 10.1093/narcan/zcae037. eCollection 2024 Sep. NAR Cancer. 2024. PMID: 39329012 Free PMC article. Review.
-
RNA modifications in cancer immune therapy: regulators of immune cells and immune checkpoints.Front Immunol. 2024 Sep 20;15:1463847. doi: 10.3389/fimmu.2024.1463847. eCollection 2024. Front Immunol. 2024. PMID: 39372415 Free PMC article. Review.
-
The emerging roles of N6-methyladenosine RNA modifications in thyroid cancer.Eur J Med Res. 2023 Nov 1;28(1):475. doi: 10.1186/s40001-023-01382-2. Eur J Med Res. 2023. PMID: 37915103 Free PMC article. Review.
References
Publication types
MeSH terms
Substances
LinkOut - more resources
Full Text Sources
Medical
