. 2023 Feb 15;9(7):eadf6358.
doi: 10.1126/sciadv.adf6358. Epub 2023 Feb 15.

Phase separation of an actin nucleator by junctional microtubules regulates epithelial function

Affiliations

Phase separation of an actin nucleator by junctional microtubules regulates epithelial function

Kazuto Tsukita et al. Sci Adv. .

Abstract

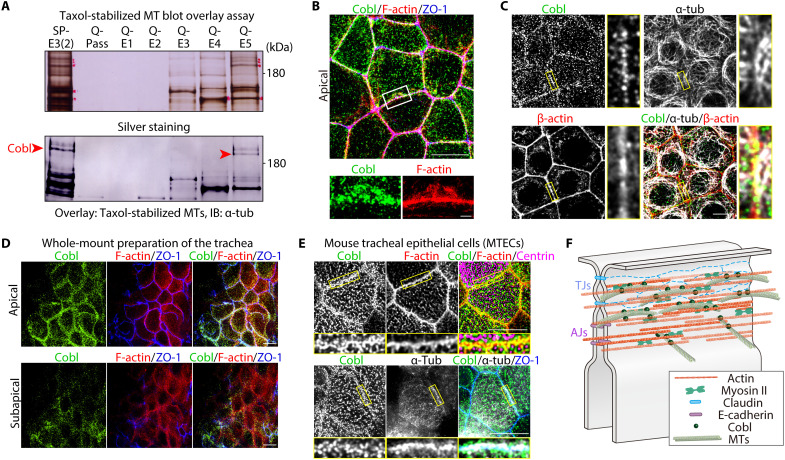
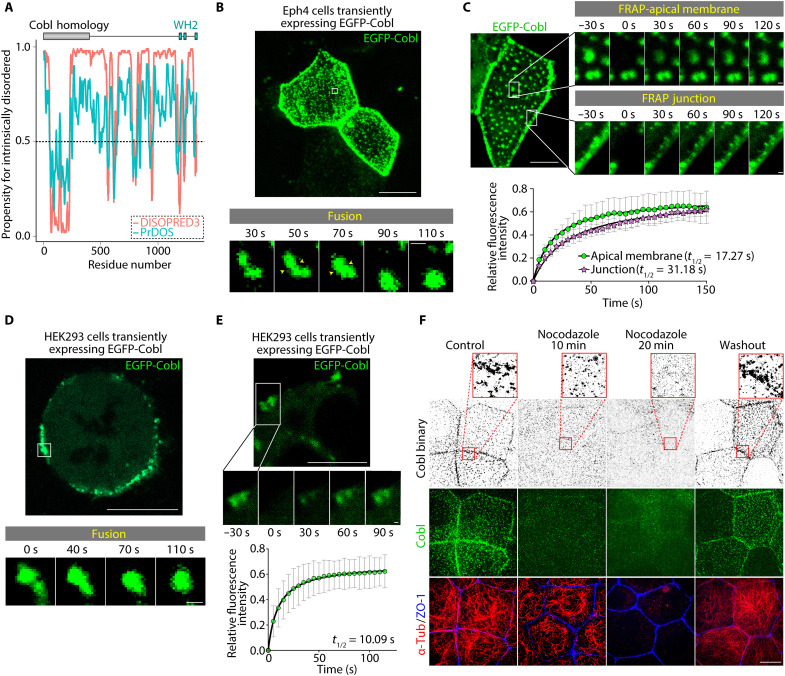
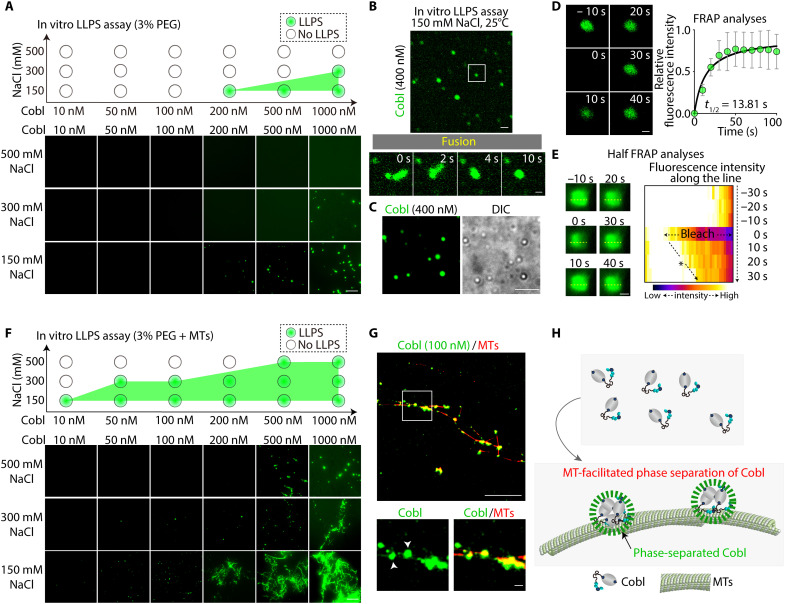
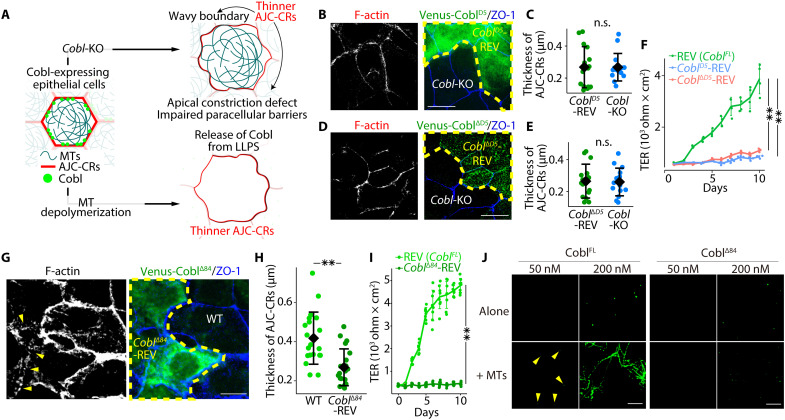
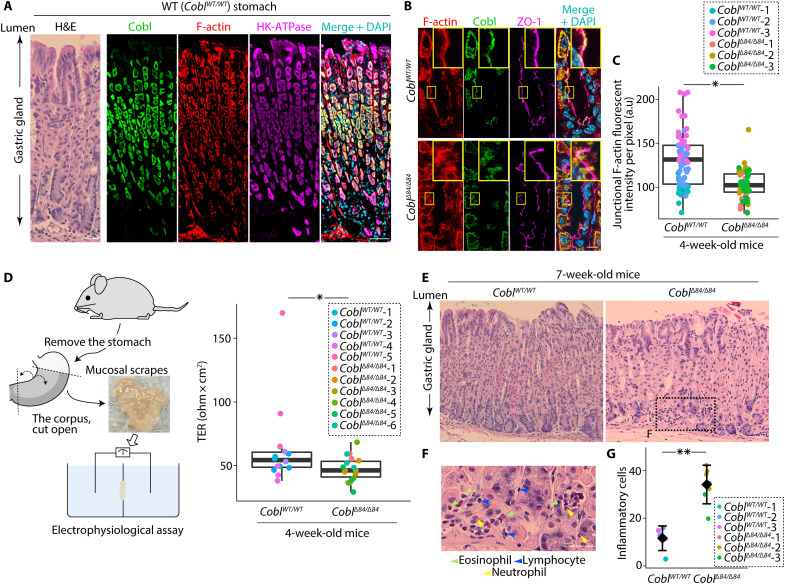
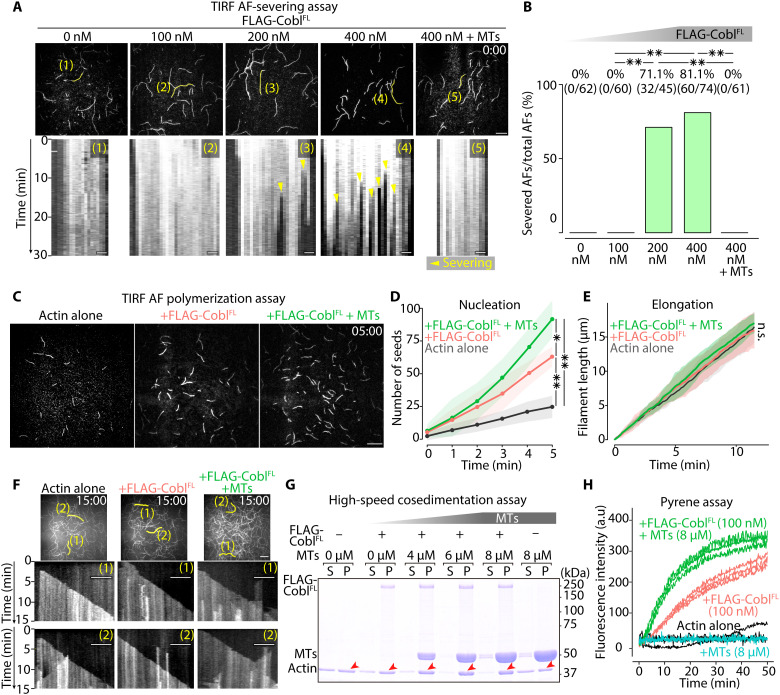
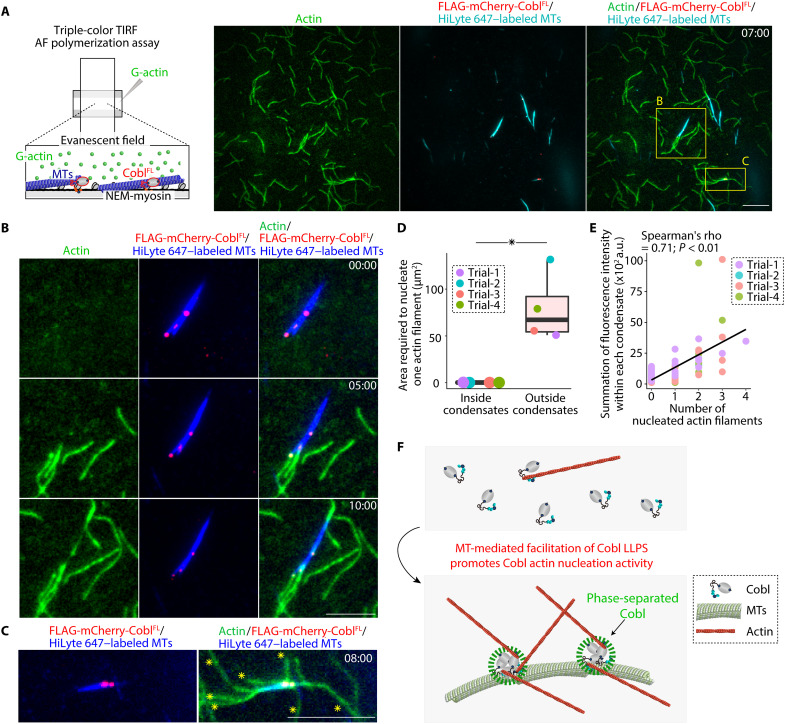
Liquid-liquid phase separation (LLPS) is involved in various dynamic biological phenomena. In epithelial cells, dynamic regulation of junctional actin filaments tethered to the apical junctional complex (AJC) is critical for maintaining internal homeostasis against external perturbations; however, the role of LLPS in this process remains unknown. Here, after identifying a multifunctional actin nucleator, cordon bleu (Cobl), as an AJC-enriched microtubule-associated protein, we conducted comprehensive in vitro and in vivo analyses. We found that apical microtubules promoted LLPS of Cobl at the AJC, and Cobl actin assembly activity increased upon LLPS. Thus, microtubules spatiotemporally regulated junctional actin assembly for epithelial morphogenesis and paracellular barriers. Collectively, these findings established that LLPS of the actin nucleator Cobl mediated dynamic microtubule-actin cross-talk in junctions, which fine-tuned the epithelial barrier.


Figures

Fig. 1.
Fig. 1.. Cobl was identified as an AJC-enriched, MT-associated protein.
(A) Membrane overlay assays of taxol-stabilized MTs using the AJC-enriched BC fraction (see also fig. S1). Immunoblotted bands marked by red arrowheads correspond to Cobl. (B) Representative superresolution micrographs of immunostained Eph4 epithelial cells in the apical plane (see also movie S1). Scale bar, 10 μm (low magnification) and 1 μm (high magnification). (C) In Eph4 cells, Cobl was closely associated with both actin and MTs at cell-cell junctions. Scale bar, 10 μm. (D) In the in vivo trachea, similarly to cultured Eph4 epithelial cells, Cobl localized to cell-cell junctions at the apical and subapical planes. Scale bar, 10 μm. (E) Cobl was also closely associated with both F-actin and MTs at the AJC in mouse tracheal epithelial cells (MTECs). Scale bar, 5 μm. (F) Schematic drawing of Cobl localization at the AJC in association with actomyosin-based CR and MTs.
Fig. 2.
Fig. 2.. Cobl underwent LLPS in an MT-dependent manner in cells.
(A) Prediction of internally disordered regions within Cobl. The results of DISOPRED3 (http://bioinf.cs.ucl.ac.uk/psipred) and PrDOS (https://prdos.hgc.jp), which are popular applications that accurately predict internally disordered regions, are shown. Higher propensity scores indicated an increased likelihood that the residue is intrinsically disordered. Considering that a cutoff of 0.5 is frequently used to determine intrinsically disordered residues, Cobl had an abundance of regions that were likely to be intrinsically disordered. (B) In Eph4 cells, EGFP-Cobl condensates underwent fusion within seconds (see also movie S3). Scale bar, 10 μm (low magnification) and 0.5 μm (high magnification). (C) The fluorescence intensities of EGFP-Cobl condensates recovered rapidly, with t1/2 values of 17.27 s (apical membrane) and 31.18 s (junction) (see also movie S4). Scale bar, 10 μm (low magnification) and 0.5 μm (high magnification). N = 4, each. (D) In HEK293 cells, exogenous EGFP-Cobl formed membrane-bound condensates (see also movie S5). Scale bar, 10 μm (low magnification) and 0.5 μm (high magnification). (E) The fluorescence intensities of EGFP-Cobl condensates recovered rapidly, with a t1/2 of 10.09 s. Scale bar, 10 μm (low magnification) and 0.5 μm (high magnification). N = 4. (F) Treatment with 2 μM nocodazole dissolved Cobl condensates in WT cells. Scale bar, 10 μm. Points represent means, and error bars represent SDs.
Fig. 3.
Fig. 3.. Cobl underwent LLPS in an MT-dependent manner in vitro.
(A) In vitro LLPS assay of Cobl. The tendency for Cobl to undergo LLPS was shown to be critically dependent on NaCl concentration, with higher NaCl concentrations resulting in a lower tendency. Protein concentration: FLAG-EGFP-CoblFL, 10, 50, 100, 200, 500, or 1000 nM. Scale bar, 10 μm. (B) Cobl condensates underwent fusion within seconds in vitro (see also movie S7). Scale bar, 10 μm (low magnification) and 0.5 μm (high magnification). Protein concentration: FLAG-EGFP-CoblFL, 400 nM. (C) Representative confocal and differential interference contrast (DIC) images of phase-separated Cobl condensates in vitro. Protein concentration: FLAG-EGFP-CoblFL, 400 nM. Scale bar, 5 μm. (D) Fluorescence intensities of in vitro Cobl condensates recovered rapidly, with a t1/2 of 13.81 s. Protein concentration: FLAG-EGFP-CoblFL, 400 nM. Scale bar, 0.5 μm. N = 4. (E) Half FRAP assay of larger Cobl condensates in vitro with a kymograph along the yellow dotted line. Fluorescence intensities of the bleached region recovered from the unbleached side with a t1/2 of 10.00 s (see also fig. S6D). Protein concentration: FLAG-EGFP-CoblFL, 1 μM. Scale bar, 1 μm. (F) In vitro LLPS assay of Cobl in the presence of MTs. The tendency for Cobl to undergo LLPS was apparently increased. Protein concentration: FLAG-EGFP-CoblFL, 10, 50, 100, 200, 500, or 1000 nM and MTs, 8 μM. Scale bar, 10 μm. (G) Cobl accumulated along HiLyte 647–labeled MTs and formed condensates on MTs (white arrowheads). Protein concentration: FLAG-EGFP-CoblFL, 100 nM and HiLyte 647–labeled MT, 8 μM. Scale bar, 10 μm (low magnification) and 0.5 μm (high magnification). (H) Schematic drawing of MT-facilitated phase separation of Cobl. Points represent means, and error bars represent SDs.
Fig. 4.
Fig. 4.. Cobl-KO and MT depolymerization impaired junctional actin assembly, causing defective apical constriction and reduced paracellular barrier function.
(A) Representative confocal micrographs of WT, Cobl-KO, and REV cells. Scale bar, 10 μm. (B) Cocultures of WT and Cobl-KO cells. Scale bar, 10 μm. (C) CR thickness, as determined by the method described in fig. S8C. **P < 0.01 (unpaired t test). N = 20 cells each. (D) Cocultures of REV and Cobl-KO cells. Scale bar, 10 μm. (E) CR thickness. **P < 0.01 (unpaired t test). N = 20 cells each. (F) EM analysis showed that the CR, indicated by yellow arrows in the EM images, was thinner in Cobl-KO cells than in Cobl-expressing (WT and REV) cells, as confirmed by subsequent quantification. Scale bar, 100 nm. **P < 0.01 (unpaired t test). N = 6 cells, each. (G) Heatmap of the WT and Cobl-KO cell surface area in cocultures. Scale bar, 10 μm. (H) Surface areas of WT and Cobl-KO cells. **P < 0.01 (Mann-Whitney U test). N = 3 micrographs each. (I) Daily changes in TER in WT, Cobl-KO, and REV cells. **P < 0.01 (Mann-Whitney U test). N = 8 trials each. (J) Fluxes of fluorescein or FITC-labeled dextran ranging in size from 0.4 to 40 kDa. *P < 0.05 (unpaired t test). N = 4 trials each. (K) WT cells treated with 2 μM nocodazole. Conditions are the same as in Fig. 2F. Scale bar, 10 μm. (L) Temporal changes in CR thickness and irregularity of the ZO-1–delineated boundary under 2 μM nocodazole treatment. N = 20 cells (actin thickness) and N = 50 cells (persistence length). Diamonds in dot plots, solid lines in line graphs, and bars in bar graphs represent means, and error bars or shaded areas represent SDs.
Fig. 5.
Fig. 5.. Neither CoblD5, CoblΔD5, nor CoblΔ84 rescued the phenotype of Cobl-KO cells.
(A) Schematic drawing of the effects of Cobl-KO and MT depolymerization on cultured epithelial cells. (B) Cocultures of Cobl-KO and CoblD5-REV cells. (C) CoblD5 alone did not rescue the phenotype of Cobl-KO cells (i.e., thinner CRs). n.s., not significant (Mann-Whitney U test). N = 16 cells each. Scale bar, 10 μm. (D) Cocultures of Cobl-KO and CoblΔD5-REV cells. (E) CoblΔD5 alone did not rescue the phenotype of Cobl-KO cells (i.e., thinner CRs). n.s., not significant (unpaired t test). N = 15 cells each. Scale bar, 10 μm. (F) Daily changes in TER in REV, CoblD5-REV, and CoblΔD5-REV cells. **P < 0.01 (unpaired t test). N = 4 trials each. (G) Cocultures of WT and CoblΔ84-REV cells revealed that the CR was still thinner in CoblΔ84-REV cells (yellow arrowheads) than in WT cells. Scale bar, 10 μm. (H) CR thickness. **P < 0.01 (Mann-Whitney U test). N = 20 cells, each. (I) Daily changes in TER in REV and CoblΔ84-REV cells. **P < 0.01 (unpaired t test). N = 8 trials, each. (J) In vitro LLPS assay of CoblFL and CoblΔ84 with and without MTs. Similar to the case of CoblFL, CoblΔ84 alone was able to undergo LLPS at a concentration of 200 nM. In the presence of MTs, CoblΔ84 did not undergo LLPS at a concentration of 50 nM in contrast to the case of CoblFL (yellow arrowheads). Scale bar, 10 μm. Protein concentration: FLAG-EGFP-CoblFL, 50 or 200 nM; FLAG-EGFP-CoblΔ84, 50 or 200 nM; and MTs, 8 μM. Diamonds in dot plots and solid lines in line graphs represent means, and error bars represent SDs.
Fig. 6.
Fig. 6.. Alternation of Cobl caused impaired epithelial permeability in the stomach and induced gastritis.
(A) In mouse stomachs, Cobl colocalized with F-actin in stomach epithelial cells that were positive for HK-ATPase (a marker for parietal cells). Scale bar, 50 μm. (B) Junctional F-actin accumulation was disturbed in CoblΔ84/Δ84 mice with a representative portion being enlarged in the top right. (C) Quantification of junctional F-actin accumulation. *P < 0.05 (Mann-Whitney U test). N = 3 mice each. (D) TER of the stomach. *P < 0.05 (Mann-Whitney U test). N = 5 (WT) and 6 (CoblΔ84/Δ84) mice. (E) Representative H&E staining of the gastric glands from WT and CoblΔ84/Δ84 mice. Scale bar, 50 μm. (F) Higher magnification image of inflammatory cell infiltration (green, blue, and yellow arrowheads) in the lamina propria mucosae of CoblΔ84/Δ84 mice. Scale bar, 50 μm. (G) Quantification of infiltrating inflammatory cells. **P < 0.01 (unpaired t test). N = 3 mice, each. In box plots, solid lines represent medians, boxes represent interquartile ranges, and error bars extending from the box represent the range of data within 1.5 times the interquartile range. In a dot plot, diamonds represent means, and error bars represent SDs.
Fig. 7.
Fig. 7.. MTs biased Cobl activity toward actin assembly.
(A) Representative micrographs at the time when FLAG-CoblFL was added (t = 0 min) to AFs (see also movie S8), with respective kymographs showing the time course of the marked filaments (yellow lines). Protein concentration: Alexa Fluor 488–labeled G-actin, 0.5 μM; FLAG-CoblFL, 0, 100, 200, or 400 nM; and MTs, 0 or 4 μM. Scale bar, 10 μm (micrographs) and 1 μm (kymographs). (B) Severing probability quantified at 30 min after FLAG-CoblFL addition. **P < 0.01 (Fisher’s exact test). (C) Representative micrographs at 5 min after initiating polymerization (see also movie S9). Protein concentration: Alexa Fluor 488–labeled G-actin, 1 μM; FLAG-CoblFL, 0 or 100 nM; and MTs = 0 or 8 μM. Scale bar, 10 μm. (D) Time course of the number of seeds [per one TIRF movie (81.92 μm2)] for 5 min after initiating the polymerization. **P < 0.01 and *P < 0.05 (unpaired t test). N = 3 trials each. (E) Change in AF length over time (unpaired t test). N = 15 filaments each. (F) Kymographs of the marked filaments (yellow lines in representative micrographs) demonstrated similar elongation rates. Scale bar, 10 μm (micrographs) and 5 μm (kymographs). (G) High-speed cosedimentation assay showing a change in the actin pellet (P) fraction (red arrowheads; see also fig. S13D) in the presence of Cobl and MTs. Protein concentration: G-actin, 1 μM; FLAG-CoblFL, 0 or 100 nM; and MTs, 0, 4, 6, or 8 μM. (H) MTs increased the slope of the Cobl actin polymerization curves. Protein concentration: pyrene-labeled G-actin, 1 μM; FLAG-CoblFL, 0 or 100 nM; and MTs, 0 or 8 μM. N = 3 trials each. Solid lines represent means, and shaded areas represent SDs.
Fig. 8.
Fig. 8.. MT-mediated Cobl LLPS resulted in MT-dependent promotion of Cobl actin nucleation.
(A) Representative TIRF micrographs at 7 min, obtained using triple-color TIRF microscopic analyses (see also movie S12). Protein concentration: Alexa Fluor 488–labeled G-actin, 1 μM; FLAG-mCherry-CoblFL, 100 nM; and HiLyte 647–labeled MTs, 4 μM. Scale bar, 10 μm. (B) MTs elongated AFs directly via CoblFL condensates (see also movie S13). Scale bar, 5 μm. (C) Large Cobl condensates could elongate several AFs, as indicated by yellow asterisks (see also movie S14). Scale bar, 5 μm. (D) The area required to nucleate one AF. *P < 0.05 (Mann-Whitney U test). N = 4 trials, each. (E) Correlation between the number of AFs from each condensate and the fluorescence intensity within each condensate. (F) Schematic drawing of the mechanism underlying MT-mediated facilitation of Cobl actin nucleation activity. In a box plot, solid lines represent medians, boxes represent interquartile ranges, and error bars extending from the box represent the range of data within 1.5 times the interquartile range.

References

    1. Y. Shin, C. P. Brangwynne, Liquid phase condensation in cell physiology and disease. Science 357, eaaf4382 (2017). - PubMed
    1. L. B. Case, X. Zhang, J. A. Ditlev, M. K. Rosen, Stoichiometry controls activity of phase-separated clusters of actin signaling proteins. Science 363, 1093–1097 (2019). - PMC - PubMed
    1. O. Beutel, R. Maraspini, K. Pombo-García, C. Martin-Lemaitre, A. Honigmann, Phase separation of zonula occludens proteins drives formation of tight junctions. Cell 179, 923–936.e11 (2019). - PubMed
    1. F. G. Quiroz, V. F. Fiore, J. Levorse, L. Polak, E. Wong, H. A. Pasolli, E. Fuchs, Liquid-liquid phase separation drives skin barrier formation. Science 367, eaax9554 (2020). - PMC - PubMed
    1. S. Citi, Cell biology: Tight junctions as biomolecular condensates. Curr. Biol. 30, R83–R86 (2020). - PubMed

MeSH terms