. 2023 Feb 15;15(683):eadc9854.
doi: 10.1126/scitranslmed.adc9854. Epub 2023 Feb 15.

Data-driven longitudinal characterization of neonatal health and morbidity

Affiliations

Data-driven longitudinal characterization of neonatal health and morbidity

Davide De Francesco et al. Sci Transl Med. .

Abstract

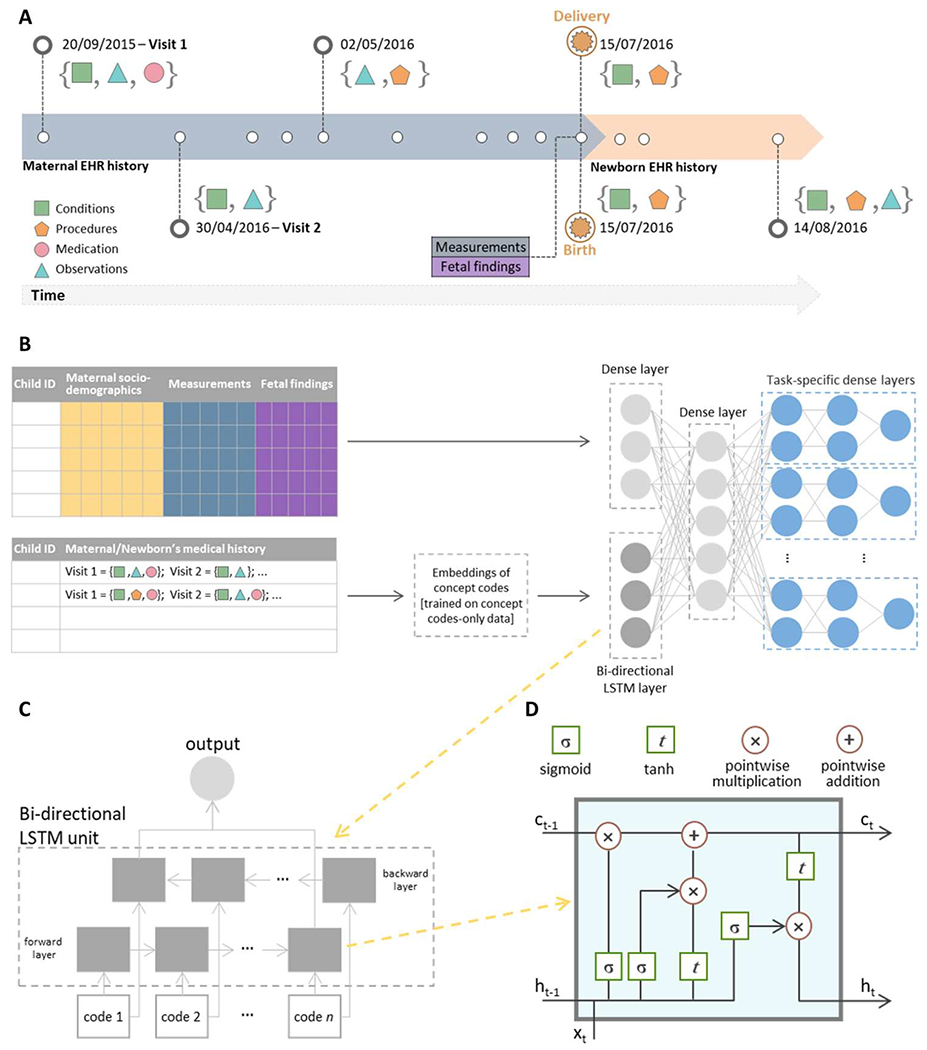
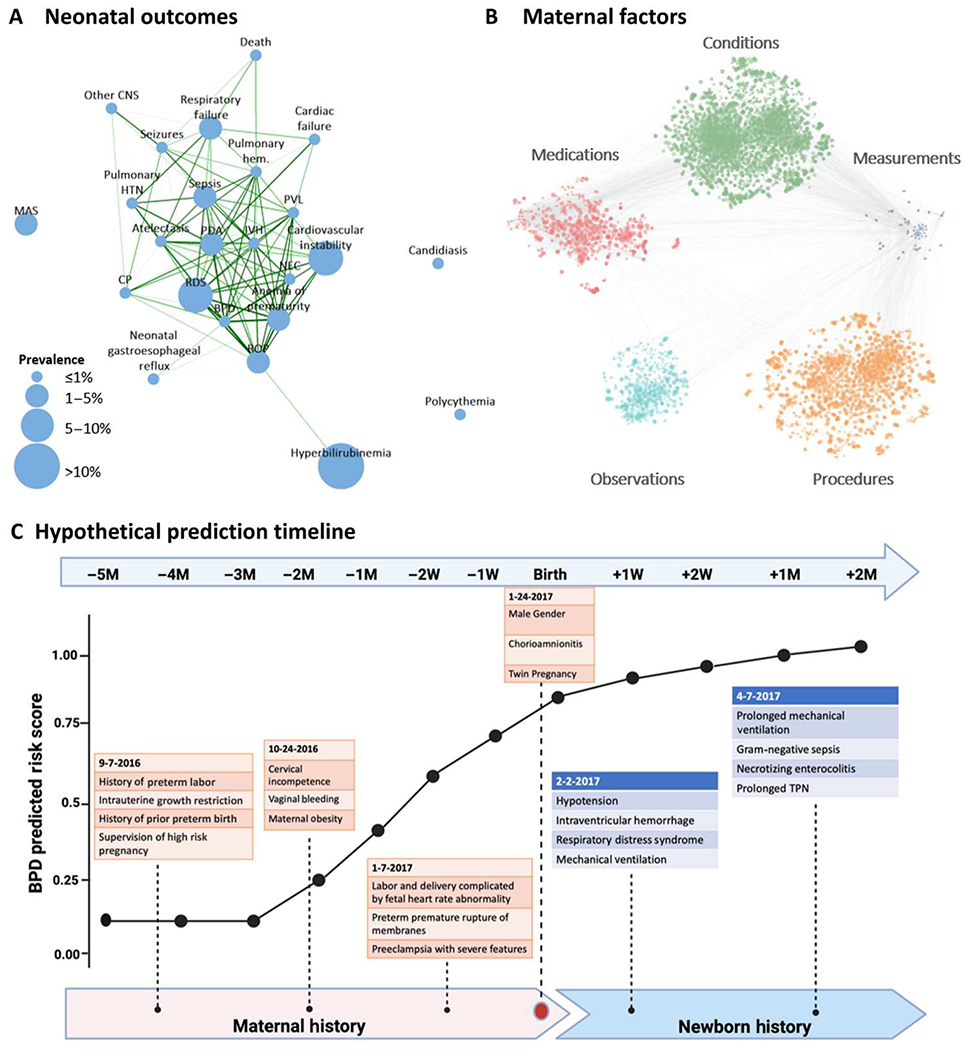
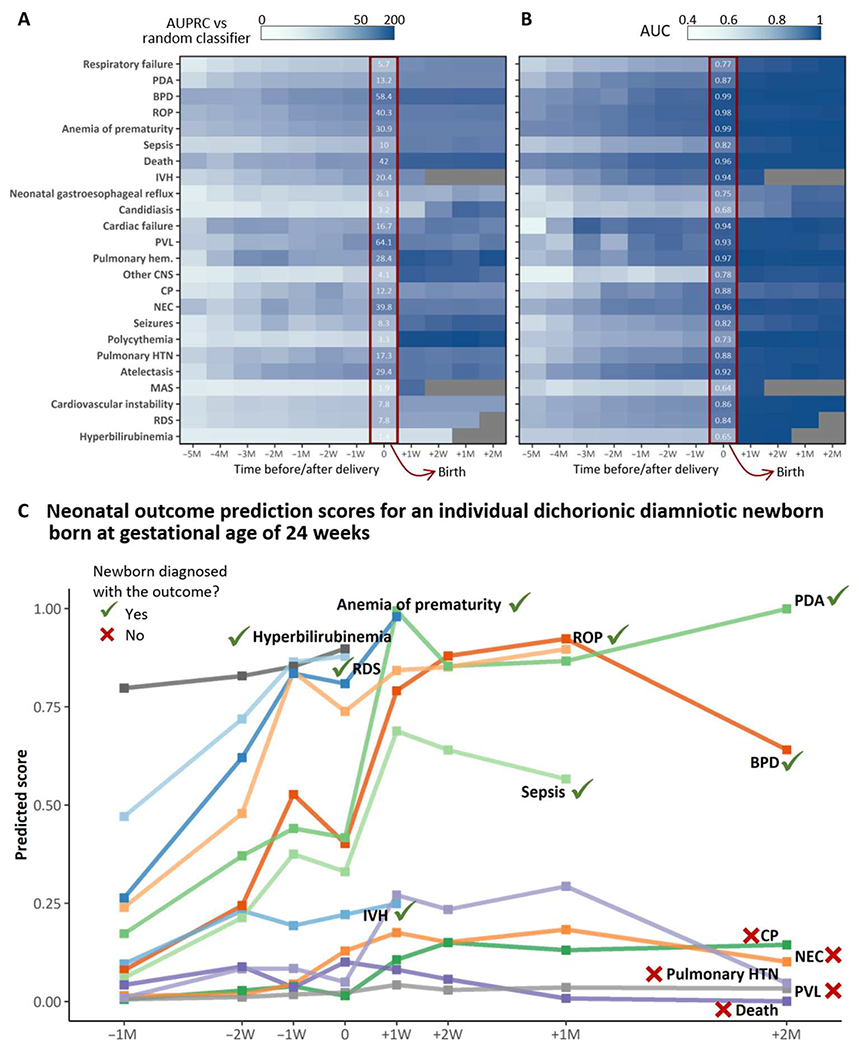
Although prematurity is the single largest cause of death in children under 5 years of age, the current definition of prematurity, based on gestational age, lacks the precision needed for guiding care decisions. Here, we propose a longitudinal risk assessment for adverse neonatal outcomes in newborns based on a deep learning model that uses electronic health records (EHRs) to predict a wide range of outcomes over a period starting shortly before conception and ending months after birth. By linking the EHRs of the Lucile Packard Children's Hospital and the Stanford Healthcare Adult Hospital, we developed a cohort of 22,104 mother-newborn dyads delivered between 2014 and 2018. Maternal and newborn EHRs were extracted and used to train a multi-input multitask deep learning model, featuring a long short-term memory neural network, to predict 24 different neonatal outcomes. An additional cohort of 10,250 mother-newborn dyads delivered at the same Stanford Hospitals from 2019 to September 2020 was used to validate the model. Areas under the receiver operating characteristic curve at delivery exceeded 0.9 for 10 of the 24 neonatal outcomes considered and were between 0.8 and 0.9 for 7 additional outcomes. Moreover, comprehensive association analysis identified multiple known associations between various maternal and neonatal features and specific neonatal outcomes. This study used linked EHRs from more than 30,000 mother-newborn dyads and would serve as a resource for the investigation and prediction of neonatal outcomes. An interactive website is available for independent investigators to leverage this unique dataset: https://maternal-child-health-associations.shinyapps.io/shiny_app/.


Conflict of interest statement

Competing interests: The methods described in this manuscript are covered in the U.S. provisional patent no. 63/268,689 (“Systems and methods to assess neonatal health risk and uses thereof”) filed on 28 February 2022 by Stanford University. The authors declare that they have no other competing interests relevant to this work. S.M. is a paid consultant for Danaher and Longitude Capital and receives a paid fellowship from Nucleate. N.G.R. is currently a full-time employee of Illumina Inc. J.H.F. is an advisor to Vitara, OvaryIt, Keriton, EmpoHealth, and Avanos; the consulting medical director of Novonate; and a cofounder for EMME. B.C. is a paid consultant for Gauss Surgical and currently consults for Stryker and Flat Medical. K.G.S. is a consultant for Avexegen Therapeutics, Infinant Health, mProbe,and Mission Biocapital. M.S.A. is a member of the Scientific Advisory Board of Cytonics Inc. and AfaSci Research Laboratories and is a paid consultant for Syneos Health. D.K.S. is a member of the Clinical Advisory Board of Maternica Therapeutics. M.S. is a member of the Scientific Advisory Board of Exagen and Aria Pharmaceuticals and is a shareholder at Somnics. N.A. is a member of the Scientific Advisory Boards of January AI, Parallel Bio, Celine Therapeutics, and WellSim Biomedical Technologies and is a paid consultant for MaraBio Systems.

Figures

Fig. 1.
Fig. 1.. Overview of the machine learning pipeline for prediction of neonatal outcomes.
(A) An example of a hypothetical patient timeline with multiple visits before and after delivery/birth; at each visit, any combination of conditions, observations, medications, and procedures can be recorded. (B) Architecture of the multi-input multitask deep learning model: The sequence of codes from the maternal/newborn medical history, after code embeddings, is fed into a bidirectional LSTM layer with 128 units, whereas maternal/newborn sociodemographic information, maternal measurements, and, when specified, gestational age and birth weight are fed into a four-unit dense layer. The outputs of these two networks are then concatenated and fed into a dense one-layer neural network with 64 units, followed by a set of dense layers, one set for each outcome, consisting of two dense layers and a single-unit output. (C) A bidirectional LSTM layer learns bidirectional long-term dependencies between concept codes within a sequence: Embeddings of each code in the sequence are fed into a forward and a backward LSTM layer, and the outputs of the two layers are further concatenated. While processing, the hidden state from the layer of embeddings of the previous code in the sequence is passed to the layer of the embeddings of the following code of the sequence; the hidden state acts as the memory of the neural network, holding information on previous data the network has seen before. (D) Structure of a single LSTM layer for the tth code in the sequence: Ct is the cell state that carries relevant information throughout the processing of the sequence, ht is the hidden state of the tth code in the sequence that is passed to the layer of the next code in the sequence, and xt is the input to the layer processing the tth code in the sequence, that is, the vector corresponding to the embeddings of the tth code in the sequence. Each line carries an entire vector, circles represent pointwise operations, and boxes represent learned neural network layers with the indicated activation function. Lines merging denote concatenation, and line forking denotes that the content is copied and that the copies go to different locations. Conceptually, the LSTM layer learns what information must be discarded from the cell state and what new information has to be stored in the cell state; last, the output is calculated on the basis of the cell state and the processed input.
Fig. 2.
Fig. 2.. Overview of data components.
(A) Tetrachoric correlation plot of the 24 neonatal outcomes considered. The size of each node is proportional to its prevalence in the study dataset; nodes are connected if the correlation is greater than 0.5, and edge thickness and color are proportional to the strength of the correlation, with the darker green color and thicker lines showing stronger correlations. (B) Correlation plot of EHR codes in maternal medical histories and measurements: Each node represents a code or measurement. The size of the node is proportional to the metric (described in Materials and Methods) for feature importance, averaged across all outcomes; edges connect nodes whose correlation is among the top 1% of all correlations. (C) Hypothetical prediction timeline for a newborn with BPD; the predicted score from the deep learning model at different time points is based on various risk factors obtained from EHR records in the maternal and newborn history. Throughout pregnancy, at birth, and in the postnatal period, additional data are incorporated into the model, and the prediction model iteratively improves. BPD prediction scores should not be interpreted as individual probabilities for the later development of BPD. RDS, respiratory distress syndrome; IVH, intraventricular hemorrhage; NEC, necrotizing enterocolitis; ROP, retinopathy of prematurity; BPD, bronchopulmonary dysplasia; PDA, patent ductus arteriosus; PVL, periventricular leukomalacia; CP, cerebral palsy; HTN, hypertension; MAS, meconium aspiration syndrome; CNS, central nervous system; M, month.
Fig. 3.
Fig. 3.. Multitask analysis of EHR data results in a longitudinal and comprehensive predictive model of neonatal morbidity before and after birth.
(A and B) The heatmaps are shaded according to the multitask modeling output that results in a fold increase/decrease in AUPRC (A) compared with a random classifier or AUC (B) of the deep learning model. The x axis represents time from 5 months before delivery/birth (−5M) up to 2 months after delivery/birth (+2M); 0 indicates delivery/birth. Numbers in white are the fold increase/decrease in AUPRC compared with a random classifier or AUC of the deep learning model at delivery/birth. All outcomes before birth incorporate maternal codes at either 5M,4M, 3M, 2M, 1M, 2W (2 weeks), or 1W before birth. All outcomes at birth incorporate all maternal inputs up to and including delivery. All outcomes after birth incorporate maternal and neonatal inputs up to a specific postnatal time point (1 week, 2 weeks, 1 month, or 2 months). (C) An example of neonatal outcome prediction scores for an individual dichorionic patient born at Lucile Packard Children’s Hospital at the gestational age of 24 weeks and 2 days after PPROM, chorioamnionitis, and spontaneous PTL. Risk prediction was calculated on the basis of maternal and neonatal codes that chronologically lead up to and include a specific diagnosis but do not extend beyond the date of an individual diagnosis (when this occurs). The patient ultimately had EHR diagnoses of RDS, IVH (grade I bilateral), BPD, sepsis, PDA, anemia of prematurity, ROP, and hyperbilirubinemia. The individual prediction score at birth was highest for ROP, anemia of prematurity, RDS, and hyperbilirubinemia, all diagnoses that the patient ultimately had. The prediction score at birth was lowest for NEC, pulmonary hypertension, CP, PVL, and death. Despite this infant’s high risk for these diagnoses, the patient is alive and never developed any of these outcomes, with the exception of transient pulmonary hypertension. We acknowledge and thank the parents of this patient who gave us permission to create and publish this individual’s risk prediction score.
Fig. 4.
Fig. 4.. An LSTM-based autoencoder enables objective identification of subgroups with enhanced performance for the deep learning model.
(A) Architecture of the LSTM autoencoder used to extract a lower-dimensional encoded representation of the input sequences containing the maternal EHR history. (B) Subgroup discovery proceeds iteratively at each level by dividing the dataset into many overlapping subgroups defined by variables of the obtained latent space. The search path for a single subgroup proceeds down two levels. At the end of the procedure, subgroups are scored and ranked on the basis of predefined scoring criteria (such as AUPRC) for further analysis. (C) Classification accuracy, in terms of AUC, AUPRC, and AUPRC compared with a random classifier, in subgroups identified through subgroup discovery and in the full dataset (cohorts 1 and 2 combined).
Fig. 5.
Fig. 5.. Pathological mechanisms underlying NEC that are leveraged by the multitask approach to improve NEC predictions.
(A) Correlation network of the top 20 conditions, medications, observations, procedures, and measurements with the strongest association across all of the 24 neonatal outcomes, including NEC; the metric obtained from odds ratios as described in Materials and Methods was used to rank conditions, medications, measurements, procedures, and measurements; the top 20 concept codes within each set, i.e., those for which the average of the obtained metrics across all neonatal outcomes was the highest, were selected. A t-distributed stochastic neighbor embedding (tSNE) map of the resulting concept codes was constructed. Nodes represent concept codes (conditions, observations, procedures, medications, and measurements), and edges connect nodes with a correlation exceeding 0.8. Correlations were assessed using tetrachoric, biserial, or Pearson’s correlation coefficient, as appropriate; the size of the nodes is proportional to the odds ratio of NEC. The larger the node, the stronger the association with the outcome, regardless of whether it is a positive or a negative association. (B) AUC for the prediction of NEC of the single-task model (black dashed line), the two-output multitask model simultaneously predicting NEC and polycythemia (green line), and the two-output multitask model simultaneously predicting NEC and anemia of prematurity (blue line). (C) Comparison of neonatal hemoglobin concentrations at birth, 1 month, 2 months, 3 months, and 4 months of age for neonates diagnosed with NEC versus those not diagnosed with NEC. Infants who developed NEC had lower hemoglobin concentrations at birth compared with infants who did not develop NEC. (D) Maternal hemoglobin concentration at the time of delivery versus NEC predicted score for neonates diagnosed with NEC and those never diagnosed with NEC. (E) Newborn hemoglobin at birth versus NEC predicted score for neonates diagnosed with NEC and those never diagnosed with NEC.
Fig. 6.
Fig. 6.. The deep learning model can discriminate between IVH gradings and provides insight into the pathological mechanisms underlying IVH.
(A) IVH predicted scores from the model at delivery in newborns stratified by IVH grading. Patients with higher IVH prediction scores (≥0.2) are twice as likely to develop IVH compared with those with lower IVH prediction. IVH prediction scores should not be interpreted as individual probabilities for the development of IVH. Neonates in the unspecific grade category had discrepancies in the IVH grade reported in the ultrasound reports and their SNOMED coding such that it was difficult to classify them according to the Papile grading system. (B) Correlation network of the top 20 conditions, medications, observations, procedures, and measurements with the strongest association across all 24 neonatal outcomes. The metric obtained from odds ratios was used to rank conditions, medications, measurements, procedures, and measurements and to select the top 20 within each set with the highest average across neonatal outcomes. A tSNE map of the resulting features was constructed. Nodes represent conditions, observations, procedures, medications, and measurements, and edges connect nodes with a correlation exceeding 0.8; correlation was assessed using tetrachoric, biserial, or Pearson’s correlation coefficient, as appropriate. The size of the nodes is proportional to the odds ratio with IVH; the larger the node, the stronger is the association with the outcome, regardless of whether it is a positive or a negative association.

Similar articles

Cited by

  • Towards a new taxonomy of preterm birth.
    Stevenson DK, Chang AL, Wong RJ, Reiss JD, Gaudillière B, Sylvester KG, Ling XB, Angst MS, Shaw GM, Katz M, Aghaeepour N, Marić I. Stevenson DK, et al. J Perinatol. 2024 Nov 20. doi: 10.1038/s41372-024-02183-z. Online ahead of print. J Perinatol. 2024. PMID: 39567650 Review.
  • Applications of Metabolomics and Lipidomics in the Neonatal Intensive Care Unit.
    Reiss JD, Mataraso SJ, Holzapfel LF, Marić I, Kasowski MM, Martin CR, Long JZ, Stevenson DK, Shaw GM; Stanford Metabolic Health Center. Reiss JD, et al. Neoreviews. 2025 Feb 1;26(2):e100-e114. doi: 10.1542/neo.26-2-011. Neoreviews. 2025. PMID: 39889768 Free PMC article. Review.
  • AI-guided precision parenteral nutrition for neonatal intensive care units.
    Phongpreecha T, Ghanem M, Reiss JD, Oskotsky TT, Mataraso SJ, De Francesco D, Reincke SM, Espinosa C, Chung P, Ng T, Costello JM, Sequoia JA, Razdan S, Xie F, Berson E, Kim Y, Seong D, Szeto MY, Myers F, Gu H, Feister J, Verscaj CP, Rose LA, Sin LWY, Oskotsky B, Roger J, Shu CH, Shome S, Yang LK, Tan Y, Levitte S, Wong RJ, Gaudillière B, Angst MS, Montine TJ, Kerner JA, Keller RL, Shaw GM, Sylvester KG, Fuerch J, Chock V, Gaskari S, Stevenson DK, Sirota M, Prince LS, Aghaeepour N. Phongpreecha T, et al. Nat Med. 2025 Jun;31(6):1882-1894. doi: 10.1038/s41591-025-03601-1. Epub 2025 Mar 25. Nat Med. 2025. PMID: 40133525 Free PMC article.
  • Large-scale correlation network construction for unraveling the coordination of complex biological systems.
    Becker M, Nassar H, Espinosa C, Stelzer IA, Feyaerts D, Berson E, Bidoki NH, Chang AL, Saarunya G, Culos A, De Francesco D, Fallahzadeh R, Liu Q, Kim Y, Marić I, Mataraso SJ, Payrovnaziri SN, Phongpreecha T, Ravindra NG, Stanley N, Shome S, Tan Y, Thuraiappah M, Xenochristou M, Xue L, Shaw G, Stevenson D, Angst MS, Gaudilliere B, Aghaeepour N. Becker M, et al. Nat Comput Sci. 2023 Apr;3(4):346-359. doi: 10.1038/s43588-023-00429-y. Epub 2023 Apr 13. Nat Comput Sci. 2023. PMID: 38116462 Free PMC article.
  • Early prediction of mortality and morbidities in VLBW preterm neonates using machine learning.
    Shu CH, Zebda R, Espinosa C, Reiss J, Debuyserie A, Reber K, Aghaeepour N, Pammi M. Shu CH, et al. Pediatr Res. 2025 May;97(6):2056-2064. doi: 10.1038/s41390-024-03604-7. Epub 2024 Oct 8. Pediatr Res. 2025. PMID: 39379627 Free PMC article.

References

    1. Liu L, Oza S, Hogan D, Chu Y, Perin J, Zhu J, Lawn JE, Cousens S, Mathers C, Black RE, Global, regional, and national causes of under-5 mortality in 2000–15: An updated systematic analysis with implications for the Sustainable Development Goals. Lancet 388, 3027–3035 (2016). - PMC - PubMed
    1. Tyson JE, Parikh NA, Langer J, Green C, Higgins RD, Intensive care for extreme prematurity—Moving beyond gestational age. N. Engl. J. Med 358, 1672–1681 (2008). - PMC - PubMed
    1. Stoll BJ, Hansen NI, Bell EF, Walsh MC, Carlo WA, Shankaran S, Laptook AR, Sánchez PJ, Van Meurs KP, Wyckoff M, Das A, Hale EC, Ball BB, Newman NS, Schibler K, Poindexter BB, Kennedy KA, Cotten CM, Watterberg KL, D’Angio CT, DeMauro SB, Truog WE, Devaskar U, Higgins RD, Trends in care practices, morbidity, and mortality of extremely preterm neonates, 1993-2012. JAMA 314, 1039–1051 (2015). - PMC - PubMed
    1. Stoll BJ, Hansen NI, Bell EF, Shankaran S, Laptook AR, Walsh MC, Hale EC, Newman NS, Schibler K, Carlo WA, Kennedy KA, Poindexter BB, Finer NN, Ehrenkranz RA, Duara S, Sanchez PJ, O’Shea TM, Goldberg RN, Van Meurs KP, Faix RG, Phelps DL, Frantz ID, Watterberg KL, Saha S, Das A, Higgins RD; Eunice Kennedy Shriver National Institute of Child Health and Human Development Neonatal Research Network, Neonatal outcomes of extremely preterm infants from the NICHD Neonatal Research Network. Pediatrics 126, 443–456 (2010). - PMC - PubMed
    1. Stevenson DK, Wong RJ, Hay WW Jr, Comments on the 20th anniversary of NeoReviews. Neoreviews 21, e643–e648 (2020). - PubMed

Publication types