. 2023 Mar 17;18(3):549-560.
doi: 10.1021/acschembio.2c00893. Epub 2023 Feb 15.

Mechanistic Insight into the Suppression of Polyglutamine Aggregation by SRCP1

Affiliations

Mechanistic Insight into the Suppression of Polyglutamine Aggregation by SRCP1

Holly N Haver et al. ACS Chem Biol. .

Abstract

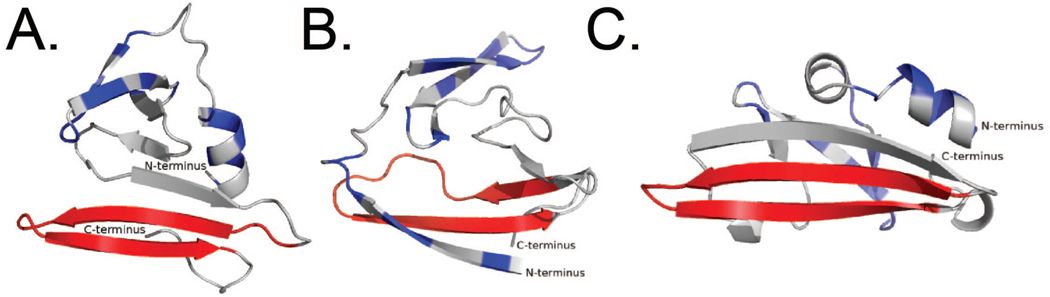
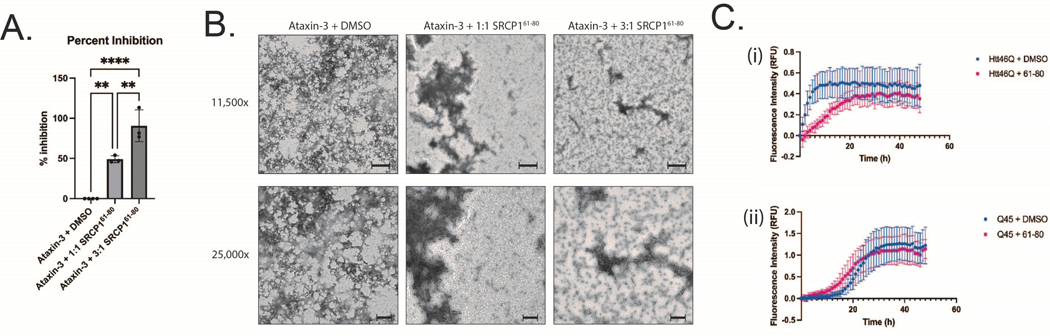
Protein aggregation is a hallmark of the polyglutamine diseases. One potential treatment for these diseases is suppression of polyglutamine aggregation. Previous work identified the cellular slime mold Dictyostelium discoideum as being naturally resistant to polyglutamine aggregation. Further work identified serine-rich chaperone protein 1 (SRCP1) as a protein that is both necessary in Dictyostelium and sufficient in human cells to suppress polyglutamine aggregation. Therefore, understanding how SRCP1 suppresses aggregation may be useful for developing therapeutics for the polyglutamine diseases. Here we utilized a de novo protein modeling approach to generate predictions of SRCP1's structure. Using our best-fit model, we generated mutants that were predicted to alter the stability of SRCP1 and tested these mutants' stability in cells. Using these data, we identified top models of SRCP1's structure that are consistent with the C-terminal region of SRCP1 forming a β-hairpin with a highly dynamic N-terminal region. We next generated a series of peptides that mimic the predicted β-hairpin and validated that they inhibit aggregation of a polyglutamine-expanded mutant huntingtin exon 1 fragment in vitro. To further assess mechanistic details of how SRCP1 inhibits polyglutamine aggregation, we utilized biochemical assays to determine that SRCP1 inhibits secondary nucleation in a manner dependent upon the regions flanking the polyglutamine tract. Finally, to determine if SRCP1 more could generally suppress protein aggregation, we confirmed that it was sufficient to inhibit aggregation of polyglutamine-expanded ataxin-3. Together these studies provide details into the structural and mechanistic basis of the inhibition of protein aggregation by SRCP1.


Figures

Figure 1:
Figure 1:. A C-terminal region of SRCP1 is predicted to be structured and have a propensity to self-aggregate.
A. SRCP1 is predicted to have a disordered N-terminal domain and a structured C-terminal domain. Predicted probability of the disorder of SRCP1 residues was generated using DisEMBL and PrDOS. B. The C-terminal domain of SRCP1 is predicted to be hydrophobic. The hydropathicity profile for the sequence of SRCP1 was generated using Expasy ProtScale. C. The C-terminal domain of SRCP1 is predicted to self-aggregate. The calculated free energy for SRCP1 residues was predicted in self-aggregation using PASTA2.0.
Figure 2:
Figure 2:. Computational modeling of SRCP1 predicts that it has a largely disordered N-terminal region and a β-sheet rich C-terminal region.
A. SRCP1’s amino acid sequence was used for similarity and co-evolutionary analysis. No similar structural data was found to use for template modeling. B. Rosetta’s Ab Initio protocol was utilized to predict de novo protein models from the amino acid sequence in A. Models were plotted as Rosetta energy score vs. Cα RMSD to the lowest scoring model (top) or Cα RMSD to the “core” residues predicted to be structured (bottom). Each dot represents one model. Models were clustered according to similar Cα RMSD and the lowest energy clusters (circled) were chosen for further analysis. C. The top 18 models were chosen from the clusters and refined through the Rosetta Hybridize protocol. After hybridization, models were in a more relaxed conformation, as denoted by a lower Rosetta energy score. D. The top 12 refined models from hybridization were chosen for Molecular Dynamics simulations. Models with lower RMSD over time were predicted to be the most stable models. E. Initial model selected for experimental validation.
Figure 3:
Figure 3:. SRCP1 models are predicted to form a β-hairpin at residues 61–80.
A-C. Three of the top predicted models from Figure 2 are shown. Serine and threonine residues (blue) and SRCP161−80 (red) are highlighted.
Figure 4:
Figure 4:. Experimental evaluation of the SRCP1 model.
In silico scanning mutagenesis was performed on the initial model from Fig 2C to predict key amino acids that would either increase or decrease SRCP1 stability. A. WT or mutant RFPSRCP1 was transfected into HEK293 cells (n=6). Samples were collected 48 h post-transfection and analyzed by western blot. Quantification of RFP signal is shown (****p<0.0001). B. Correlation plots showing the correlation between the average mutant signal change from WT SRCP1 and the predicted Rosetta score change for the samples in (A) and their corresponding models. SRCP161−80 (red) are highlighted. C. Overlay of the four models in (C), SRCP161−80 (red) is predicted to be highly conserved among models as a β-hairpin structure.
Figure 5:
Figure 5:. NMR analysis of SRCP161−80 is consistent with an extended β-sheet like fold.
Sequence-specific 1H chemical shift assignments were deduced from 2D NOESY and TOCSY spectra acquired at 10°C in a 5 mm sample tube at 800 MHz. A. A segment of polypeptide backbone in an extended conformation shows TOCSY (cyan shading) and NOE (black arrows) connections between HA and HN atoms. The ‘fingerprint’ region of the TOCSY spectrum containing HA-HN crosspeaks (cyan contours) is overlaid with the NOESY spectrum (black contours.) Residue assignments and sequential HA-HN NOE connections are highlighted. Throughout the peptide, the intensity of intraresidue HA-HN NOE peaks is low (black contours on top of cyan contours) in comparison to the sequential (inter-residue) HA-HN NOE peaks (black contours with no corresponding cyan contours.) B. The NH-NH region of the NOESY spectrum is plotted at the same contour level as in (A). A small number of very weak sequential NH-NH NOE peaks are visible and no strong sequential NH-NH NOEs are present.
Figure 6.
Figure 6.. Identification of features of SRCP1 peptides that are required for inhibition of Htt aggregation.
In vitro aggregation assays were performed with Htt and the indicated peptides were monitored by thioflavin-T (ThT). A, B. Peptides derived from SRPC1 that are predicted to form a β-hairpin based on the structural models shown in Figure 3 do not inhibit Htt aggregation as efficiently as SRCP161−80 at a 6:1 (peptide:Htt) ratio (A) (n=5) or a 3:1 ratio (B) (n=4). C. Residues 61–70 are the minimal region necessary for inhibition of Htt aggregation. Truncation of the SRCP161−70 peptide renders it unable to inhibit Htt aggregation in vitro at a 6:1 ratio(n=3). D. The register of the side chains of SRCP161−70 is important for function. A SRCP161−70 peptide made from D-amino acids is unable to effectively inhibit Htt aggregation (n=9). E, F. Reptation of the SRCP161−70 sequence enhances its ability to inhibit Htt aggregation at lower concentrations. Aggregation reactions were carried out with either SRCP161−70 or this sequence in tandem at a 6:1 (E) (n=3), 3:1 (F), or 1:1 ratio (G) (n=8). H, I. Stapled cyclized peptides do not increase function. SRCP161−80 or cyclic peptides have equal function compared to SRCP161–80 at a 6:1 (H) (n=3) or 3:1 (I) (n=4). *p<0.05, **p<0.01, ***p<0.001.
Figure 7.
Figure 7.. SRCP1 inhibits the secondary nucleation of Httex1Q46 aggregation.
A. Left: Aggregation of Httex1Q46 was monitored at different concentrations by ThT fluorescence. Right: Scaling of half-time with protein concentration (m0). A slope of −1.1 indicates a slight domination of secondary nucleation. B. Global fitting of data in (A) to either nucleation elongation, secondary nucleation, or fragmentation aggregation models. Dotted lines indicate aggregation profiles, solid lines indicate global fit. Fragmentation has the poorest fit. C. Mean residual errors from global fitting in (B). D. Mean residual errors from global fitting of aggregation profiles of 15μM Httex1Q46 and increasing concentrations of SRCP161–80. E. Top: Kinetic profile of 15μM Httex1Q46 and either 1:1 (15μM) or 3:1 (45μM) SRCP161−80 globally fit (solid lines) to the secondary nucleation model with (Top) both k+kn and k+k2, (Middle) only k+kn or (Bottom) only k+k2 set as free-fitting parameters. Free-fitting k+k2 led to the best fit. F. Mean residual errors from global fitting in (E).
Figure 8.
Figure 8.. SRCP161−80 suppresses aggregation of recombinant ataxin-3Q55, but not pure polyglutamine.
A, B. SRCP161−80 inhibits aggregation of ATXN3 in vitro. Aggregation assays were performed with ATXN3Q55 and SRCP161−80 at a 1:1 or 3:1 ratio (n=3) and quantified by ThT (n=3) (A). To validate the ThT results ATXN3Q55 aggregates were imaged by transmission electron microscopy with DMSO or with either 1:1 or 3:1 ratios of SRCP161−80 (peptide:ATXNQ55). Samples were incubated for 6 h at 37°C prior to negative staining (B, scale bars: 11,500x=500nm, 25,000x=200 nm). C. SRPC161−80 does not inhibit aggregation of a pure polyglutamine tract. In vitro aggregation assays were performed in the presence or absence of SRPC161−80 with Httex1Q46 (i) or a pure tract of 45 glutamines (Q45) (ii) at a 6:1 molar ratio (peptide:protein) (n=7).

Similar articles

Cited by

  • Allosteric Modulation of Pathological Ataxin-3 Aggregation: A Path to Spinocerebellar Ataxia Type-3 Therapies.
    Silva A, Duarte-Silva S, Martins PM, Rodrigues B, Serrenho D, Vilasboas-Campos D, Teixeira-Castro A, Vieyto-Nuñez J, Mieres-Perez J, Figueiredo F, Fraga J, Noble J, Lantz C, Sepanj N, Monteiro-Fernandes D, Guerreiro S, Neves-Carvalho A, Pereira-Sousa J, Klärner FG, Schrader T, Loo JA, Pastore A, Sanchez-Garcia E, Bitan G, Carvalho AL, Maciel P, Macedo-Ribeiro S. Silva A, et al. bioRxiv [Preprint]. 2025 Jan 24:2025.01.22.633970. doi: 10.1101/2025.01.22.633970. bioRxiv. 2025. PMID: 39896516 Free PMC article. Preprint.
  • Cell biology of Dictyostelium.
    Huber RJ, Steimle PA, Damer CK. Huber RJ, et al. BMC Mol Cell Biol. 2025 Aug 19;26(1):25. doi: 10.1186/s12860-025-00550-y. BMC Mol Cell Biol. 2025. PMID: 40830425 Free PMC article.

References

    1. DiFiglia M, Sapp E, Chase K, Davies S, Bates G, Vonsattel J, et al. Aggregation of huntingtin in neuronal intranuclear inclusions and dystrophic neurites in brain. Science. 1997;277:1990–3. - PubMed
    1. Li S, Li X. Aggregation of N-terminal huntingtin is dependent on the length of its glutamine repeats. Hum Mol Genet. 1998;7:777–82. - PubMed
    1. Krobitsch S, Lindquist S. Aggregation of huntingtin in yeast varies with the length of the polyglutamine expansion and the expression of chaperone proteins. PNAS. 2000;97:1589–94. - PMC - PubMed
    1. Meriin A, Zhang X, He X, Newnam G, Chernoff Y, Sherman M. Huntington toxicity in yeast model depends on polyglutamine aggregation mediated by a prion-like protein Rnq1. J Cell Biol. 2002;157:997–1004. - PMC - PubMed
    1. Santarriaga S, Petersen A, Ndukwe K, Brandt A, Gerges N, Scaglione J, et al. The Social Amoeba Dictyostelium discoideum Is Highly Resistant to Polyglutamine Aggregation. JBC. 2015;290(42):25571–8. - PMC - PubMed

Publication types