

Investigating Gene-Diet Interactions Impacting the Association Between Macronutrient Intake and Glycemic Traits
- PMID: 36791419
- PMCID: PMC10130485
- DOI: 10.2337/db22-0851
Investigating Gene-Diet Interactions Impacting the Association Between Macronutrient Intake and Glycemic Traits
Abstract
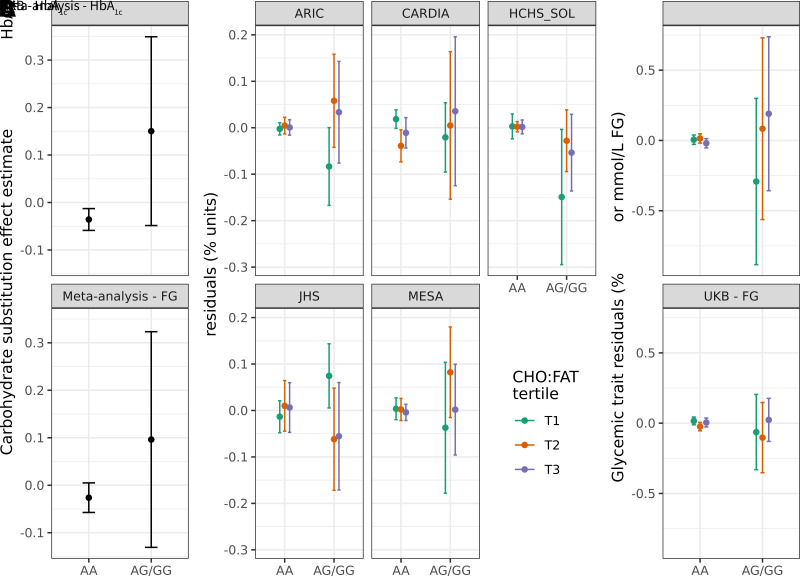
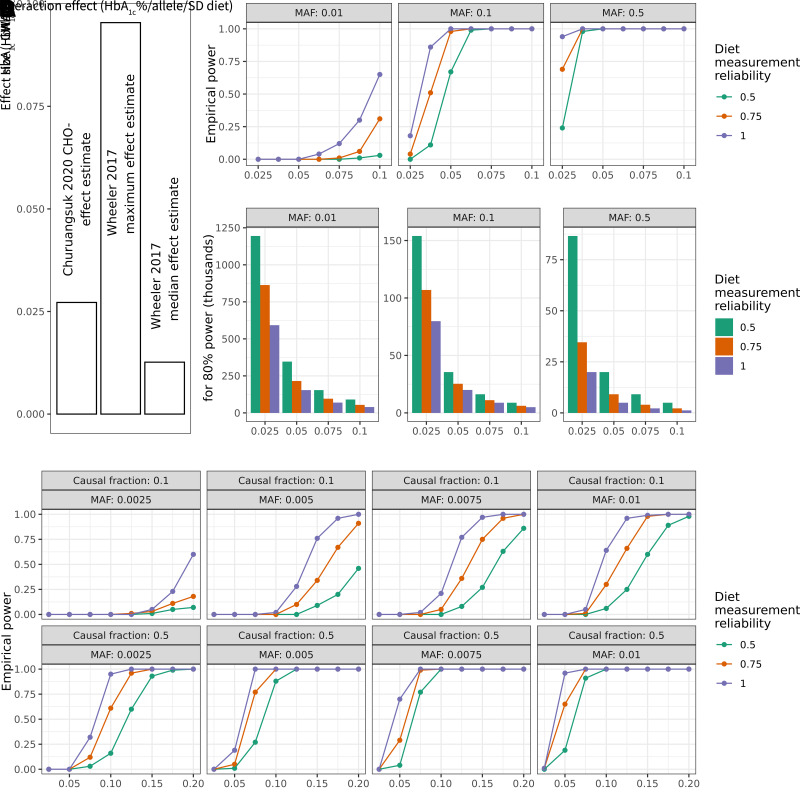
Few studies have demonstrated reproducible gene-diet interactions (GDIs) impacting metabolic disease risk factors, likely due in part to measurement error in dietary intake estimation and insufficient capture of rare genetic variation. We aimed to identify GDIs across the genetic frequency spectrum impacting the macronutrient-glycemia relationship in genetically and culturally diverse cohorts. We analyzed 33,187 participants free of diabetes from 10 National Heart, Lung, and Blood Institute Trans-Omics for Precision Medicine program cohorts with whole-genome sequencing, self-reported diet, and glycemic trait data. We fit cohort-specific, multivariable-adjusted linear mixed models for the effect of diet, modeled as an isocaloric substitution of carbohydrate for fat, and its interactions with common and rare variants genome-wide. In main effect meta-analyses, participants consuming more carbohydrate had modestly lower glycemic trait values (e.g., for glycated hemoglobin [HbA1c], -0.013% HbA1c/250 kcal substitution). In GDI meta-analyses, a common African ancestry-enriched variant (rs79762542) reached study-wide significance and replicated in the UK Biobank cohort, indicating a negative carbohydrate-HbA1c association among major allele homozygotes only. Simulations revealed that >150,000 samples may be necessary to identify similar macronutrient GDIs under realistic assumptions about effect size and measurement error. These results generate hypotheses for further exploration of modifiable metabolic disease risk in additional cohorts with African ancestry.
Article highlights: We aimed to identify genetic modifiers of the dietary macronutrient-glycemia relationship using whole-genome sequence data from 10 Trans-Omics for Precision Medicine program cohorts. Substitution models indicated a modest reduction in glycemia associated with an increase in dietary carbohydrate at the expense of fat. Genome-wide interaction analysis identified one African ancestry-enriched variant near the FRAS1 gene that may interact with macronutrient intake to influence hemoglobin A1c. Simulation-based power calculations accounting for measurement error suggested that substantially larger sample sizes may be necessary to discover further gene-macronutrient interactions.
© 2023 by the American Diabetes Association.
Conflict of interest statement
Figures
References
-
- Ajala O, English P, Pinkney J. Systematic review and meta-analysis of different dietary approaches to the management of type 2 diabetes. Am J Clin Nutr 2013;97:505–516 - PubMed
-
- Korem T, Zeevi D, Zmora N, et al. Bread affects clinical parameters and induces gut microbiome-associated personal glycemic responses. Cell Metab 2017;25:1243–1253.e5 - PubMed
Publication types
MeSH terms
Substances
Grants and funding
- U01 HL120393/HL/NHLBI NIH HHS/United States
- N01 HC095167/HL/NHLBI NIH HHS/United States
- HHSN268201800015I/HB/NHLBI NIH HHS/United States
- N01 HC085081/HL/NHLBI NIH HHS/United States
- R01 HL071025/HL/NHLBI NIH HHS/United States
- OT3 HL142478/HL/NHLBI NIH HHS/United States
- R01 HL112064/HL/NHLBI NIH HHS/United States
- 75N92020D00002/HL/NHLBI NIH HHS/United States
- N01 HC085080/HL/NHLBI NIH HHS/United States
- 75N92021D00002/HL/NHLBI NIH HHS/United States
- HHSN268201500003C/HL/NHLBI NIH HHS/United States
- HHSN268201800012I/HB/NHLBI NIH HHS/United States
- HHSN268201800012C/HL/NHLBI NIH HHS/United States
- N01 HC095161/HL/NHLBI NIH HHS/United States
- 75N92020D00005/HL/NHLBI NIH HHS/United States
- R01 HL104135/HL/NHLBI NIH HHS/United States
- N01 HC095168/HL/NHLBI NIH HHS/United States
- R01 HL120393/HL/NHLBI NIH HHS/United States
- R01 HL087698/HL/NHLBI NIH HHS/United States
- U54 HG003067/HG/NHGRI NIH HHS/United States
- T32 DK007028/DK/NIDDK NIH HHS/United States
- 75N92021D00005/WH/WHI NIH HHS/United States
- R01 NR008153/NR/NINR NIH HHS/United States
- K01 DK133637/DK/NIDDK NIH HHS/United States
- U01 HL080295/HL/NHLBI NIH HHS/United States
- HHSN268201800004I/HL/NHLBI NIH HHS/United States
- 75N92022D00002/HL/NHLBI NIH HHS/United States
- HHSN268201500001C/HL/NHLBI NIH HHS/United States
- UL1 TR001079/TR/NCATS NIH HHS/United States
- N01 HC095169/HL/NHLBI NIH HHS/United States
- N01 HC085082/HL/NHLBI NIH HHS/United States
- HHSN268201800014I/HB/NHLBI NIH HHS/United States
- N01 HC065233/HL/NHLBI NIH HHS/United States
- R01 HL092577/HL/NHLBI NIH HHS/United States
- N01 HC065236/HL/NHLBI NIH HHS/United States
- U01 HL130114/HL/NHLBI NIH HHS/United States
- N01 HC065235/HL/NHLBI NIH HHS/United States
- HHSN268200800007C/HL/NHLBI NIH HHS/United States
- N01 HC085086/HL/NHLBI NIH HHS/United States
- 75N92020D00001/HL/NHLBI NIH HHS/United States
- N01 HC085083/HL/NHLBI NIH HHS/United States
- K23 HL105897/HL/NHLBI NIH HHS/United States
- OT3 HL142481/HL/NHLBI NIH HHS/United States
- U54 HG003273/HG/NHGRI NIH HHS/United States
- HHSN268201800014C/HL/NHLBI NIH HHS/United States
- N01 HC095159/HL/NHLBI NIH HHS/United States
- OT3 HL147154/HL/NHLBI NIH HHS/United States
- 75N92020D00003/HL/NHLBI NIH HHS/United States
- R01 HL105756/HL/NHLBI NIH HHS/United States
- 75N92021D00001/HL/NHLBI NIH HHS/United States
- 75N92022D00004/HL/NHLBI NIH HHS/United States
- HHSN268201800003I/HL/NHLBI NIH HHS/United States
- P30 DK063491/DK/NIDDK NIH HHS/United States
- P30 DK111022/DK/NIDDK NIH HHS/United States
- U01 HL072524/HL/NHLBI NIH HHS/United States
- R01 HL146860/HL/NHLBI NIH HHS/United States
- HHSN268201800007I/HL/NHLBI NIH HHS/United States
- N01 HC065234/HL/NHLBI NIH HHS/United States
- HHSN268201800001C/HL/NHLBI NIH HHS/United States
- N01 HC025195/HL/NHLBI NIH HHS/United States
- HHSN268201800013I/MD/NIMHD NIH HHS/United States
- HHSN268201200036C/HL/NHLBI NIH HHS/United States
- P30 ES030285/ES/NIEHS NIH HHS/United States
- HHSN268201500015C/HL/NHLBI NIH HHS/United States
- N01 HC055222/HL/NHLBI NIH HHS/United States
- K24 HL148521/HL/NHLBI NIH HHS/United States
- HHSN268201500001I/HL/NHLBI NIH HHS/United States
- 75N92021D00003/WH/WHI NIH HHS/United States
- M01 RR000052/RR/NCRR NIH HHS/United States
- RC1 HL099747/HL/NHLBI NIH HHS/United States
- N01 HC085079/HL/NHLBI NIH HHS/United States
- UL1 TR001420/TR/NCATS NIH HHS/United States
- R01 HL049762/HL/NHLBI NIH HHS/United States
- 75N92020D00004/HL/NHLBI NIH HHS/United States
- OT3 HL142480/HL/NHLBI NIH HHS/United States
- 75N92020D00007/HL/NHLBI NIH HHS/United States
- U01 HL072518/HL/NHLBI NIH HHS/United States
- N01 HC095163/HL/NHLBI NIH HHS/United States
- HHSN268201800011C/HL/NHLBI NIH HHS/United States
- R01 HL145025/HL/NHLBI NIH HHS/United States
- KL2 TR002490/TR/NCATS NIH HHS/United States
- 75N92022D00003/HL/NHLBI NIH HHS/United States
- HHSN268201500003I/HL/NHLBI NIH HHS/United States
- 75N92021D00006/HL/NHLBI NIH HHS/United States
- 75N92022D00005/HL/NHLBI NIH HHS/United States
- R01 HL059684/HL/NHLBI NIH HHS/United States
- 75N92019D00031/HL/NHLBI NIH HHS/United States
- OT3 HL142479/HL/NHLBI NIH HHS/United States
- UL1 TR000040/TR/NCATS NIH HHS/United States
- N01 HC095166/HL/NHLBI NIH HHS/United States
- R01 HL151855/HL/NHLBI NIH HHS/United States
- HHSN268201800010I/HB/NHLBI NIH HHS/United States
- UM1 HG008898/HG/NHGRI NIH HHS/United States
- 75N92020D00006/HL/NHLBI NIH HHS/United States
- R01 HL092165/HL/NHLBI NIH HHS/United States
- R01 AG023629/AG/NIA NIH HHS/United States
- R01 HL117626/HL/NHLBI NIH HHS/United States
- N01 HC095162/HL/NHLBI NIH HHS/United States
- HHSN268201800011I/HB/NHLBI NIH HHS/United States
- HHSN268201800005I/HL/NHLBI NIH HHS/United States
- U24 HG008956/HG/NHGRI NIH HHS/United States
- N01 HC095165/HL/NHLBI NIH HHS/United States
- N01 HC095164/HL/NHLBI NIH HHS/United States
- R01 NS062059/NS/NINDS NIH HHS/United States
- UL1 TR001881/TR/NCATS NIH HHS/United States
- N01 HC065237/HL/NHLBI NIH HHS/United States
- 75N92022D00001/HL/NHLBI NIH HHS/United States
- HHSN268201800006I/HL/NHLBI NIH HHS/United States
- 75N92021D00004/WH/WHI NIH HHS/United States
- UL1 TR001430/TR/NCATS NIH HHS/United States
- N01 HC095160/HL/NHLBI NIH HHS/United States
