. 2023 Jun:235:105398.
doi: 10.1016/j.cognition.2023.105398. Epub 2023 Feb 13.

Children perceive illusory faces in objects as male more often than female

Affiliations

Children perceive illusory faces in objects as male more often than female

Susan G Wardle et al. Cognition. 2023 Jun.

Abstract

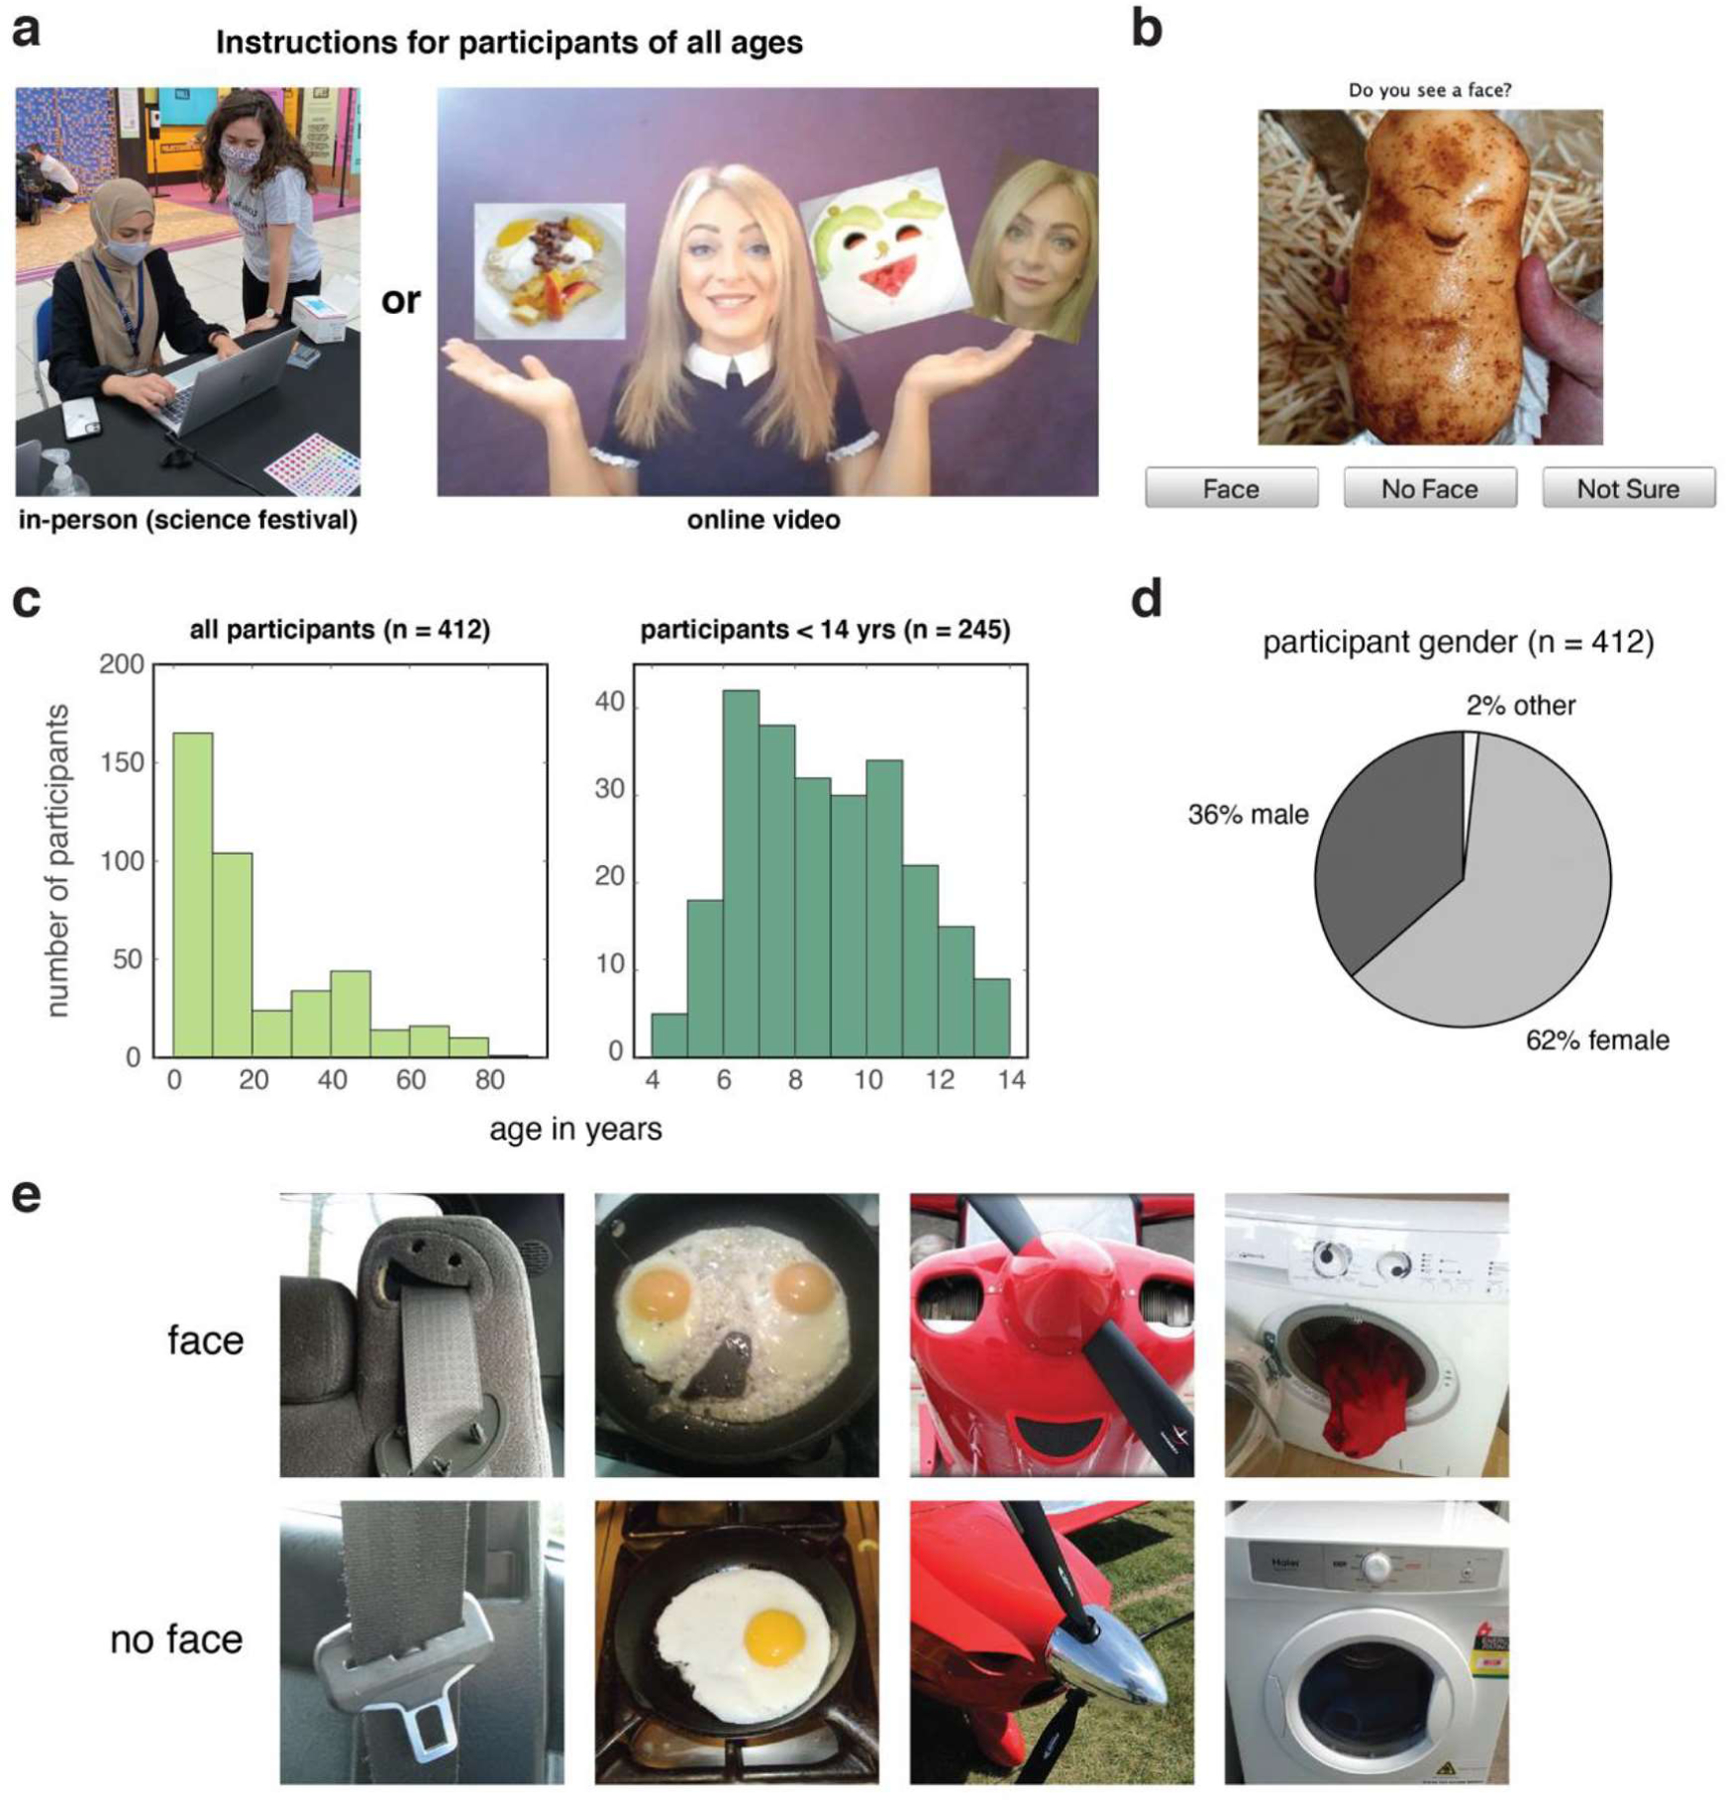
Face pareidolia is the experience of seeing illusory faces in inanimate objects. While children experience face pareidolia, it is unknown whether they perceive gender in illusory faces, as their face evaluation system is still developing in the first decade of life. In a sample of 412 children and adults from 4 to 80 years of age we found that like adults, children perceived many illusory faces in objects to have a gender and had a strong bias to see them as male rather than female, regardless of their own gender identification. These results provide evidence that the male bias for face pareidolia emerges early in life, even before the ability to discriminate gender from facial cues alone is fully developed. Further, the existence of a male bias in children suggests that any social context that elicits the cognitive bias to see faces as male has remained relatively consistent across generations.

Keywords: Childhood development; Face pareidolia; Face perception; Gender; Male bias; Social perception.


Figures

Figure 1.
Figure 1.
Experimental design and participant demographics. (a) Participants completed the experiment on a computer either in person at a science festival (photo of the setup is shown on the left) or online (a still frame from the instructional video is shown on the right). (b) Example screenshot for the “Do you see a face?” question. (c) Histograms of the distribution of all participant ages (left) and the distribution of participants aged under 14 years (right). (d) Pie chart shows the distribution of participants’ self-reported gender across all ages. (e) Visual stimuli were 160 photographs of illusory faces in objects (top row), with 32 nonface objects matched to a subset of the illusory faces (bottom row) and 22 photographs of human faces (not shown) as control stimuli.
Figure 2.
Figure 2.
Face ratings for pareidolia images as a function of age. (a) Mean proportion of “face” ratings given by participants of different ages for illusory faces images (n=20 images per participant), human faces (n=2 images per participant) and nonface objects matched to the pareidolia images (n=4 images per participant). Error bars show +/− 1 standard error of the mean. (b) Illusory face images with the lowest and highest proportions of “face” responses as a function of participant age group. For all age groups, multiple images scored the highest rating (proportion = 1.0), so an example image is shown for each group. The proportion of “face” ratings given to each image is shown underneath (relative to “no face” and “not sure” responses). (c) Histograms of the proportion of face responses given to each of the 160 pareidolia images as a function of participant age. Pie chart insets show the total distribution of responses (face, no face, not sure) given to the 160 pareidolia images across all trials and participants as a function of participant age. Each participant rated a subset of 20 images from a total of 160 pareidolia images.
Figure 3.
Figure 3.
Gender ratings for pareidolia images. (a) Histograms of the mean gender rating per illusory face image (N = 160) by age group. All male ratings were scored as +1, female ratings as −1, and “not sure” responses were excluded. (b) Pie charts show the total proportion of gender ratings of each category (male, female, not sure) made by each age group across all 160 illusory face images. (c) The six images with the largest mean gender rating < 0 (i.e. rated as most “female” across all participants). (d) The six images with the largest mean gender rating > 0 (i.e. rated as most “male” across all participants).
Figure 4.
Figure 4.
Gender ratings for illusory face images by participant. (a) The distribution of female (orange) and male (blue) responses given by each participant (rows) for the illusory face images. Each participant rated a random subset of 20 images from a total of 160 images. The distribution is sorted by the sum of the male and female ratings given by each participant, such that participants with the lowest number of “not sure” ratings are at the top. Inset numbers are the total number of female and male ratings given by all participants in that age group across all illusory face images. Dashed lines indicate the number of participants in each age group, to mark the difference in sample size between groups. (b) Pie charts show the percentage of participants by age group that had a greater number of male or female responses, or an equal number of male and female responses (“no bias”) for the 20 illusory face images that they rated.
Figure 5.
Figure 5.
Gender ratings for pareidolia images as a function of participant gender (left) and experimental modality (right). Each participant rated the gender of a subset of 20 illusory face images from a total of 160 images. (a) The mean proportion of male and female responses for illusory faces by participant age and gender. (b) The mean proportion of male and female responses for illusory faces by participant age and experimental modality (in-person or online). Error bars represent +/− 1 SEM.

References

    1. Cassia VM, Turati C & Simion F Can a nonspecific bias toward top-heavy patterns explain newborns’ face preference? Psychol. Sci 15, 379–383 (2004). - PubMed
    1. Farroni T et al. Newborns’ preference for face-relevant stimuli: effects of contrast polarity. Proc. Natl. Acad. Sci. USA 102, 17245–17250 (2005). - PMC - PubMed
    1. Johnson MH, Dziurawiec S, Ellis H & Morton J Newborns’ preferential tracking of face-like stimuli and its subsequent decline. Cognition 40, 1–19 (1991). - PubMed
    1. Goren CC, Sarty M & Wu PY Visual following and pattern discrimination of face-like stimuli by newborn infants. Pediatrics 56, 544–549 (1975). - PubMed
    1. Simion F, Valenza E, Umiltà C & Dalla Barba B Preferential orienting to faces in newborns: a temporal-nasal asymmetry. J. Exp. Psychol. Hum. Percept. Perform 24, 1399–1405 (1998). - PubMed

Publication types

LinkOut - more resources