. 2023 May 9;56(5):1027-1045.e8.
doi: 10.1016/j.immuni.2023.01.028. Epub 2023 Feb 14.

A Cre-deleter specific for embryo-derived brain macrophages reveals distinct features of microglia and border macrophages

Affiliations

A Cre-deleter specific for embryo-derived brain macrophages reveals distinct features of microglia and border macrophages

Simone Brioschi et al. Immunity. .

Abstract

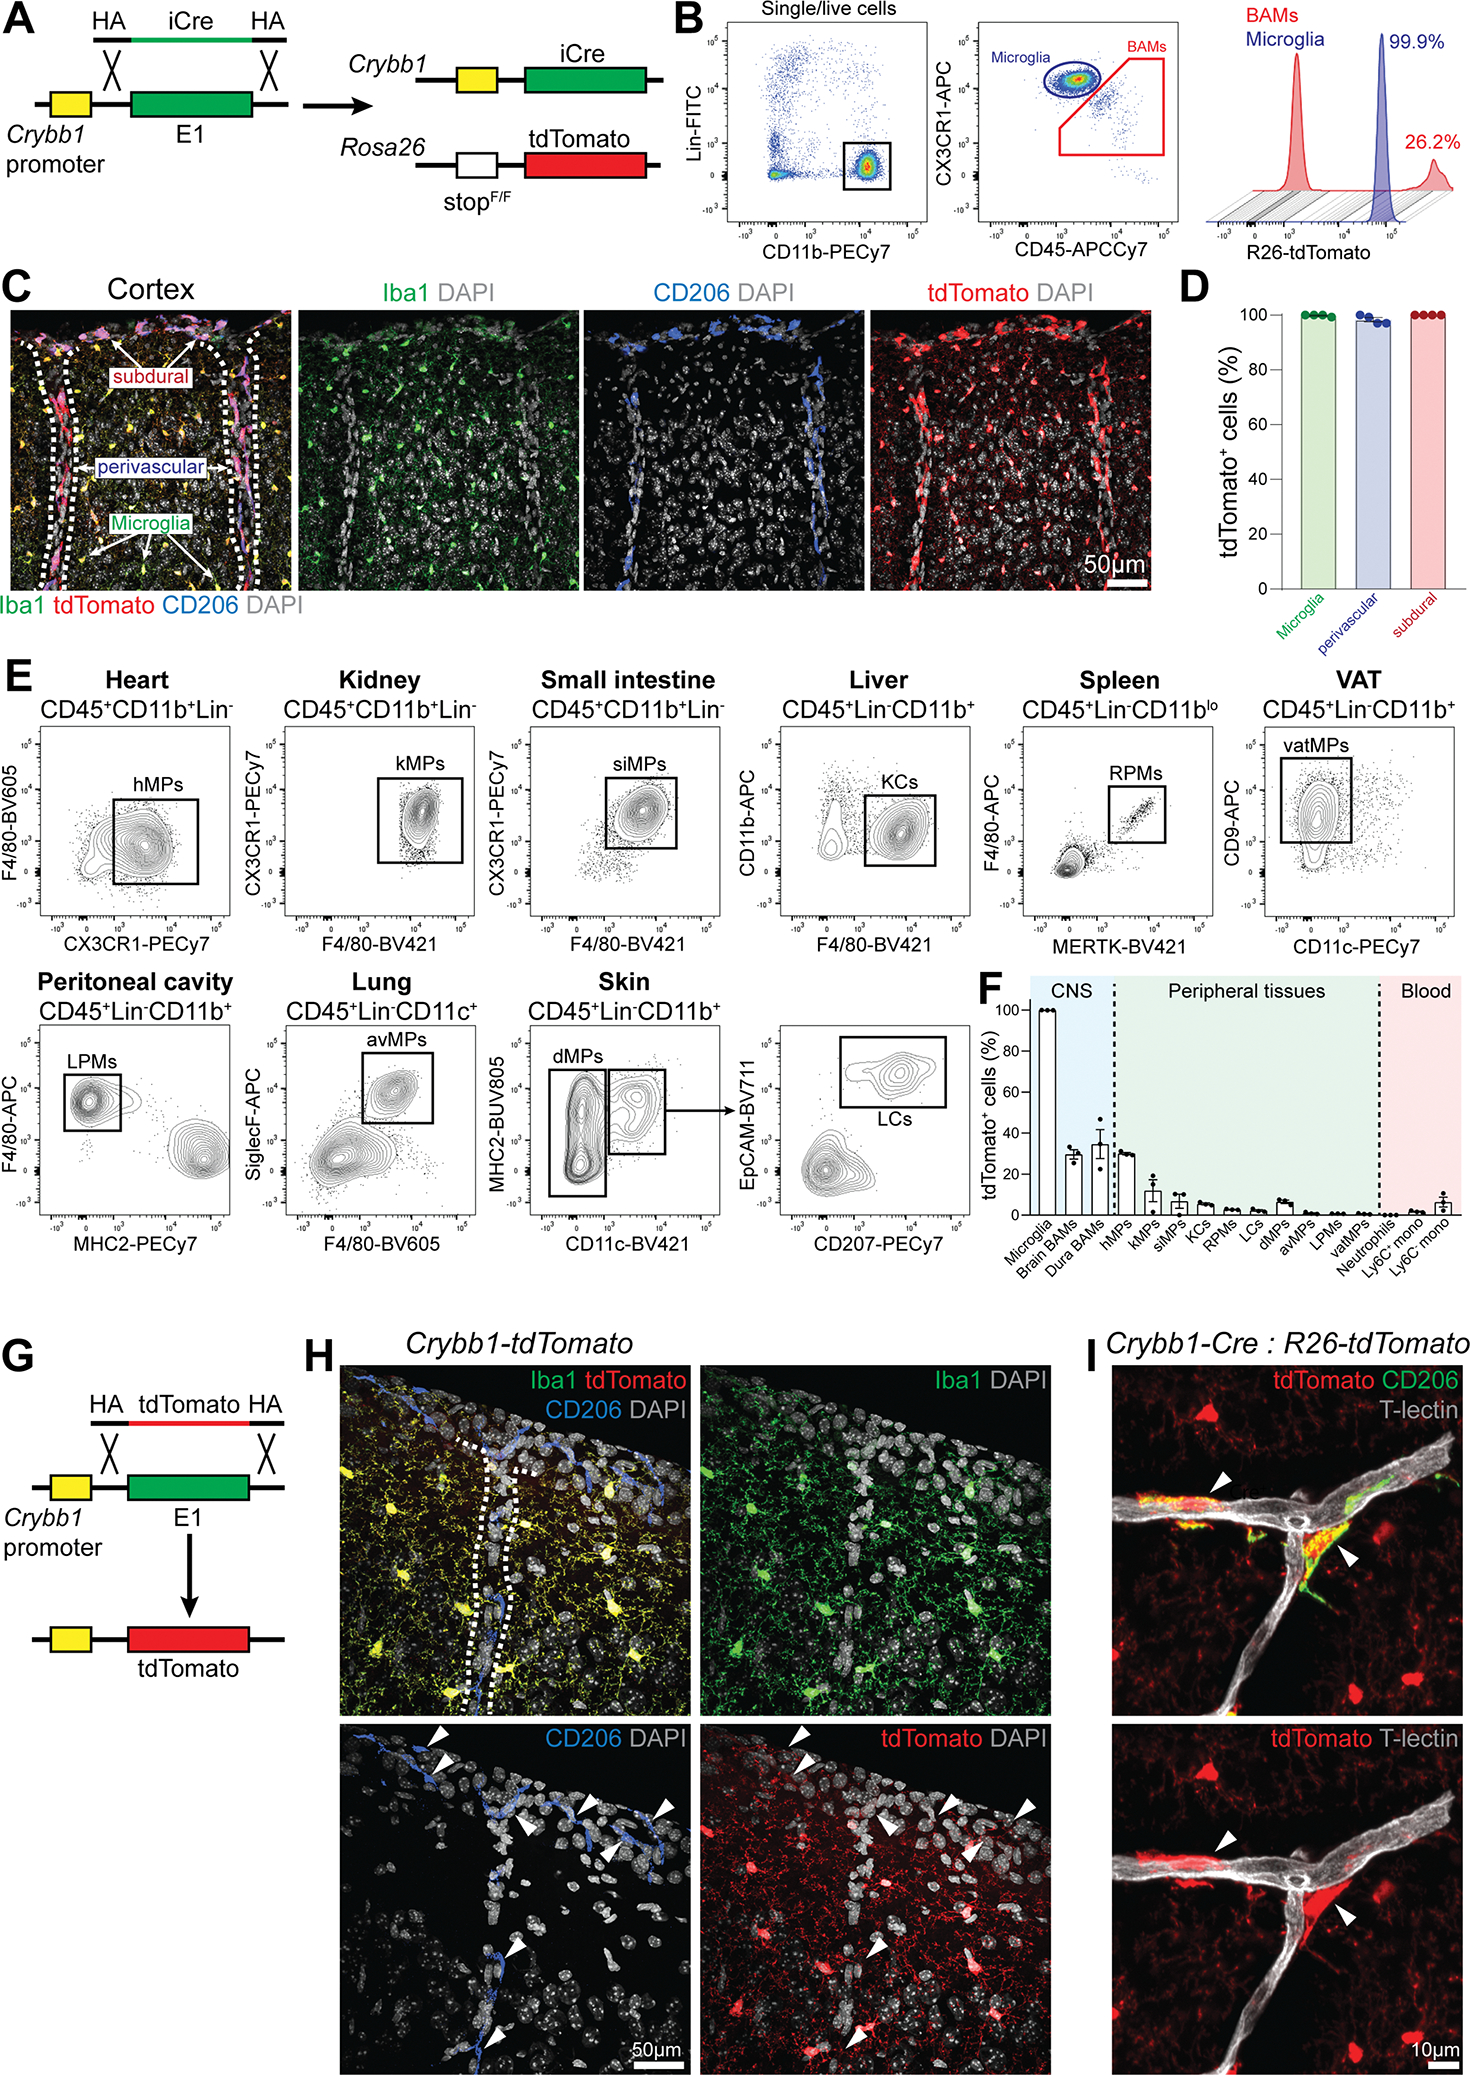
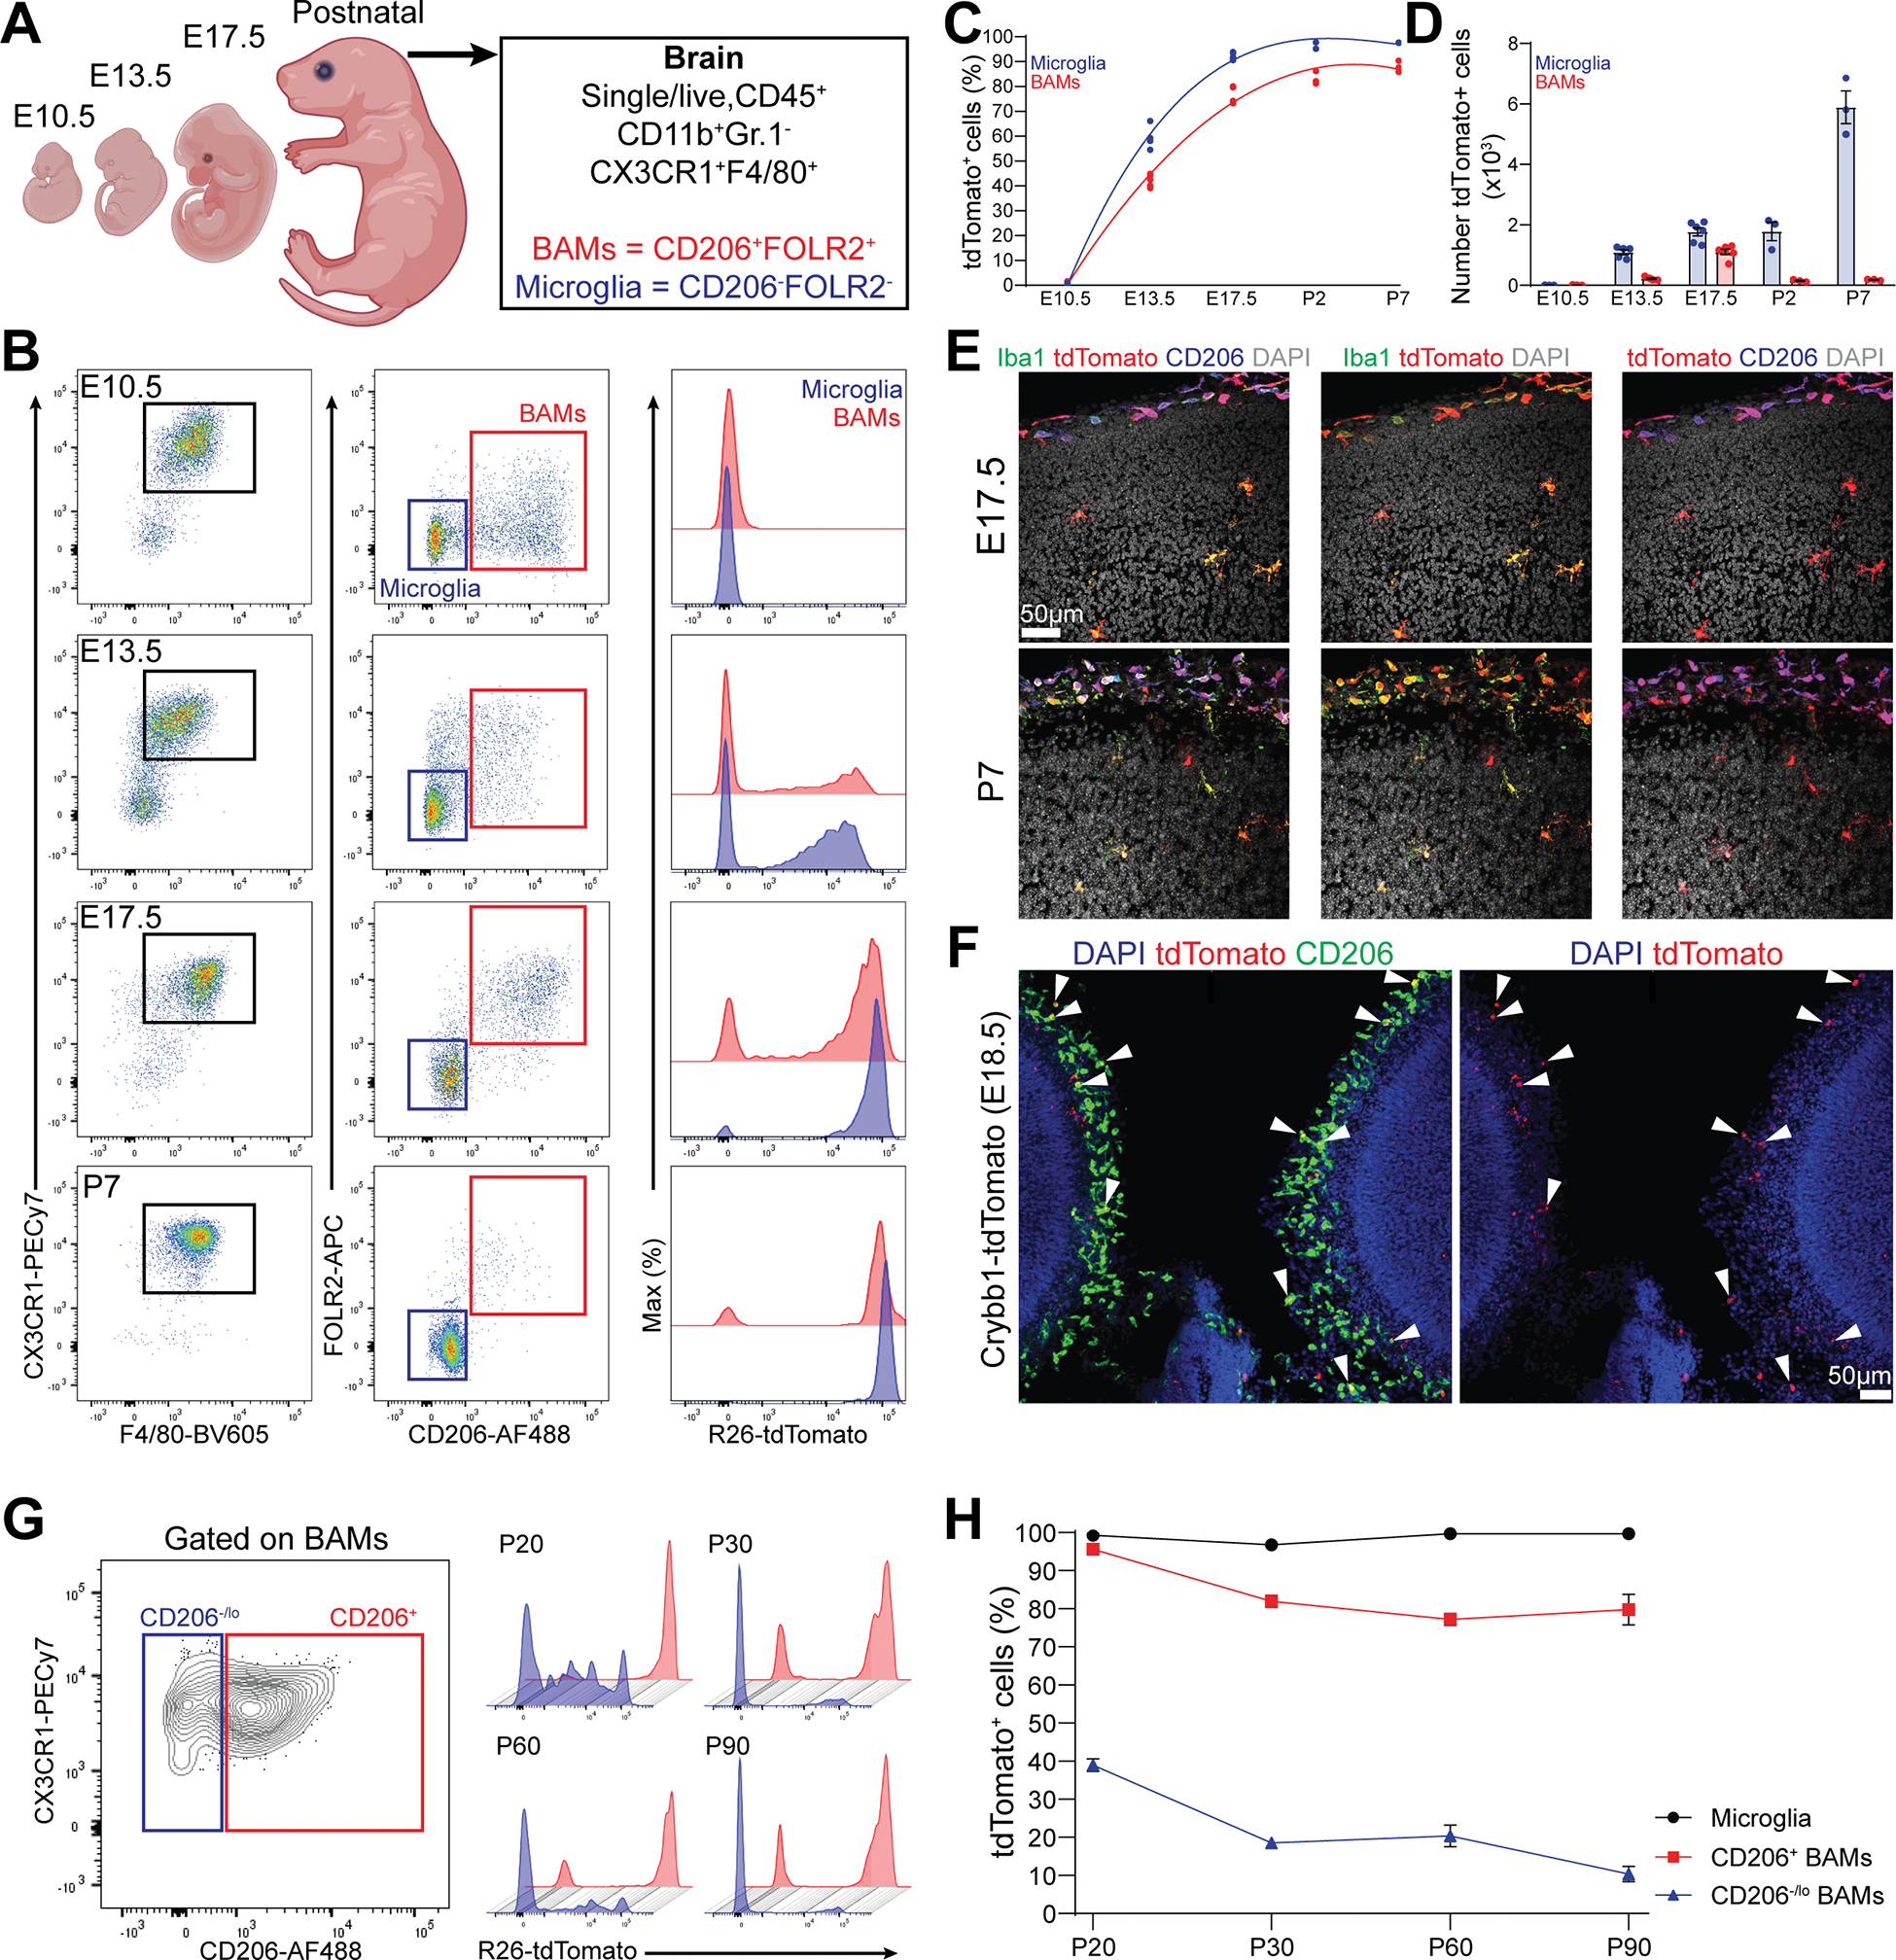
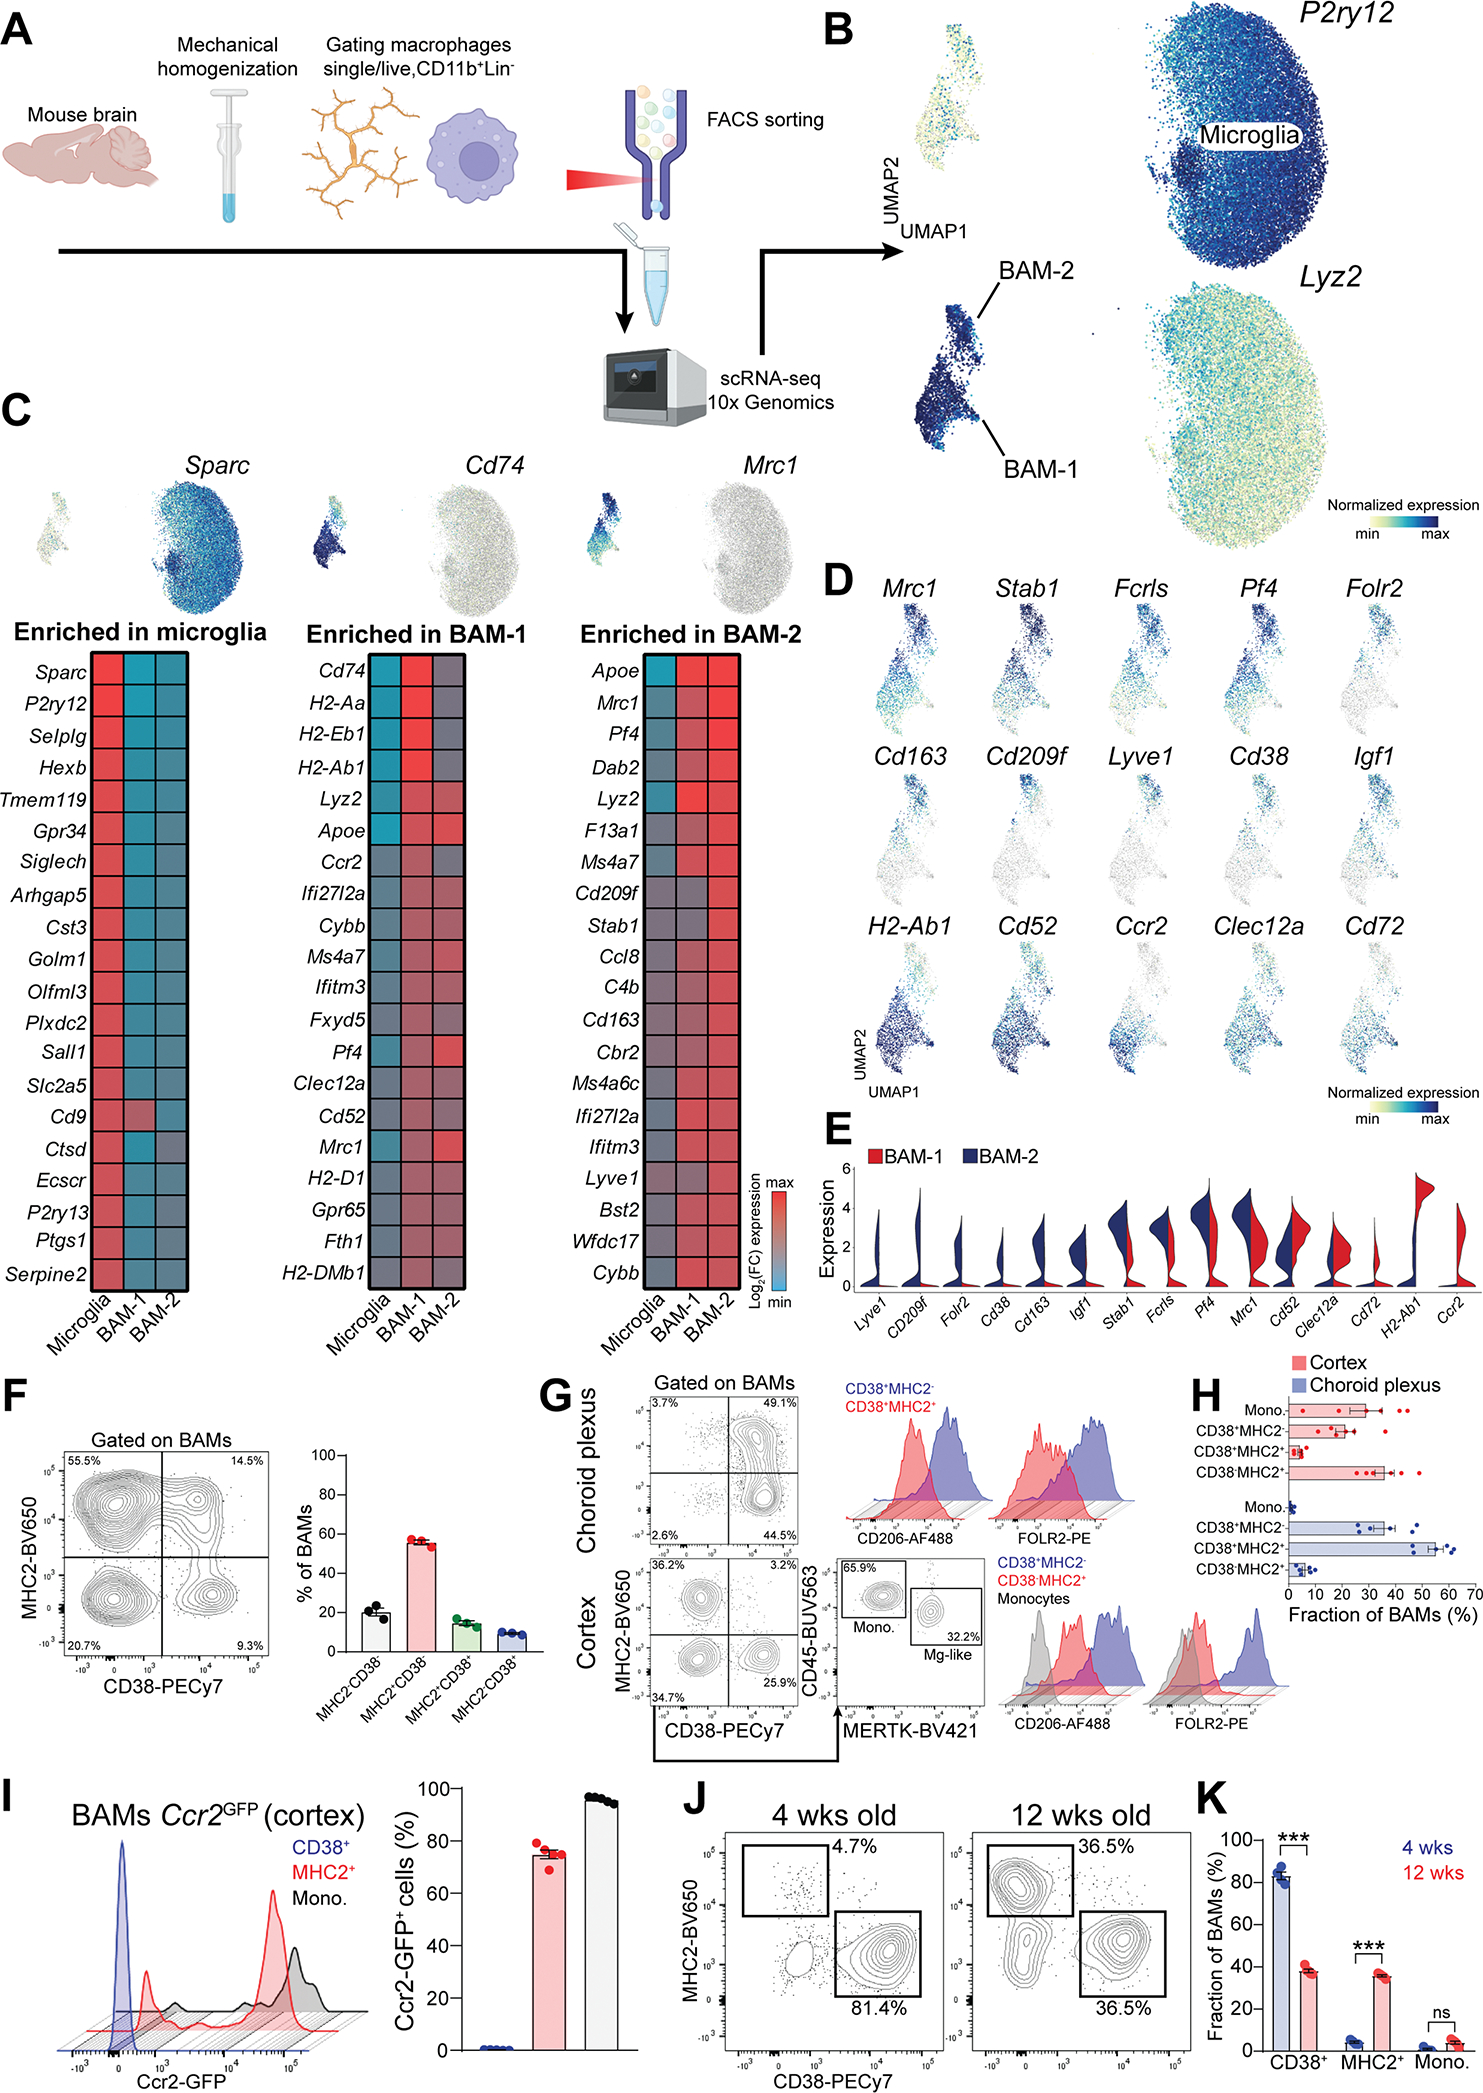
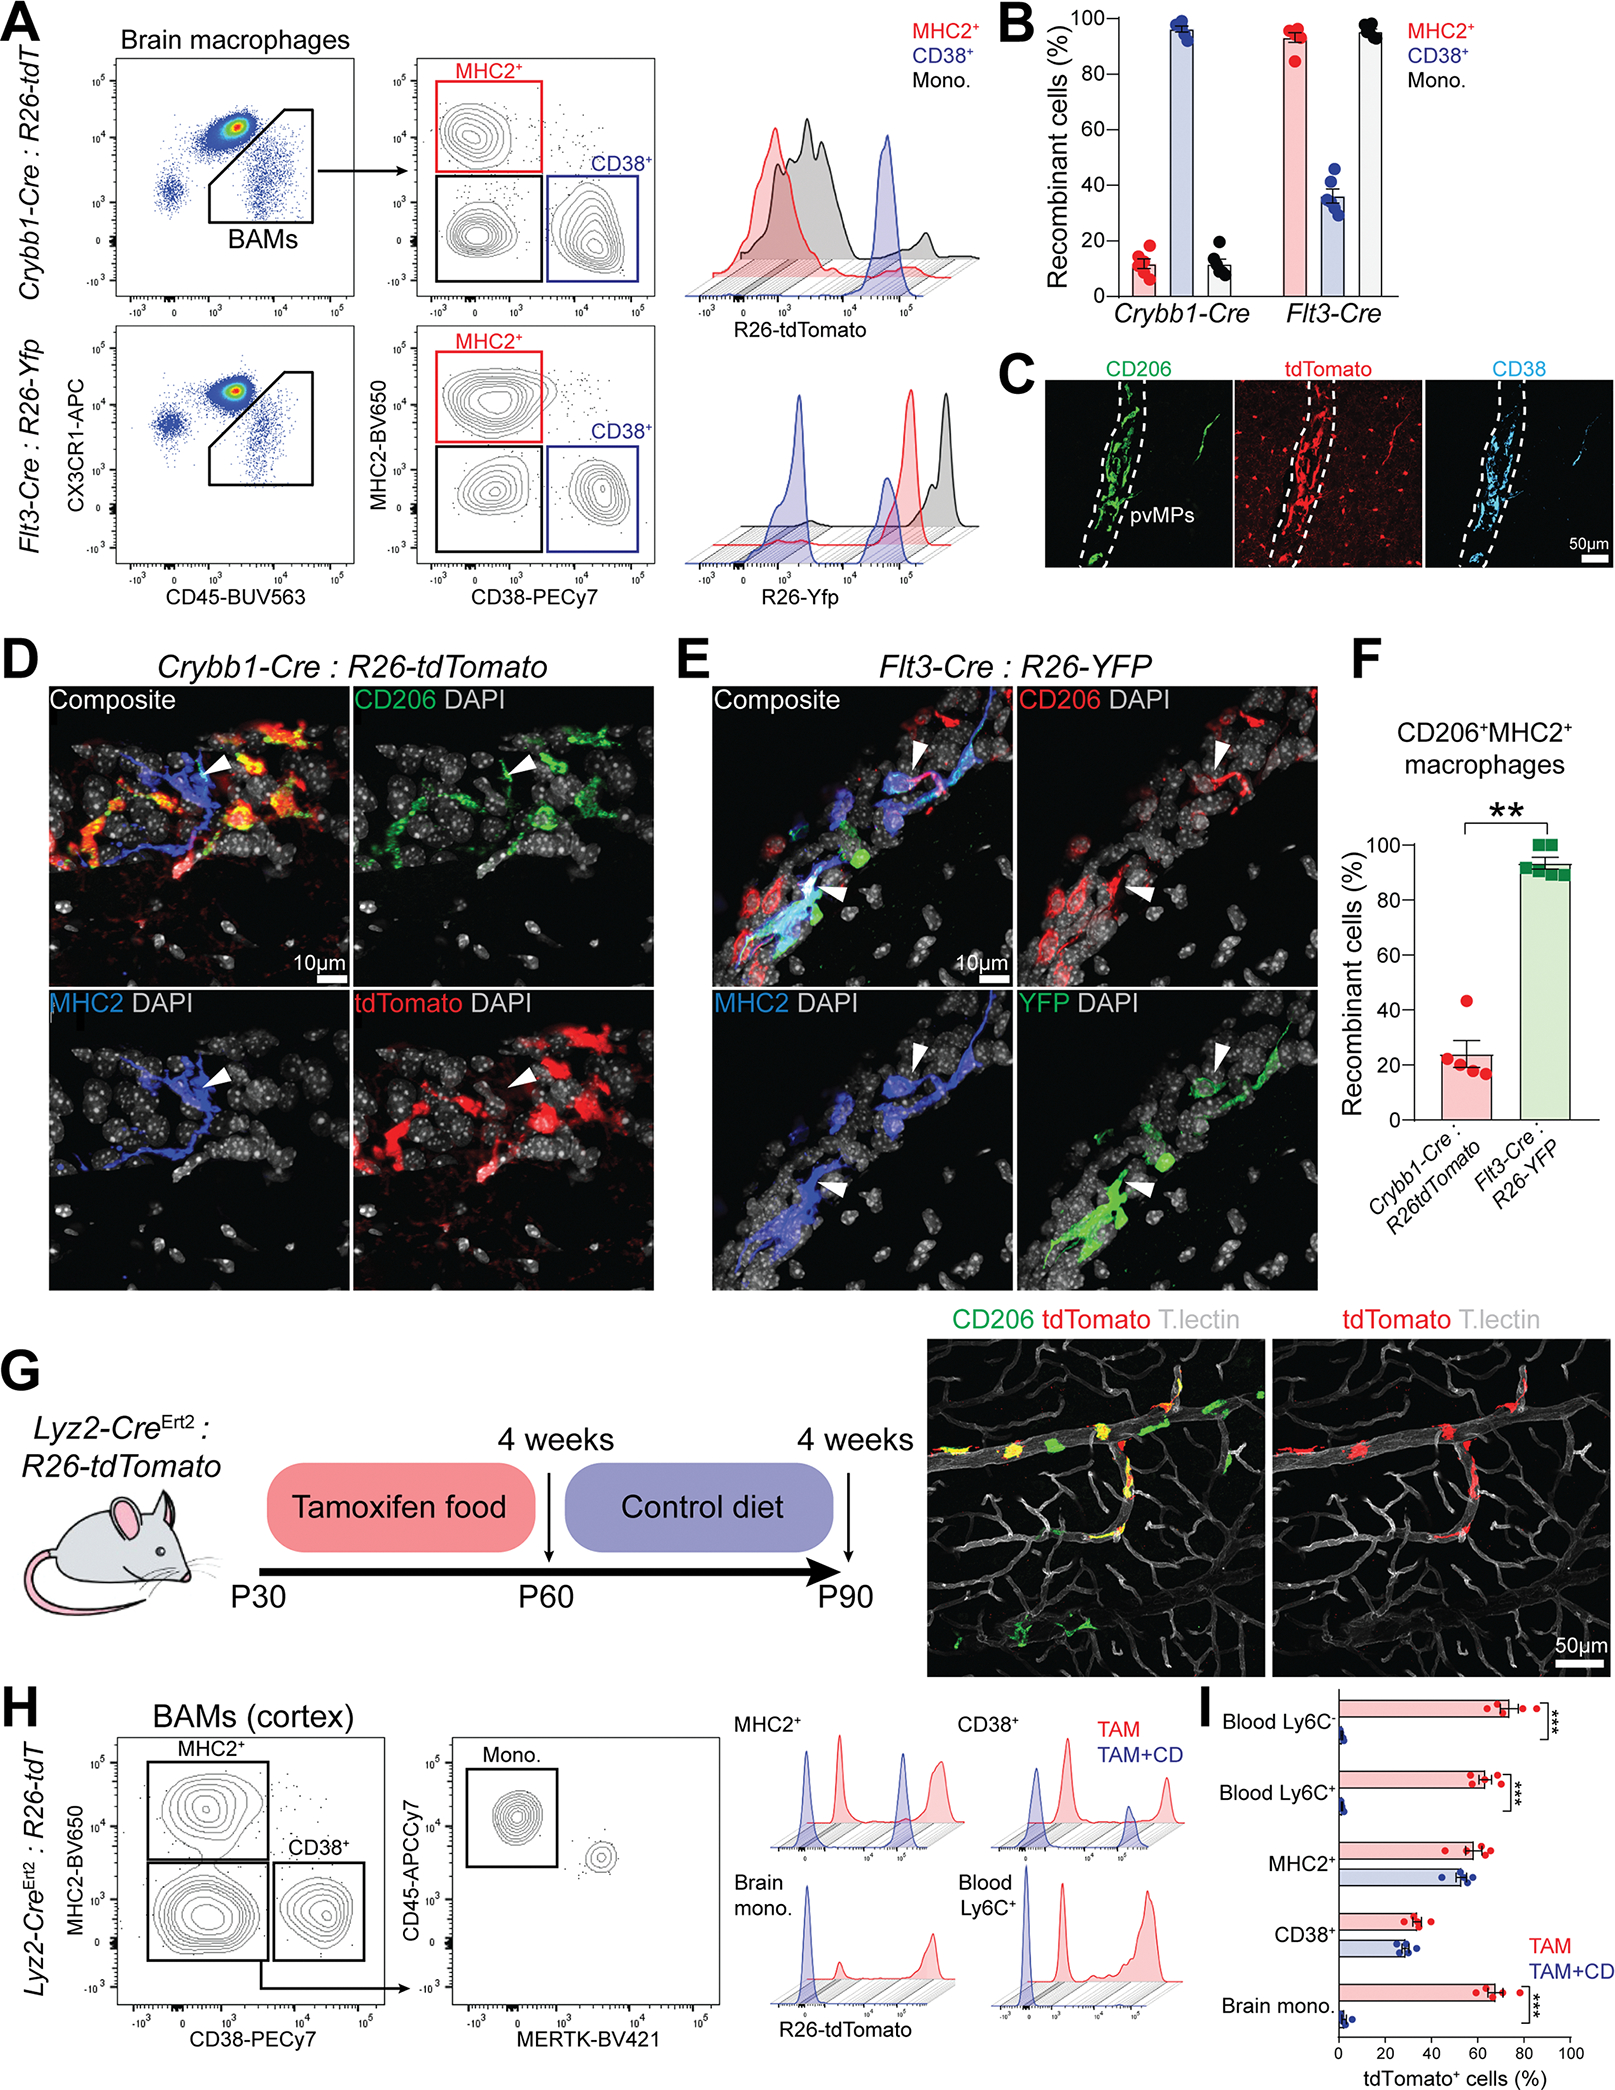
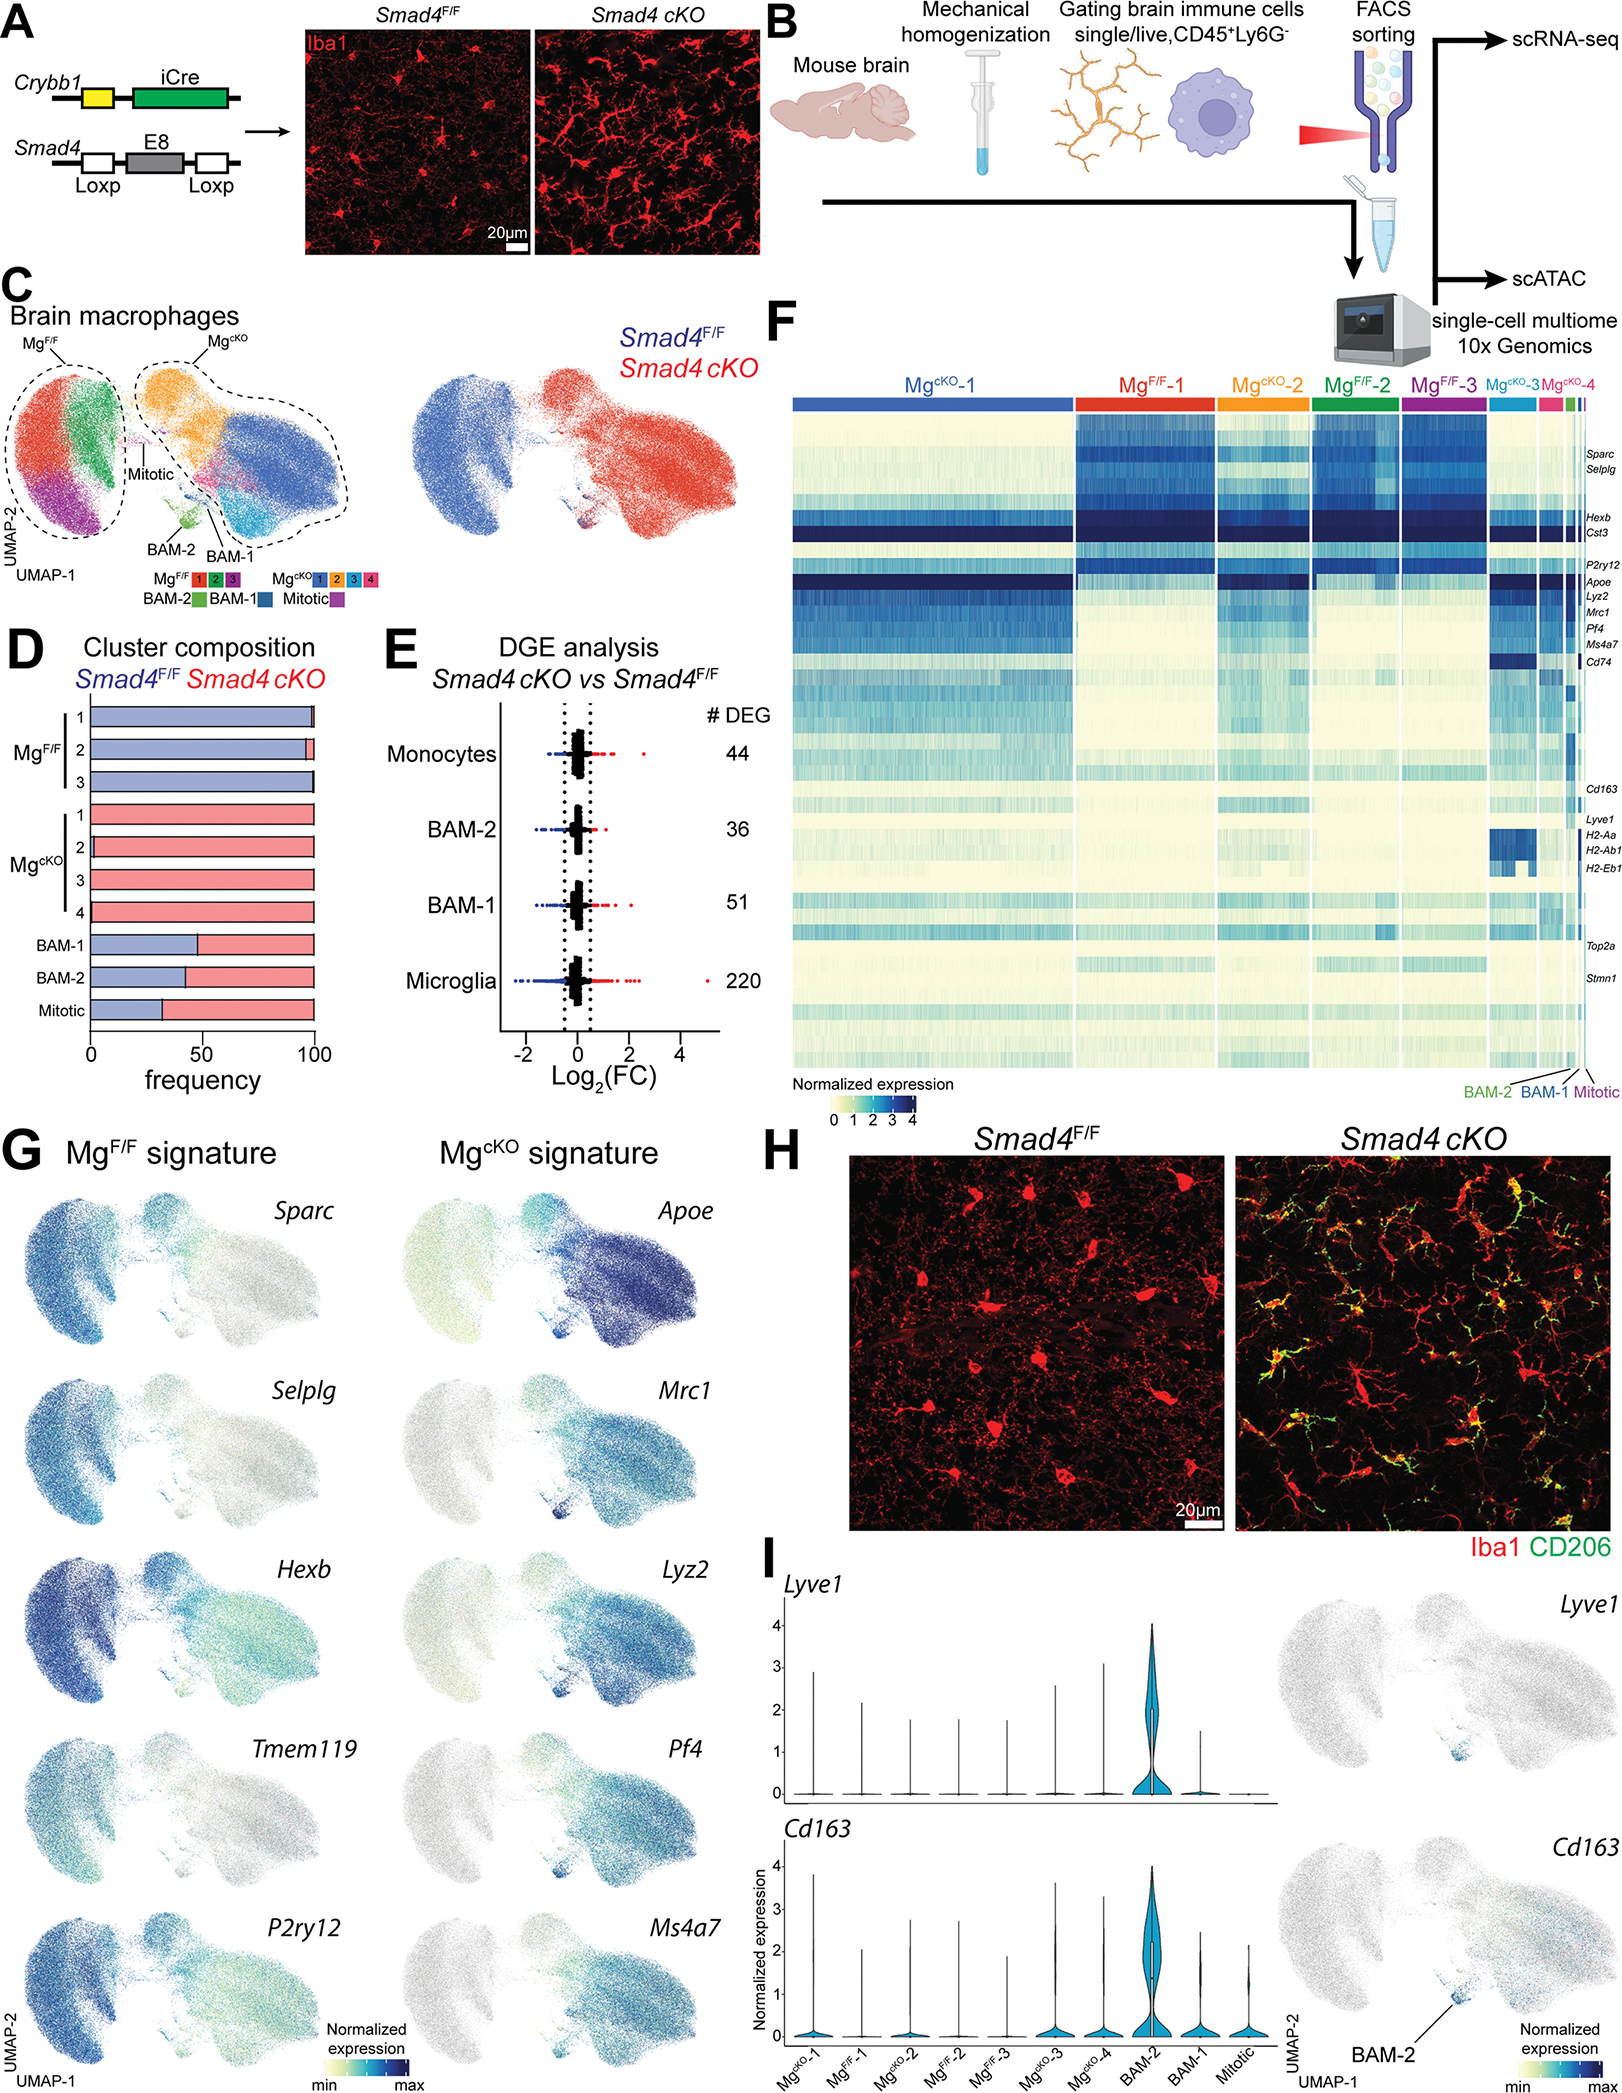
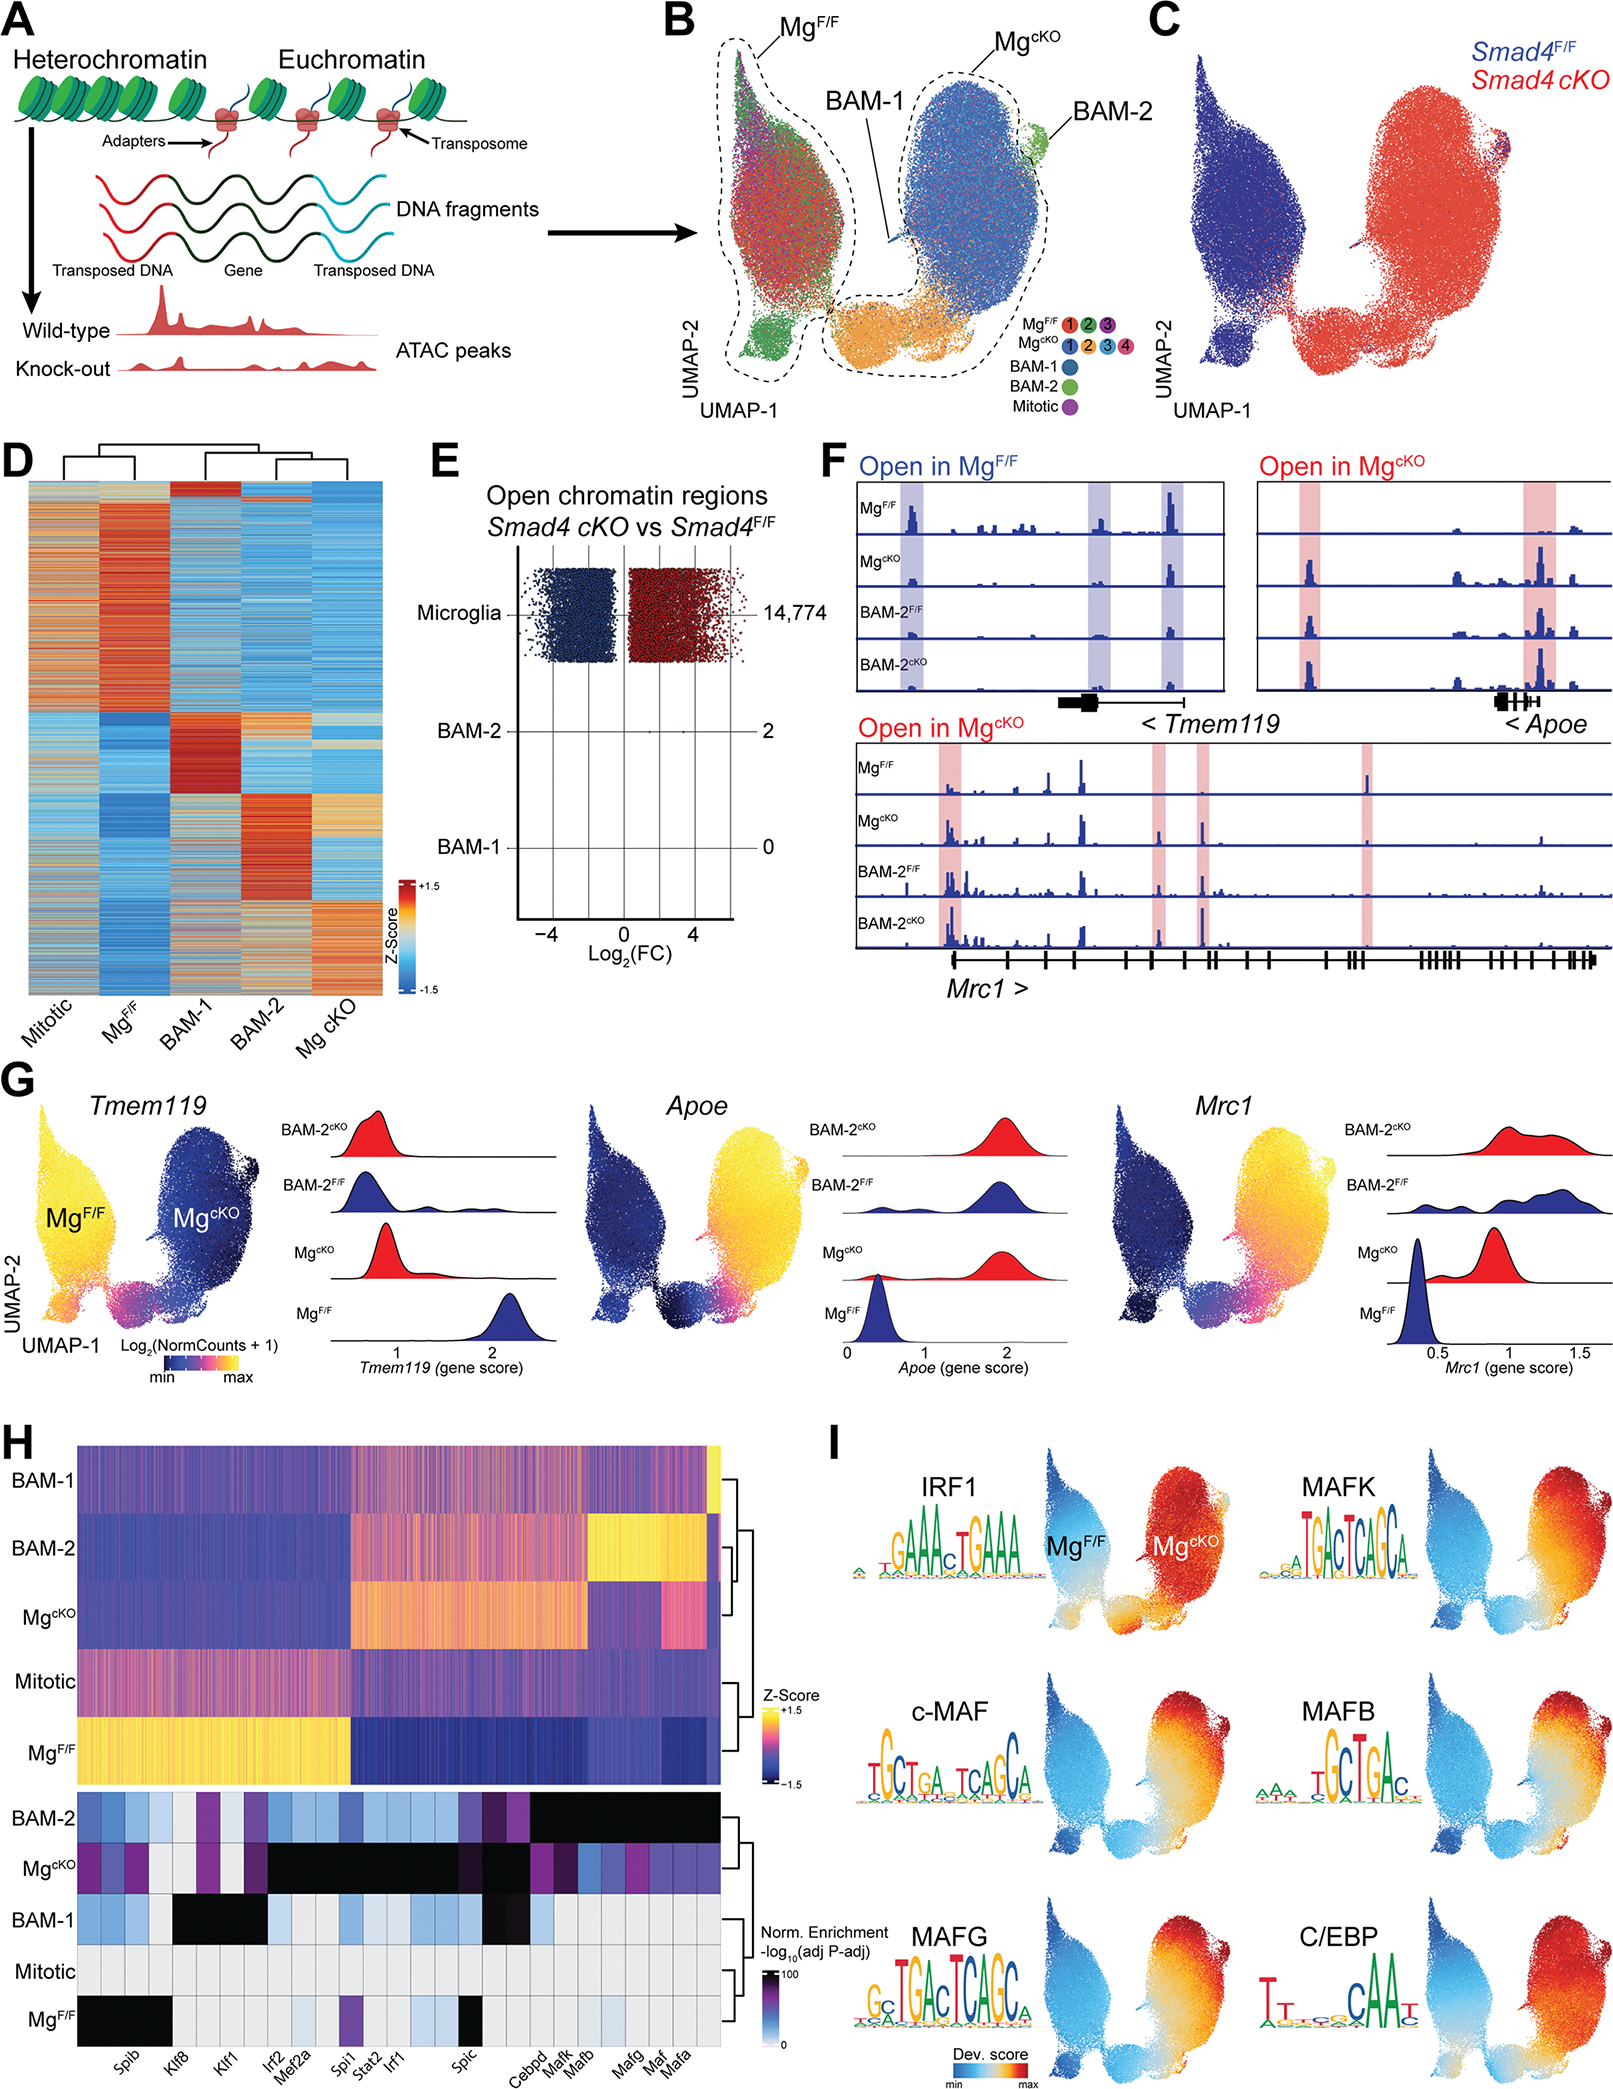
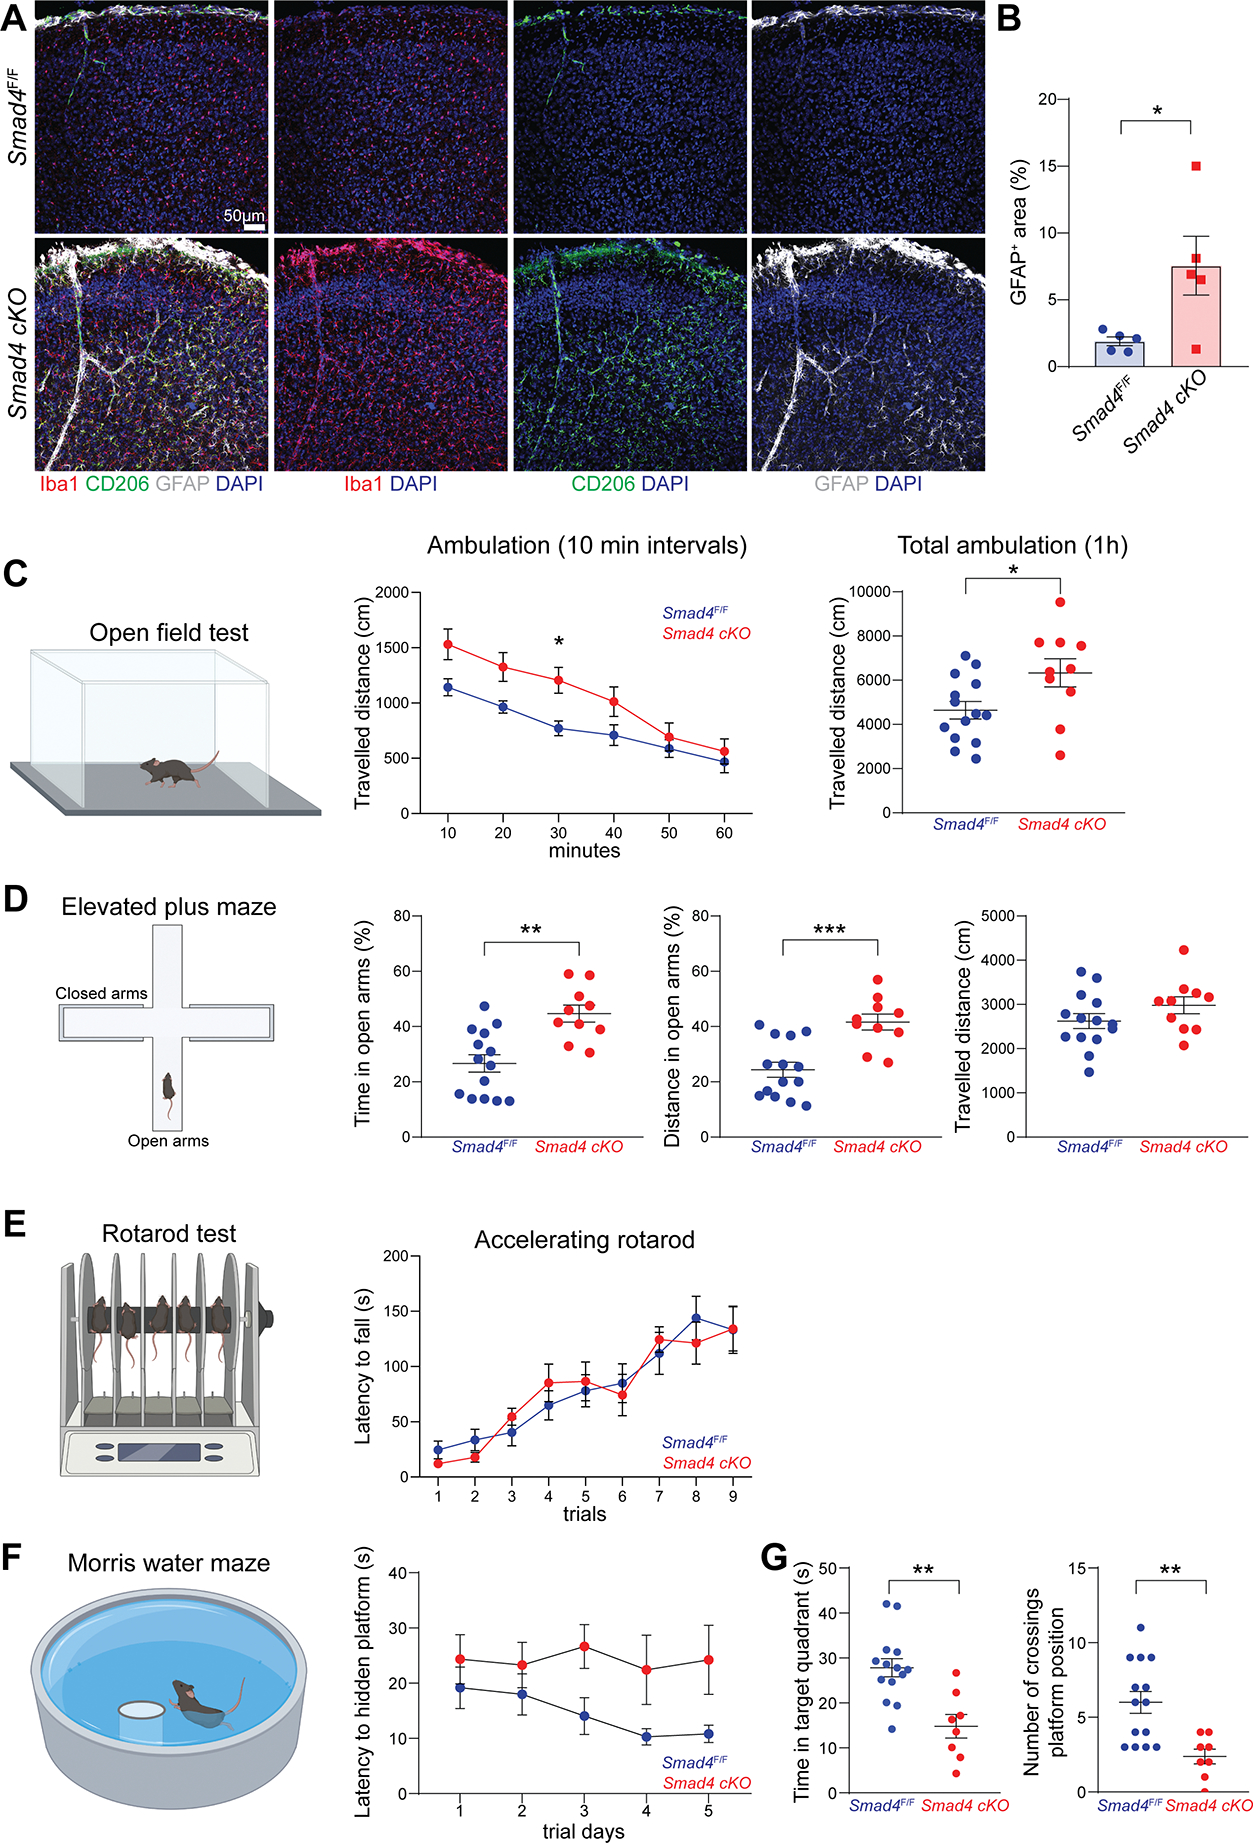
Genetic tools to target microglia specifically and efficiently from the early stages of embryonic development are lacking. We generated a constitutive Cre line controlled by the microglia signature gene Crybb1 that produced nearly complete recombination in embryonic brain macrophages (microglia and border-associated macrophages [BAMs]) by the perinatal period, with limited recombination in peripheral myeloid cells. Using this tool in combination with Flt3-Cre lineage tracer, single-cell RNA-sequencing analysis, and confocal imaging, we resolved embryonic-derived versus monocyte-derived BAMs in the mouse cortex. Deletion of the transcription factor SMAD4 in microglia and embryonic-derived BAMs using Crybb1-Cre caused a developmental arrest of microglia, which instead acquired a BAM specification signature. By contrast, the development of genuine BAMs remained unaffected. Our results reveal that SMAD4 drives a transcriptional and epigenetic program that is indispensable for the commitment of brain macrophages to the microglia fate and highlight Crybb1-Cre as a tool for targeting embryonic brain macrophages.

Keywords: BAMs; SMAD4; fate-mapping; macrophages ontogeny; microglia.


Conflict of interest statement

Declaration of interests A.T.S. is a founder of Immunai and Cartography Biosciences and receives research funding from Allogene Therapeutics and Merck Research Laboratories.

Figures

Figure 1.
Figure 1.. Crybb1-Cre efficiently recombines in microglia and subsets of BAMs
(A) Strategy used to generate the Crybb1-Cre : R26-tdTomato reporter line. (B) Representative gating strategy for microglia and BAMs in Crybb1-Cre : R26-tdTomato mice. (C) Representative confocal images of microglia, subdural, and perivascular BAMs expressing tdTomato in Crybb1-Cre : R26-tdTomato mice (n=4 mice, 2 months old, single experiment, dashed lines = blood vessels). (D) Percentage of microglia (Iba1+CD206), subdural, and perivascular BAMs (CD206bright) expressing tdTomato (n=4 mice, 2 months old, single experiment). (E) Representative gating for all myeloid cell populations analyzed in Crybb1-Cre : R26-tdTomato mice (hMPs = heart MPs; kMPs = kidney MPs; siMPs = small intestine MPs; KCs = Kupffer cells; RPMs = red pulp MPs; vatMPs = visceral adipose tissue MPs; LPMs = large peritoneal MPs; avMPs = alveolar MPs; dMPs = dermal MPs; LCs = Langerhans cells). (F) Percentage of tdTomato+ cells in analyzed populations (n=3 mice, 6–8 weeks old, single experiment). (G) Strategy used to generate the Crybb1-tdTomato reporter line. (H) Representative confocal images of microglia and BAMs in Crybb1-tdTomato mice (n=3 mice, 2 months old, single experiment, dashed lines = blood vessel). (I) Representative confocal image of CD206+ perivascular BAMs in Crybb1-Cre : R26-tdTomato mice (white arrowheads) (n=3 mice, single experiment). See also Figure S1
Figure 2.
Figure 2.. Crybb1-Cre recombination activity peaks during the embryonic brain development
(A) Cartoon describing the experimental design and gating strategy. (B) Representative gating strategy for microglia and BAMs in Crybb1-Cre : R26-tdTomato mice at different timepoints. (C) Percentage of tdTomato+ microglia and BAMs from E10.5 to P7 (n=3–6 mice/timepoint, single experiment). (D) Absolute numbers of microglia and BAMs from E10.5 to P7 (n=3–6 mice/timepoint, single experiment). (E) Representative confocal images of microglia and BAMs expressing tdTomato in the forebrain cortex of E17.5 embryos and P7 Crybb1-Cre : R26-tdTomato mice (n=3 embryos and n=2 pups, single experiment). (F) Representative confocal images of microglia and BAMs expressing tdTomato in the forebrain cortex of E18.5 Crybb1-tdTomato embryos (white arrowheads) (n=5 embryos, single experiment). (G) Representative gating strategy for CD206+ and CD206 BAMs in Crybb1-Cre : R26-tdTomato mice at different timepoints. (H) Percentage of tdTomato+ microglia, CD206+ and CD206 BAMs in Crybb1-Cre : R26-tdTomato mice at different timepoints (n=3 mice/timepoint, single experiment). See also Figure S2
Figure 3.
Figure 3.. Two major BAM subsets populate the homeostatic brain
(A) Cartoon describing the experimental design. (B) UMAP plot of microglia and BAMs (n=5 wild-type and n=4 5xFAD littermate mice, 8month-old). (C) Heatmap of the top 20 signature genes for microglia, BAM-1 and BAM-2 populations (n=5 wild-type mice, 8-month-old). (D) Enrichment of selected signature genes for BAM-1 and BAM-2 populations. (E) Expression of selected signature genes for BAM-1 and BAM-2 populations. (F) Representative FACS plot and percentage of different BAM subsets defined based on MHC2 and CD38 surface expression (n=3 wild-type mice, 3-month-old, single experiment). (G) Representative gating for different BAM subsets in choroid plexus and cortex. Surface expression of CD206 and FOLR2 in each population is displayed. (H) Frequency of different BAM subsets in choroid plexus and cortex, within the total BAM population (n=6 mice, 2-month-old, pool of two independent experiments). (I) Percentage of GFP+ BAMs in the cortex of Ccr2GFP mice (n=5 mice, 3-month-old, single experiment). (J) Representative FACS plot of MHC2+ and CD38+ BAM subsets in the cortex of 4- and 12-week-old mice. (K) Frequency of different BAM subset within the total BAM population in the cortex of 4-and 12-week-old mice (n=4–5 mice/group, two-way ANOVA with Bonferroni post-hoc test, ***P<0.001, single experiment). See also Figure S3
Figure 4.
Figure 4.. CD38+ and MHC2+ BAM subsets have different origins
(A) Representative FACS plot of different BAM subsets defined based on MHC2 and CD38 surface expression from Crybb1-Cre : R26-tdTomato and Flt3-Cre : R26-Yfp mice. (B) Percentage of recombination in all BAM subsets from either Crybb1-Cre : R26-tdTomato or Flt3-Cre : R26-Yfp mice (n=6 mice/group, 2–3 months old, pool of two independent experiments). (C) Representative confocal images of CD206 and CD38 staining on perivascular BAMs in Crybb1-Cre : R26-tdTomato mice (n=3 mice, 2–3 months old, single experiment). (D) Representative confocal images of CD206+MHC2+ BAMs in Crybb1-Cre : R26-tdTomato mice (white arrowheads, n=5 mice/group, 2–3 months old, two independent experiments). (E) Representative confocal images of CD206+MHC2+ BAMs in Flt3-Cre : R26-Yfp mice (white arrowheads, n=6 mice/group, 2–3 months old, two independent experiments). (F) Percentage of recombination in CD206+MHC2+ cortical BAMs from either Crybb1-Cre : R26-tdTomato and Flt3-Cre : R26-Yfp mice (n=5–6 mice/group, 2–3 months old, pool of two independent experiments). (G) Cartoon describing the experimental design. A representative confocal image of recombinant CD206+ perivascular BAMs from Lyz2CreErt2 : R26-tdTomato after four weeks of TAM treatment is displayed. (H) Representative FACS plot of different BAM subsets defined based on MHC2 and CD38 surface expression from Lyz2CreErt2 : R26-tdTomato mice that underwent TAM treatment regimen. (I) Percentage of recombination in all BAM subsets and blood Ly6C+ and Ly6C monocytes from Lyz2CreErt2 : R26-tdTomato mice upon four weeks of TAM treatment and after additional four weeks of control diet (n=5 mice/group, 2–3 months old, two-way ANOVA with Bonferroni post-hoc test, ***P<0.001, single experiment). See also Figure S4
Figure 5.
Figure 5.. Maturation failure of SMAD4-deficient microglia
(A) Strategy used to generate the Smad4 cKO line. Representative confocal image of microglia from either Smad4F/F and Smad4 cKO (n=5 mice/genotype, 4-week-old, two independent experiments). (B) Cartoon describing the experimental design. (C) UMAP plot of microglia and BAMs from Smad4F/F and Smad4 cKO littermate mice, split either by cluster or genotype (n=4 mice/genotype, 6–8 weeks old). (D) Percentage of genotypes in each cluster. (E) Number and fold-change of differentially expressed genes in brain myeloid populations from Smad4F/F and Smad4 cKO mice. (F) Heatmap of the top 10 signature genes per cluster. (G) UMAP plot showing the differential expression of signature genes in Smad4F/F and Smad4 cKO mice. (H) Representative confocal images of CD206 staining on microglia from Smad4F/F and Smad4 cKO mice (n=5 mice/genotype, 4-week-old, two independent experiments). (I) UMAP and violin plots showing the expression of Lyve1 and Cd163 in each cluster. See also Figure S5
Figure 6.
Figure 6.. Broad epigenetic changes in SMAD4-deficient microglia
(A) Cartoon describing scATAC-seq protocol and analysis. (B) UMAP of the scATAC-seq profiles of microglia and BAMs from Smad4F/F and Smad4 cKO littermate mice split by cluster (n=4 mice/genotype, 6–8 weeks old). (C) UMAP of the scATAC-seq profiles of microglia and BAMs split by genotype. (D) Heatmap displaying accessibility of 6,335 marker genes for the indicated cell populations. (E) Number and fold-change of differential OCRs in Smad4 cKO vs Smad4F/F for the indicated cell types. (F) Pseudo-bulk ATAC-seq coverage of selected gene loci. (G) UMAP of the scATAC-seq profiles colored by accessibility of the indicated gene, and quantification of locus accessibility (gene score) by cell population and genotype. (H) Heatmap of 16,270 OCRs in the indicated cell populations and top enriched motifs for each population. Up to 8 motifs are shown per population. (I) UMAP of the scATAC-seq profiles colored by enrichment of the indicated TF motifs. See also Figure S6
Figure 7.
Figure 7.. Memory impairment in mice with SMAD4-deficient microglia
(A) Representative confocal images of Iba1, CD206 and GFAP staining on brains from Smad4F/F and Smad4 cKO mice (n=5 mice/genotype, 4-week-old, two independent experiments). (B) Percentage of GFAP covered area in the brain of Smad4F/F and Smad4 cKO mice (n=5 mice/genotype, 4-week-old, displayed mean values of three sections per mouse, Mann-Whitney U test, *P<0.05, pool of two independent experiments). (C) Open Field Test on Smad4F/F and Smad4 cKO littermate mice assessing travelled distance every 10 min intervals, and total travelled distance during 1h test (n=14 Smad4F/F and n=10 Smad4 cKO, 2–3-month-old, two-way ANOVA with Bonferroni post-hoc test and Mann-Whitney U test, *P<0.05, pool of three independent experiments). (D) Elevated Plus Maze test on Smad4F/F and Smad4 cKO littermate mice assessing percentage of time and percentage of travelled distance in open arms, and total travelled during 5 min test (n=14 Smad4F/F and n=10 Smad4 cKO, 2–3-month-old, Mann-Whitney U test, **P<0.01, ***P<0.001, pool of three independent experiments). (E) Rotarod test on Smad4F/F and Smad4 cKO littermate mice assessing latency time to fall from accelerated rod during 9 trials (n=14 Smad4F/F and n=10 Smad4 cKO, 2–3-month-old, Mann-Whitney U test, pool of three independent experiments). (F) Morris Water Maze test on Smad4F/F and Smad4 cKO littermate mice assessing latency time to locate hidden platform during 5 days of training (n=14 Smad4F/F and n=8 Smad4 cKO, 3–4-month-old, two-way ANOVA with Bonferroni post-hoc test, pool of three independent experiments). (G) Morris Water Maze test on Smad4F/F and Smad4 cKO littermate mice assessing swimming time in target quadrant and number of crossings over platform position during probe trial (n=14 Smad4F/F and n=8 Smad4 cKO, 3–4-month-old, Mann-Whitney U test, **P<0.01, pool of three independent experiments). See also Figure S6

References

    1. Brioschi S, Zhou Y, Colonna M (2020) Brain Parenchymal and Extraparenchymal Macrophages in Development, Homeostasis, and Disease. J Immunol 204:294–305 - PMC - PubMed
    1. Kierdorf K, Masuda T, Jordão MJC, Prinz M (2019) Macrophages at CNS interfaces: ontogeny and function in health and disease. Nat Rev Neurosci 20:547–562 - PubMed
    1. Prinz M, Masuda T, Wheeler MA, Quintana FJ (2021) Microglia and Central Nervous System-Associated Macrophages-From Origin to Disease Modulation. Annu Rev Immunol 39:251–277 - PMC - PubMed
    1. Ginhoux F, Greter M, Leboeuf M, et al. (2010) Fate mapping analysis reveals that adult microglia derive from primitive macrophages. Science 330:841–845 - PMC - PubMed
    1. Schulz C, Gomez Perdiguero E, Chorro L, et al. (2012) A lineage of myeloid cells independent of Myb and hematopoietic stem cells. Science 336:86–90 - PubMed

Publication types