. 2023 Feb 21;4(2):100943.
doi: 10.1016/j.xcrm.2023.100943. Epub 2023 Jan 27.

Accelerated SARS-CoV-2 intrahost evolution leading to distinct genotypes during chronic infection

Collaborators, Affiliations

Accelerated SARS-CoV-2 intrahost evolution leading to distinct genotypes during chronic infection

Chrispin Chaguza et al. Cell Rep Med. .

Abstract

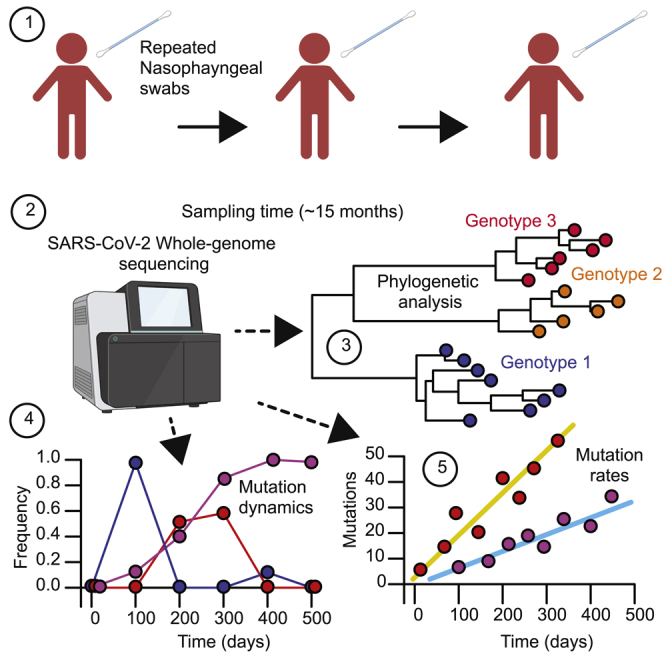
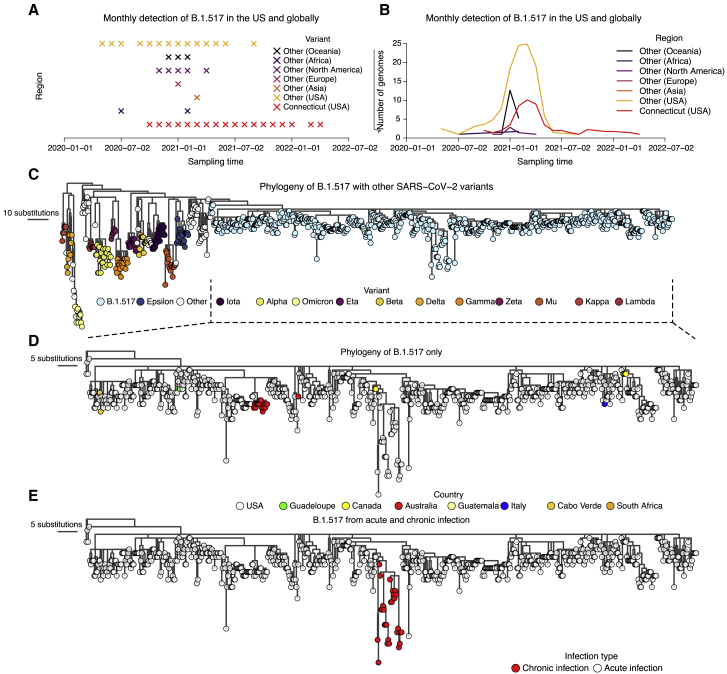
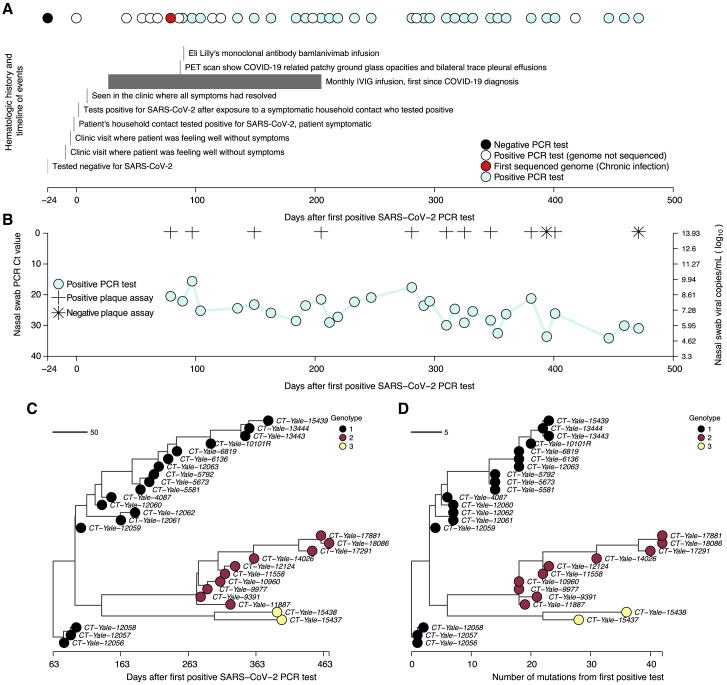
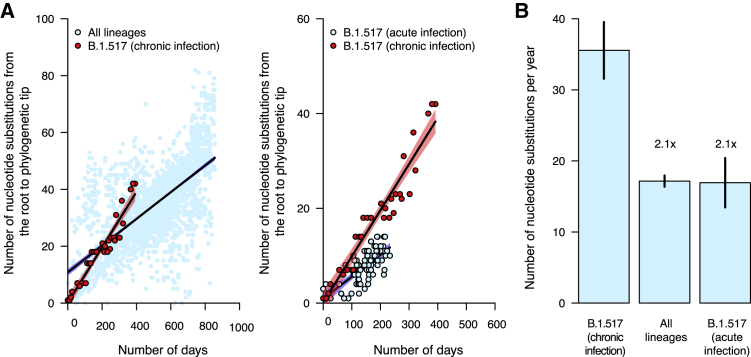
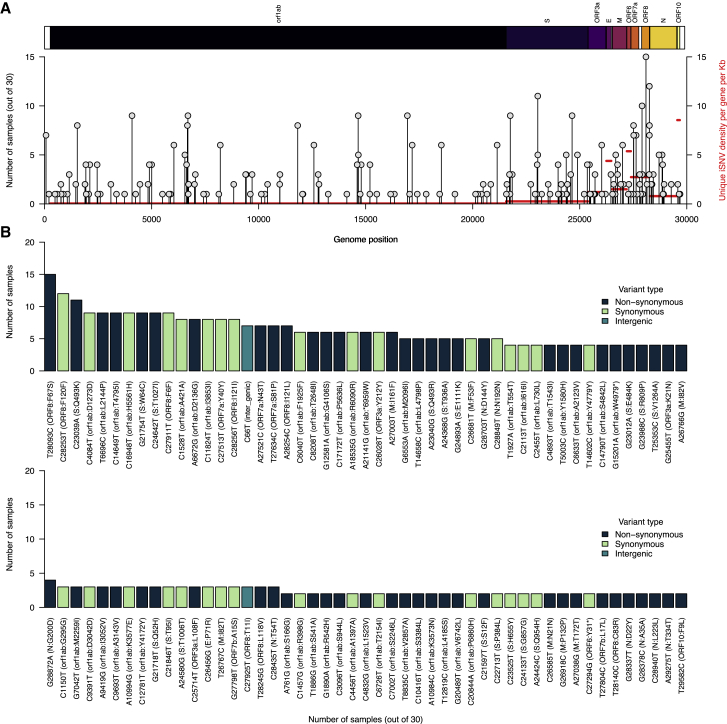
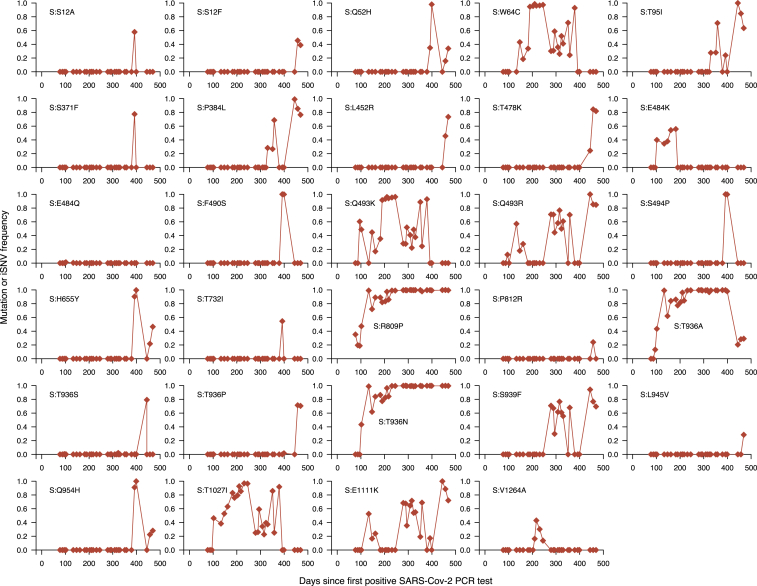
The chronic infection hypothesis for novel severe acute respiratory syndrome coronavirus 2 (SARS-CoV-2) variant emergence is increasingly gaining credence following the appearance of Omicron. Here, we investigate intrahost evolution and genetic diversity of lineage B.1.517 during a SARS-CoV-2 chronic infection lasting for 471 days (and still ongoing) with consistently recovered infectious virus and high viral genome copies. During the infection, we find an accelerated virus evolutionary rate translating to 35 nucleotide substitutions per year, approximately 2-fold higher than the global SARS-CoV-2 evolutionary rate. This intrahost evolution results in the emergence and persistence of at least three genetically distinct genotypes, suggesting the establishment of spatially structured viral populations continually reseeding different genotypes into the nasopharynx. Finally, we track the temporal dynamics of genetic diversity to identify advantageous mutations and highlight hallmark changes for chronic infection. Our findings demonstrate that untreated chronic infections accelerate SARS-CoV-2 evolution, providing an opportunity for the emergence of genetically divergent variants.

Keywords: COVID-19 vaccines; SARS-CoV-2; chronic infection; epidemiology; genomic surveillance; immunocompromised individual; intrahost evolution; intrahost genotypes; mutation dynamics; variant emergence.


Conflict of interest statement

Declaration of interests N.D.G. is a consultant for Tempus Labs and the National Basketball Association for work related to COVID-19 but is outside the submitted work. The University of North Carolina is pursuing intellectual property protection for Primer ID sequencing, and R.I.S. has received nominal royalties from licensing.

Figures

None
Graphical abstract
Figure 1
Figure 1
Genomic surveillance and phylogeny showing continued detection and genetic divergence of B.1.517 from chronic infection (A) Monthly detection of B.1.517 (B.1.517 and B.1.517.1) variants in Connecticut (USA), other US states, and elsewhere. (B) The total number of sequence genomes for the B.1.517 (B.1.517 and B.1.517.1) variants in Connecticut (USA), the rest of the US, and elsewhere. The y axis is transformed by square root transformation to show time points with non-zero number of genomes, especially those from countries with a low prevalence of B.1.517. (C) A maximum likelihood phylogeny of B.1.517 in the context of selected genomes from other variants. (D) A maximum likelihood phylogeny of all sequenced B.1.517 genomes showing country of origin. (E) A maximum likelihood phylogeny of all sequenced B.1.517 samples highlighting the genomes associated with the chronic infection and other contextual genomes from acute infection (although some could have been sampled from unknown chronic infections).
Figure 2
Figure 2
Molecular and virological assays showing isolation of infectious viruses with high copy numbers and the emergence and coexistence of distinct genotypes during the chronic infection (A) Timeline showing clinical history of the patient from the earliest time they tested negative for SARS-CoV-2, the first positive test following household exposure by a symptomatic household contact who tested positive 2 days prior, until the last sampling point. Note that collection of samples was stopped due to the deteriorating condition of the patient, but the infection had not yet cleared. (B) Nasal swab RT-PCR cycle threshold (Ct) values for the samples available for whole-genome sequencing showing high viral RNA copy numbers. Additionally, virus infectivity assays performed for selected samples revealed infectious virus at most sampling points. Additional information for the samples, including plaque assay results, are provided in Table S1. (C) Time-resolved phylogeny of the chronic infection samples with branch lengths scaled by the number of days since the first positive RT-PCR SARS-CoV-2 test. The phylogeny was generated based on near full whole genomes after trimming the 3′ and 5′ ends to remove poor quality nucleotides (see STAR Methods). (D) Maximum likelihood phylogeny of the chronic B.1.517 samples showing branch lengths scaled by the genetic divergence expressed as the number of accrued substitutions over time. The phylogeny shows the intrahost emergence and persistence of multiple divergent genotypes.
Figure 3
Figure 3
Nucleotide substitution rates are faster during chronic infection than acute infection and the global evolutionary rate (A) Scatterplots showing the relationship between phylogenetic root to tip distances, expressed as the number of nucleotide substitutions per site, and time as the number of days from the first sampled genome for the B.1.517 from chronic infection versus all SARS-CoV-2 lineages and other B.1.517 from acute infections. The data points associated with the chronic infection are colored in red, while those representing other variants are colored in sky blue. The lines and shaded bands surrounding them represent the linear regression models fitted to the data points for the chronic infection data and other variants. (B) Bar graph showing the average mutation rates, expressed as the number of nucleotide substitutions per year for the chronic infection samples and other variants based on the regression coefficients (β) generated from the plots in (A). Specific values for the evolutionary rates for all lineages combined, the parental and chronic infection B.1.517 strains, and other lineages are shown in Table S3 and Figure S3.
Figure 4
Figure 4
Increasing intrahost genetic diversity during chronic infection (A) The number of intrahost single-nucleotide variants (iSNVs) >3% frequency across all the samples and genotypes detected during the infection (see Figures 2C and 2D). (B) The number of iSNVs accumulated over time during the chronic infection. The black solid line represents a fitted linear regression. (C) Proportion of iSNVs binned at different frequencies and stratified by variant or mutation type (intergenic, synonymous, and non-synonymous). (D) The proportion of the overall number of unique iSNVs coding for synonymous and non-synonymous amino acid changes at different codon positions. (E) The proportion of unique iSNVs grouped by variant type to highlight potential selection across different SARS-CoV-2 genes. (F) The number of unique iSNVs per gene normalized by the gene length to highlight variability in selection independent of gene size. (G) The mutation spectra showing the relative mutation rate across the SARS-CoV-2 genome-stratified variant type. Additional information for all the identified mutations (intergenic, synonymous, and non-synonymous) are provided in Data S1.
Figure 5
Figure 5
Several intrahost SNVs repeatedly detected during chronic infection (A) The number of samples containing each unique iSNV and its position on the ancestral SARS-CoV-2 reference genome (GenBank: MN908937.3 or NC_045512.2). The y axis labels represent iSNVs corresponding to specific nucleotide substitutions and position in the genome, while the information within the brackets shows the specific amino acid changes, gene, and position in the gene. The y axis on the right side of the graph, colored in red, shows the average number of iSNVs per kilobase for each gene in the reference genome. (B) The y axis shows the number of samples containing iSNVs shown on the x axis. The iSNV labels contain the specific nucleotide substitutions and position in the genome. Specific amino acid changes and their specific position in the SARS-CoV-2 genomes are shown in the brackets on the x axis. The bars representing different nucleotide substitutions are colored based on the sequence feature annotations in the ancestral reference genome (GenBank: NC_045512.2). All the iSNVs are colored by the variant or mutation type based on the ancestral SARS-CoV-2 genome sequence feature annotations (GenBank: MN908937.3). Additional information for all the identified mutations (intergenic, synonymous, and non-synonymous) are provided in Data S1.
Figure 6
Figure 6
Fluctuating dynamics of iSNVs in the spike gene during chronic infection Temporal frequencies of 29 non-synonymous iSNVs identified in the spike gene. Additional information for all the identified mutations (intergenic, synonymous, and non-synonymous) are provided in Data S1.

Update of

References

    1. Dhar M.S., Marwal R., Vs R., Ponnusamy K., Jolly B., Bhoyar R.C., Sardana V., Naushin S., Rophina M., Mellan T.A., et al. Genomic characterization and epidemiology of an emerging SARS-CoV-2 variant in Delhi, India. Science. 2021;374:995–999. doi: 10.1126/science.abj9932. - DOI - PMC - PubMed
    1. Tegally H., Wilkinson E., Giovanetti M., Iranzadeh A., Fonseca V., Giandhari J., Doolabh D., Pillay S., San E.J., Msomi N., et al. Detection of a SARS-CoV-2 variant of concern in South Africa. Nature. 2021;592:438–443. doi: 10.1038/s41586-021-03402-9. - DOI - PubMed
    1. Volz E., Mishra S., Chand M., Barrett J.C., Johnson R., Geidelberg L., Hinsley W.R., Laydon D.J., Dabrera G., O'Toole Á., et al. Assessing transmissibility of SARS-CoV-2 lineage B.1.1.7 in England. Nature. 2021;593:266–269. doi: 10.1038/s41586-021-03470-x. - DOI - PubMed
    1. Mlcochova P., Kemp S.A., Dhar M.S., Papa G., Meng B., Ferreira I.A.T.M., Datir R., Collier D.A., Albecka A., Singh S., et al. SARS-CoV-2 B.1.617.2 Delta variant replication and immune evasion. Nature. 2021;599:114–119. doi: 10.1038/s41586-021-03944-y. - DOI - PMC - PubMed
    1. Takashita E., Kinoshita N., Yamayoshi S., Sakai-Tagawa Y., Fujisaki S., Ito M., Iwatsuki-Horimoto K., Chiba S., Halfmann P., Nagai H., et al. Efficacy of antibodies and antiviral drugs against Covid-19 Omicron variant. N. Engl. J. Med. 2022;386:995–998. doi: 10.1056/NEJMc2119407. - DOI - PMC - PubMed

Publication types