. 2023;16(1):1-15.
doi: 10.1016/j.jcmgh.2023.02.002. Epub 2023 Feb 14.

Distal Fecal Wash Host Transcriptomics Identifies Inflammation Throughout the Colon and Terminal Ileum

Affiliations

Distal Fecal Wash Host Transcriptomics Identifies Inflammation Throughout the Colon and Terminal Ileum

Stav Dan et al. Cell Mol Gastroenterol Hepatol. 2023.

Abstract

Background & aims: Noninvasive modalities for assessing active endoscopic and histologic inflammation in Crohn's disease and ulcerative colitis patients are critically needed. Fecal wash host shed-cell transcriptomics has been shown to be a robust classifier of endoscopic and histologic inflammation in inflammatory bowel disease patients with distal colitis. Whether such fecal washes can inform on inflammatory processes occurring in more proximal intestinal segments is currently unknown.

Methods: Fifty-nine inflammatory bowel disease patients and 50 controls were prospectively enrolled. Biopsy specimens and fecal washes from the distal colon, proximal colon, and terminal ileum were compared. Host transcriptomics were performed on the biopsy specimens and fecal washes obtained during colonoscopy at predefined locations throughout the colon and terminal ileum and results were associated with concurrent clinical, endoscopic, and histologic parameters.

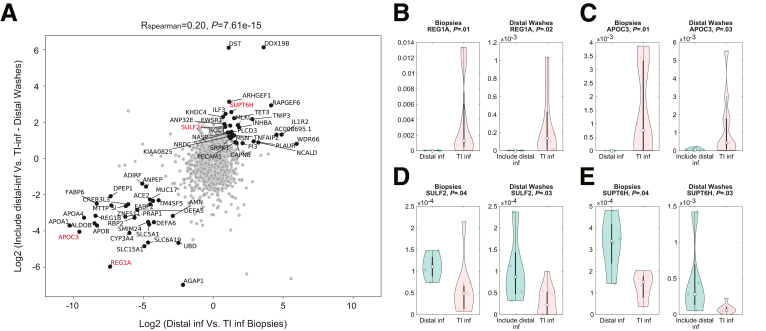
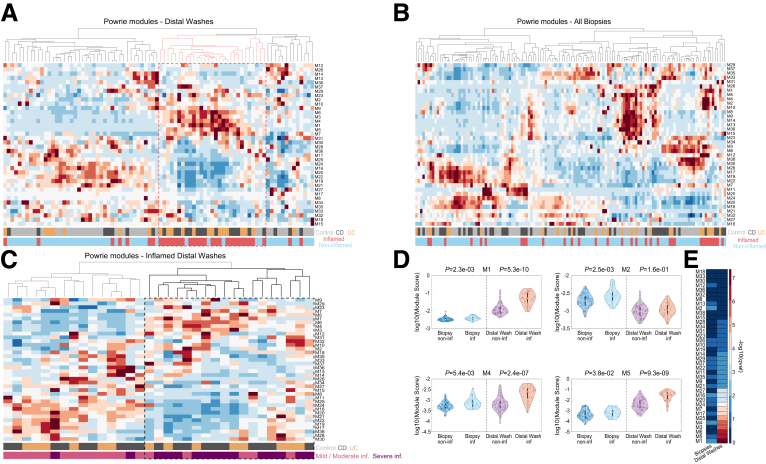
Results: We found that host transcriptomics of distal fecal washes robustly classify histologic inflammation in ileal and proximal colonic Crohn's disease, even without distal colonic involvement (area under the receiver operating characteristic curve, 0.94 ± 0.09). We further found that fecal washes consist of modules of co-expressed genes of immune, stromal, and epithelial origin that are indicative of endoscopic disease severity. Fecal wash host transcriptomics also captures expression of gene modules previously associated with a lack of response to biological therapies.

Conclusions: Our study establishes the accuracy of distal colonic fecal washes for identifying and scoring inflammatory processes throughout the entire ileal-colonic axis.

Keywords: Histology; IBD; Therapy Outcome; Transcriptomics.


Figures

None
Graphical abstract
Figure 1
Figure 1
Host transcriptomics of fecal washes from different intestinal segments captures information that is distinct from same-segment biopsy transcriptomics. (A) Experimental layout. (B) Clustergram of transcriptomes of biopsy specimens (purple) and fecal washes (yellow), color-coded by intestinal segment source and inflammation status. Red indicates high expression, blue indicates low expression. Representative gene names are shown on the right. (C) Principal component analysis of biopsy specimens (purple) and fecal washes (yellow). Black circles highlight inflamed samples. Parentheses show the percentage of explained variance by each PC. (D) Spearman correlations between the transcriptomes of pairs of either biopsy specimens or fecal washes that were both annotated as inflamed and mixed pairs (one annotated as inflamed and the other not). (B–D) Biopsy specimens were considered inflamed if they showed histologic inflammation, fecal washes were considered inflamed if at least 1 segmental biopsy specimen from the patient showed inflammation. (A) Created with BioRender.com. D, distal colon; P, proximal colon; TI, terminal ileum; mRNA, messenger RNA; PC1, principal component 1; PC2, principal component 2.
Figure 2
Figure 2
Illustration of sample classification and differences in gene expression between biopsy specimens and fecal washes. (A) Heatmap showing the source of the patient samples in the study cohort, with reference to the previous data set from Ungar et al. (B) Differential gene expression between fecal washes and biopsy specimens. Red indicates significantly different genes (fold change >2 and q value <0.1). Shown are the names of representative differentially expressed genes.
Figure 3
Figure 3
Computational deconvolution shows differences in cell composition between biopsy specimens and fecal washes. (A) Clustergram of inferred cell proportions. Table was standardized to Z-scores. The red dashed box highlights fecal washes enriched in inflamed samples. Colorbars annotate samples by sample type, disease, and inflammation status. (B) Violin plots of the inferred proportions of distinct cell types in biopsy specimens (top) and fecal washes (bottom). Noninflamed samples include both controls and noninflamed IBD patients. Biopsy specimens were considered inflamed if they showed histologic inflammation, fecal washes were considered inflamed if at least 1 segmental biopsy from the patient showed inflammation. DC2, dendritic cells type 2; GC, germinal center; ILC, innate lymphoid cells; NK, natural killer; TA, transit amplifying; Treg, regulatory T cell.
Figure 4
Figure 4
Host transcriptomics of distal fecal washes captures active inflammation in ileal or proximal colonic CD. (A) Clustergram of distal fecal washes from UC patients and controls, color-coded by disease and segment of inflammation. (B) Principal component analysis of UC and control distal fecal washes. Percentages in in parentheses explain the variance of each PC. (C) Clustergram of distal fecal washes from CD patients and controls, color-coded by disease and segment of inflammation. (D) Principal component analysis of CD and control distal fecal washes. Parentheses show the variance explained by each PC. Blue indicates no inflammation, green indicates inflammation that includes the distal colon (left), pink indicates inflammation in the proximal colon (right) or proximal colon + TI, light pink indicates inflammation only in the TI. (A and C) Red indicates high expression, blue indicates low expression, representative gene names are shown on the right. Red dashed box highlight fecal washes enriched in inflamed samples. (E) Differential gene expression of inflamed and noninflamed distal fecal washes from CD patients and controls. Red indicates significantly different genes (fold change >2 and q value <0.1). (F) Receiver operating characteristic (ROC) curve of the classification performance of inflammation status based on distal fecal washes of controls and UC patients (orange), distal fecal washes of controls and CD patients that do not involve the distal colon (black), and distal biopsy specimens of controls vs UC and CD patients (purple). Biopsy specimens were considered inflamed if they showed histologic inflammation, fecal washes were considered inflamed if at least 1 segmental biopsy specimen from the patient showed inflammation. CT, control; inf, inflamed; PC1, principal component 1; PC2, principal component 2.
Figure 5
Figure 5
Transcriptomics of distal fecal washes contain information referring to the inflamed intestinal segment. (A) Scatter plot of the expression ratios between inflamed samples of CD patients with distal colon inflammation and ones with only TI inflammation. X-axis shows the ratios in the segmental biopsy specimens, the Y-axis shows the ratios in distal fecal washes. (B–E) Violin plots of the expression of representative genes shown in red in panel A. Biopsy specimens were considered inflamed if they showed histologic inflammation, fecal washes were considered inflamed if at least 1 segmental biopsy from the patient showed inflammation. inf, inflamed.
Figure 6
Figure 6
Distal fecal washes contain modules of co-expressed immune, stromal, and epithelial genes associated with inflammation severity. Clustergram of epithelial genes (A), stromal genes (B), and immune genes (C). Red indicates high expression, blue indicates low expression. Modules are based on the gene hierarchical clustering, with relevant branches colored accordingly. Right: Representative module genes are shown. Color bars annotate disease and inflammation status. Red dashed boxes highlight a branch of fecal washes enriched in inflamed samples. (D) Clustergram of the module scores for distal fecal wash samples show co-expression of the Str3, Imm3, and Epi1 modules. Red indicates high expression, blue indicates low expression. Colorbars annotate disease and inflammation severity score. Right: Heatmap shows the median of module scores over the discrete inflammation severity score classes (see the Methods section). Each row was normalized to the maximum across severity classes. Fecal washes were considered inflamed if at least 1 segmental biopsy from the patient showed inflammation. Epi, epithelial; Imm, immune; inf, inflamed; Non-inf, noninflamed; Str, stromal.
Figure 7
Figure 7
Module scores of co-expressed immune, stromal, and epithelial genes show trends that correlate with inflammation severity. Shown are the module scores of each of the 10 modules (Figure 6D) binned according to classes of inflammation severity (Supplementary Table 8). The classes were binned by the percentile of the predefined inflammation severity score (see the Methods section, controls were assigned a severity score of 0). Shown are Spearman correlation values between the module scores and severity scores of distal fecal washes from patients with inflammation and controls. Fecal washes were considered inflamed if at least 1 segmental biopsy from the patient showed inflammation. Epi, epithelial; Imm, immune; inf, inflamed; Non-inf, noninflamed; Str, stromal.
Figure 8
Figure 8
Fecal wash host transcriptomics correlates with endoscopic severity score significantly more than calprotectin levels. (A) Module scores of co-expressed immune, stromal, and epithelial gene modules (Figure 6D) are in correlation with endoscopic severity score. Module scores are binned according to classes of endoscopic severity scores (controls were assigned an endoscopic score of 0) (Methods section, Supplementary Table 8). Shown are Spearman correlation values between the module scores and endoscopic severity scores of distal fecal washes from patients with inflammation and controls. Blue frames and red frames highlight gene modules that significantly decrease and increase with endoscopic inflammation severity, respectively (P < .05). (B) Correlation between calprotectin levels and endoscopic scores of distal fecal washes from patients with inflammation (Methods section, Supplementary Table 8). Fecal washes were considered inflamed if at least 1 segmental biopsy from the patient showed inflammation. Epi, epithelial; Imm, immune; Str, stromal.
Figure 9
Figure 9
Modules of co-expressed genes that correlate with response to biological therapy carry information on inflammation severity in fecal washes. (A–C) Summed expression of previously identified modules that showed correlation with response to anti-TNF/anti-integrin therapies. (A) Distal fecal washes, red dashed box highlights a branch of fecal washes enriched in inflamed samples, increased in modules M1, M3, M4, M5, and M6. (B) All biopsies. (A and B) Color bars annotate disease and inflammation status. (C) Only inflamed distal fecal washes. Color bars annotate disease and inflammation severity (see the Methods section). Bold dashed box highlights fecal washes of patients with severe inflammation. (D) Scores of representative modules correlating with nonresponse to anti-TNF/anti-integrin therapies, showing more significant differences in expression between inflamed and noninflamed distal fecal washes compared with biopsies for M1, M4, and M5, but not M2. A pseudonumber (2.4163e-05) was added to the module scores before applying the log10 transform. (E) Higher statistical significance in the differences in module expression between inflamed and noninflamed samples in distal fecal washes compared with biopsies. Shown are –log10 (q values). Biopsy specimens were considered inflamed if they showed histologic inflammation, fecal washes were considered inflamed if at least 1 segmental biopsy specimen from the patient showed inflammation. inf, inflamed; non-inf, noninflamed.

Comment in

  • Distal Fecal Wash: Intestinal Liquid Biopsy?
    Siegmund B. Siegmund B. Cell Mol Gastroenterol Hepatol. 2023;16(1):161-162. doi: 10.1016/j.jcmgh.2023.04.001. Epub 2023 Apr 29. Cell Mol Gastroenterol Hepatol. 2023. PMID: 37130565 Free PMC article. No abstract available.

References

    1. Guan Q. A comprehensive review and update on the pathogenesis of inflammatory bowel disease. J Immunol Res. 2019;2019 - PMC - PubMed
    1. Spiceland C.M., Lodhia N. Endoscopy in inflammatory bowel disease: role in diagnosis, management, and treatment. World J Gastroenterol. 2018;24:4014–4020. - PMC - PubMed
    1. Paramsothy S., Rosenstein A.K., Mehandru S., Colombel J.-F. The current state of the art for biological therapies and new small molecules in inflammatory bowel disease. Mucosal Immunol. 2018;11:1558–1570. - PMC - PubMed
    1. Singh S., George J., Boland B.S., et al. Primary non-response to tumor necrosis factor antagonists is associated with inferior response to second-line biologics in patients with inflammatory bowel diseases: a systematic review and meta-analysis. J Crohns Colitis. 2018;12:635–643. - PMC - PubMed
    1. Ungar B., Yavzori M., Fudim E., et al. Host transcriptome signatures in human faecal-washes predict histological remission in patients with IBD. Gut. 2022;71:1988–1997. - PubMed

Publication types