. 2023 Mar 7;10(3):ENEURO.0465-22.2023.
doi: 10.1523/ENEURO.0465-22.2023. Print 2023 Mar.

Imaging Voltage Globally and in Isofrequency Lamina in Slices of Mouse Ventral Cochlear Nucleus

Affiliations

Imaging Voltage Globally and in Isofrequency Lamina in Slices of Mouse Ventral Cochlear Nucleus

Yihe Ma et al. eNeuro. .

Abstract

The cochlear nuclei (CNs) receive sensory information from the ear and perform fundamental computations before relaying this information to higher processing centers. These computations are performed by distinct types of neurons interconnected in circuits dedicated to the specialized roles of the auditory system. In the present study, we explored the use of voltage imaging to investigate CN circuitry. We tested two approaches based on fundamentally different voltage sensing technologies. Using a voltage-sensitive dye we recorded glutamate receptor-independent signals arising predominantly from axons. The mean conduction velocity of these fibers of 0.27 m/s was rapid but in range with other unmyelinated axons. We then used a genetically-encoded hybrid voltage sensor (hVOS) to image voltage from a specific population of neurons. Probe expression was controlled using Cre recombinase linked to c-fos activation. This activity-induced gene enabled targeting of neurons that are activated when a mouse hears a pure 15-kHz tone. In CN slices from these animals auditory nerve fiber stimulation elicited a glutamate receptor-dependent depolarization in hVOS probe-labeled neurons. These cells resided within a band corresponding to an isofrequency lamina, and responded with a high degree of synchrony. In contrast to the axonal origin of voltage-sensitive dye signals, hVOS signals represent predominantly postsynaptic responses. The introduction of voltage imaging to the CN creates the opportunity to investigate auditory processing circuitry in populations of neurons targeted on the basis of their genetic identity and their roles in sensory processing.

Keywords: auditory nerve; c-fos; cochlear nuclei; genetically-encoded voltage sensors; tonotopic organization; voltage imaging.


Conflict of interest statement

The authors declare no competing financial interests.

Figures

Figure 1.
Figure 1.
Labeling of neurons activated by pure tone stimulation in the CN of TRAP::hVOS animals. A, Auditory stimulation paradigm (see Materials and Methods): TRAP::hVOS mice in a soundproof box experienced 3 h of silence followed by exposure to a 6-h, 15-kHz pure tone (orange bar) followed by 3 h of silence. Mice were injected with 4-OHT (50 mg/kg) at the midpoint of sound exposure. B, Schematic drawing of the CN in the sagittal plane showing the tonotopic arrangement of AN fibers (colored lines) bifurcating into the aVCN and pVCN. The * indicates the small cap region in B (as well as in C1 and D). C1, Immunohistochemistry staining in a parasagittal VCN slice of 4-OHT-injected TRAP::hVOS mice exposed to sound. Staining for CeFP, the fluorescent moiety of the hVOS probe (Wang et al., 2010), revealed probe expression (red). Tubulin immunostaining highlights AN axons (TuBB3, green). DAPI stains nuclei (blue). hVOS expressing cells distributed along the bands are outlined with a white dashed box in pVCN and aVCN (as well as in C2, D, and E1). The isofrequency band elongated in pVCN ends before entering the octopus cell area (oct). C2, Enlargement of pVCN area from (C1); the isofrequency band (outlined) is parallel with the AN fibers labeled with tubulin immunofluorescence (green, arrows). D, hVOS expressing cells in an Isofrequency band in pVCN in a coronal slice. E1, The lower portion of C1 is displayed with only red hVOS staining (no TUBB3 or DAPI) to highlight the isofrequency lamina more clearly (white outlined boxes). E2, The corresponding region as in E1 within a parasagittal VCN slice of a mouse that had undergone the same protocol illustrated in Figure 1A, but with no sound. hVOS staining was viewed with twofold higher laser intensity and 70% higher detector sensitivity to bring the brightness in this section to a level comparable to the brightness in E1. The regions containing the isofrequency bands in E1 contained much less labeling. Scale bars = 100 μm (C1 and D) and 50 μm (C2).
Figure 2.
Figure 2.
hVOS imaging of responses to a single pulse in a coronal VCN slice from a TRAP::hVOS mouse. A, A resting fluorescence image with overlain traces binned 4:1 (traces on expanded scales are shown in C). The site of AN stimulation is labeled with *. Selected traces are highlighted with colors for display in A. B, Peak ΔF/F encoded as color following the scale in the lower left corner, normalized to the maximum signal in the field of view. The band of green extending diagonally from the site of stimulation is suggestive of an isofrequency band. The colored scale to the left indicates normalized depolarization. C, Four selected traces indicated by color in A illustrate the response with higher amplitudes near the site of stimulation (red). The dashed line marks the time of stimulation. Traces are 10 trial averages.
Figure 3.
Figure 3.
Voltage-sensitive dye imaging of responses to a single pulse in a coronal VCN slice from a non-hVOS mouse not subjected to the sound protocol. A, A CCD image of the slice with traces overlain. The site of stimulation is labeled with * and selected traces highlighted with colors for display in C. B, Peak ΔI/I encoded as color following the scale in the lower right corner, normalized to the maximum. Red indicates largest depolarization. Response amplitudes decline radially from the site of stimulation. C, Traces selected from A, B illustrate the form of the responses, with amplitude decreasing and latency increasing with distance from the site of stimulation. Traces are 20 trial averages.
Figure 4.
Figure 4.
NBQX action on hVOS and voltage-sensitive dye (VSD) responses. A single pulse response was recorded before (Control, black) and ∼20 min after (NBQX, red) application of 10 μm NBQX. NBQX blocked most of the hVOS response. In the voltage-sensitive dye response NBQX had no effect on the initial spike but blocked the later synaptic component. Traces are 10 trial averages for both VSD and hVOS.
Figure 5.
Figure 5.
hVOS imaging of responses to train stimulation in a VCN slice from a TRAP::hVOS mouse. Labeled cells were depolarized by stimulus trains applied to the AN. A, Left, An epifluorescence image showing the stimulus site (*) and numbered regions of interest selected for trace display (circles). Right. Fluorescence traces from three locations indicated in the image along the isofrequency band in VCN. A 10-pulse train at 50 Hz (300 μA, times of pulses indicated by vertical red dashed lines) elicited depolarizing responses. Traces are 10 trial averages. B, A sequence of response intensity snapshots at the indicated times (0.5-ms intervals) after the first pulse. The yellow shaded region in the right panel in A highlights the time interval used to generate the maps. After stimulation, responses appear uniformly along the isofrequency band (boundaries indicated by white dashed lines). The colored scale to the right indicates depolarization as red, normalized to the maximum signal in the field of view. The maximal response is reached in the 1.5-ms map.
Figure 6.
Figure 6.
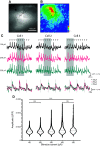
hVOS imaging response amplitudes and train stimulation. A, Epifluorescence image of the VCN slice showing the stimulus site (*), and three small circles and arrowheads indicating sites selected for display of traces. Traces are 10 trial averages. B, Map of peak ΔF/F during a 50 Hz train of 10 pulses (250 μA). The responsive region forms a band corresponding to an isofrequency lamina (note the lower magnification compared with Fig. 5). C, Responses of the three locations highlighted in A and B, to 150 μA (black), 250 μA (red), and 350 μA (blue). Traces in the gray shaded area are expanded and overlaid and stimulation times indicated with gray dashed lines. D, Response amplitude versus stimulation current in violin plot format. Amplitudes from slices from five animals with 2–128 locations evaluated per experiment. Differences were significant across five stimulation currents in pairwise comparisons, except for the first two and the last two groups (****, Kruskal–Wallis test with Dunn’s test, p < 0.0001). The results suggested that low stimulus currents evoke predominantly synaptic potentials and that higher stimulus currents evoke action potentials in a small number of cells.

Similar articles

Cited by

References

    1. Allen WE, DeNardo LA, Chen MZ, Liu CD, Loh KM, Fenno LE, Ramakrishnan C, Deisseroth K, Luo L (2017) Thirst-associated preoptic neurons encode an aversive motivational drive. Science 357:1149–1155. 10.1126/science.aan6747 - DOI - PMC - PubMed
    1. Bayguinov PO, Ma Y, Gao Y, Zhao X, Jackson MB (2017) Imaging voltage in genetically defined neuronal subpopulations with a Cre recombinase-targeted hybrid voltage sensor. J Neurosci 37:9305–9319. 10.1523/JNEUROSCI.1363-17.2017 - DOI - PMC - PubMed
    1. Blackburn CC, Sachs MB (1989) Classification of unit types in the anteroventral cochlear nucleus: PST histograms and regularity analysis. J Neurophysiol 62:1303–1329. 10.1152/jn.1989.62.6.1303 - DOI - PubMed
    1. Blackburn CC, Sachs MB (1990) The representations of the steady-state vowel sound/e/in the discharge patterns of cat anteroventral cochlear nucleus neurons. J Neurophysiol 63:1191–1212. 10.1152/jn.1990.63.5.1191 - DOI - PubMed
    1. Bourk TR, Mielcarz JP, Norris BE (1981) Tonotopic organization of the anteroventral cochlear nucleus of the cat. Hear Res 4:215–241. 10.1016/0378-5955(81)90008-3 - DOI - PubMed

Publication types

LinkOut - more resources