. 2023 Jul;131(1):47-55.
doi: 10.1016/j.bja.2023.01.008. Epub 2023 Feb 13.

Distinct pathophysiological characteristics in developing muscle from patients susceptible to malignant hyperthermia

Affiliations

Distinct pathophysiological characteristics in developing muscle from patients susceptible to malignant hyperthermia

Lourdes Figueroa et al. Br J Anaesth. 2023 Jul.

Abstract

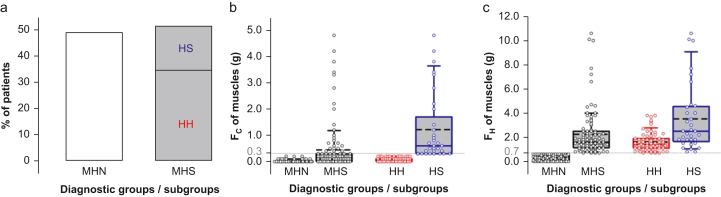
Background: Most patients with malignant hyperthermia susceptibility diagnosed by the in vitro caffeine-halothane contracture test (CHCT) develop excessive force in response to halothane but not caffeine (halothane-hypersensitive). Hallmarks of halothane-hypersensitive patients include high incidence of musculoskeletal symptoms at rest and abnormal calcium events in muscle. By measuring sensitivity to halothane of myotubes and extending clinical observations and cell-level studies to a large group of patients, we reach new insights into the pathological mechanism of malignant hyperthermia susceptibility.

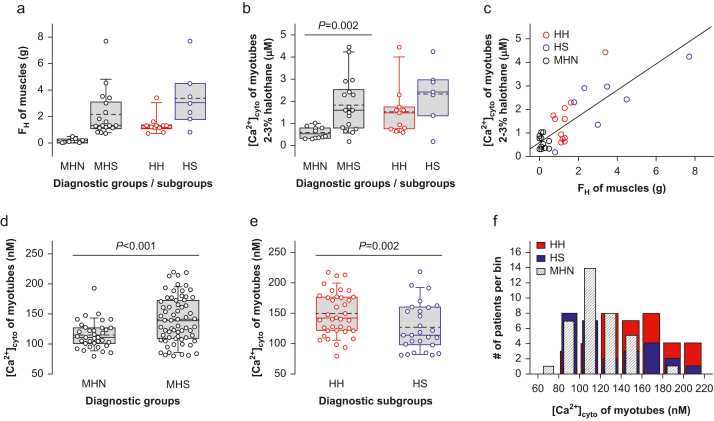
Methods: Patients with malignant hyperthermia susceptibility were classified into subgroups HH and HS (positive to halothane only and positive to both caffeine and halothane). The effects on [Ca2+]cyto of halothane concentrations between 0.5 and 3 % were measured in myotubes and compared with CHCT responses of muscle. A clinical index that summarises patient symptoms was determined for 67 patients, together with a calcium index summarising resting [Ca2+]cyto and spontaneous and electrically evoked Ca2+ events in their primary myotubes.

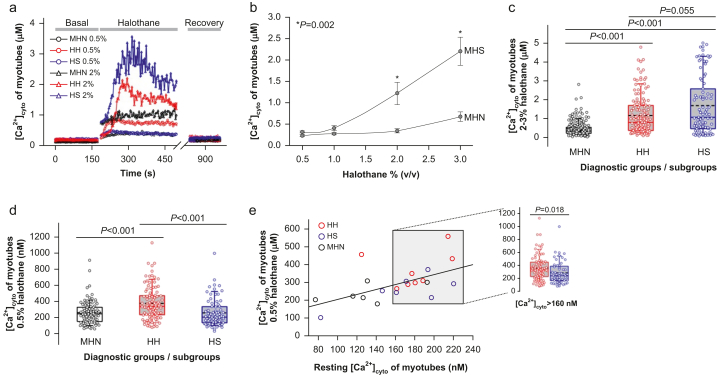
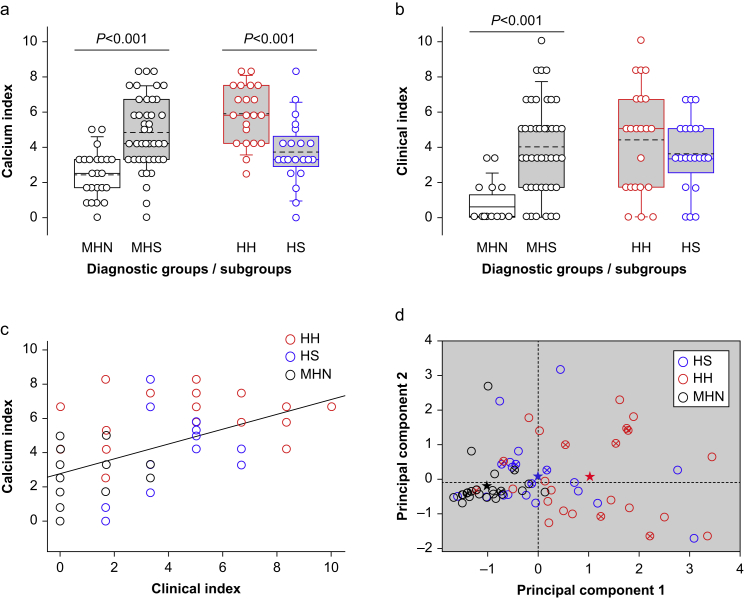
Results: Halothane-hypersensitive myotubes showed a higher response to halothane 0.5% than the caffeine-halothane hypersensitive myotubes (P<0.001), but a lower response to higher concentrations, comparable with that used in the CHCT (P=0.055). The HH group had a higher calcium index (P<0.001), but their clinical index was not significantly elevated vs the HS. Principal component analysis identified electrically evoked Ca2+ spikes and resting [Ca2+]cyto as the strongest variables for separation of subgroups.

Conclusions: Enhanced sensitivity to depolarisation and to halothane appear to be the primary, mutually reinforcing and phenotype-defining defects of halothane-hypersensitive patients with malignant hyperthermia susceptibility.

Keywords: calcium signalling; excitation–contraction coupling; malignant hyperthermia; skeletal muscle; volatile anaesthetics.


Conflict of interest statement

The authors declare that they have no conflict of interest.

Figures

Fig 1
Fig 1
Classification of patients by caffeine–halothane contracture test in a cohort of 195 patients. (a) Percentages of patients in each malignant hyperthermia (MH) diagnostic group (95 MHN, 100 MHS), and subgroups (67 HH, 33 HS). (b) Contractile force in response to caffeine 2 mM (FC) in biopsied muscle strips. (c) Contractile force in response to halothane 3 vol% (FH) in biopsied muscle strips. The threshold responses for a positive diagnosis were FC≥0.3 g, and FH≥0.7 g (dotted lines). Patients were diagnosed as ‘malignant hyperthermia negative’ (MHN) if the force was below the threshold for both agonists, and ‘malignant hyperthermia susceptible’ (MHS) if at least one of the exposures exceeded the threshold. Box plots show the quartiles, the 5th and 95th percentiles (whiskers), median (dissecting solid line), and mean (dissecting dashed line). Symbols plot averages in three muscle strips per patient. Distributions satisfying normality and equality of deviation were compared by t-test, otherwise by Mann–Whitney rank-sum test.
Fig 2
Fig 2
Responses to halothane and resting [Ca2+]cyto. (a) Contractile force in response to halothane 3 vol% (FH) in biopsied muscle strips from 29 patients with personal or family history of malignant hyperthermia (11 MHN, 18 MHS; 11 HH, 7 HS). Symbols plot averages in three muscle strips per patient. (b) Maximum [Ca2+]cyto in response to halothane 2–3 vol% in myotubes derived from patients in (a). (c) Responses to halothane of muscle strips vs average responses in myotubes derived from the same patients (data from panels a and b). The first-order regression line is represented (r=0.82; N=29; P of no correlation <0.001). (d and e) Resting [Ca2+]cyto in myotubes for major diagnostic groups (36 MHN, 65 MHS), and MHS subgroups (38 HH, 27 HS). For panels (b), (d), and (e), the symbols represent data from 10 to 30 myotubes. (f) Distribution of resting [Ca2+]cyto in myotubes for each patient studied.
Fig 3
Fig 3
Concentration dependence of myotube responses to halothane. (a) Representative traces [Ca2+]cyto (t) of responses of single patient-derived myotubes to halothane 0.5 % (circles) and halothane 2 % (triangles). (b) Maximum [Ca2+]cyto response of myotubes vs concentration of halothane. Symbols plot mean (standard error of the mean [sem]) for patients (variable numbers of patients, N, were included, depending on concentration: 6–10 MHN, 10–18 MHS). Significant differences between diagnostic groups are shown with an asterisk. (c, d) Maximum [Ca2+]cyto reached at 0.5 vol% and at 2–3 vol% halothane in myotubes derived from patients with personal or family history of malignant hyperthermia. Box plots represent the distribution of single myotube maxima (cells measured at the two concentrations were 96–179 MHN, 101–140 HH, 75–91 HS). (e) Maximum [Ca2+]cyto in halothane 0.5 % vs the corresponding resting value averaged for individual patients, with first order regression line (r=0.58; N=21; P of no correlation=0.005). The grey box highlights symbols for patients with average resting [Ca2+]cyto values >160 nM. The inset shows maximum [Ca2+]cyto in the response to halothane 0.5 % for each myotube (83 HH, 53 HS) from patients included in the box. MHN, malignant hyperthermia negative; MHS, malignant hyperthermia susceptible.
Fig 4
Fig 4
Quantitative indexes of disease in patients and derived myotubes. (a) Calcium index of malignant hyperthermia diagnostic groups and MHS subgroups. Symbols represent individual values for 24 MHN and 43 MHS (22 HH, 21 HS). The values of variables used to derive the calcium index are listed in Table 1. (b) Clinical index by groups and MHS subgroups. The variables used to derive the clinical index are described in Methods. (c) Relationship between calcium index and clinical index. r=0.56; N=67; P of no correlation <0.001. Distributions satisfying normality and equality of deviation were compared by t-test, otherwise by Mann–Whitney rank-sum test. (d) Plots of the two first principal components of the four variables measured in myotubes (listed in Table 1). Symbols represent PC1 and PC2 values from individual patients from (a). Stars plot group means. Note that they differ by the abscissa (PC1), but only minimally by the ordinate (PC2). Crossed circle symbols represent not Fx patients.

Comment in

Similar articles

Cited by

References

    1. Rosenberg H., Pollock N., Schiemann A., Bulger T., Stowell K. Malignant hyperthermia: a review. Orphanet J Rare Dis. 2015;10:93. - PMC - PubMed
    1. Riazi S., Kraeva N., Hopkins P.M. Malignant hyperthermia in the post-genomics era: new perspectives on an old concept. Anesthesiology. 2018;128:168–180. - PMC - PubMed
    1. Larach M.G. Standardization of the caffeine halothane muscle contracture test. North American Malignant Hyperthermia Group. Anesth Analg. 1989;69:511–515. - PubMed
    1. Hopkins P.M., Rüffert H., Snoeck M.M., et al. European Malignant Hyperthermia Group guidelines for investigation of malignant hyperthermia susceptibility. Br J Anaesth. 2015;115:531–539. - PubMed
    1. Endo M. Calcium-induced calcium release in skeletal muscle. Physiol Rev. 2009;89:1153–1176. - PubMed