. 2023 Feb;12(2):e12306.
doi: 10.1002/jev2.12306.

Helicobacter pylori-derived outer membrane vesicles contribute to Alzheimer's disease pathogenesis via C3-C3aR signalling

Affiliations

Helicobacter pylori-derived outer membrane vesicles contribute to Alzheimer's disease pathogenesis via C3-C3aR signalling

Junhua Xie et al. J Extracell Vesicles. 2023 Feb.

Abstract

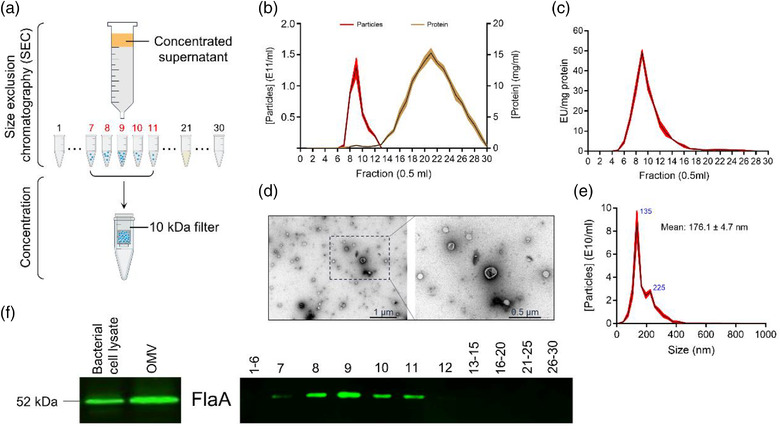
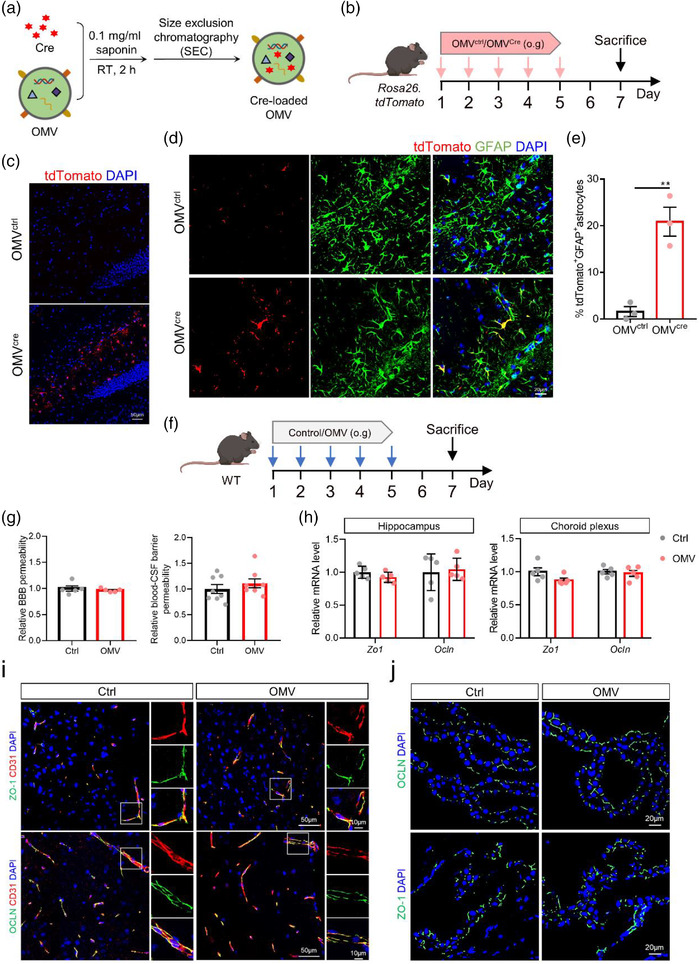
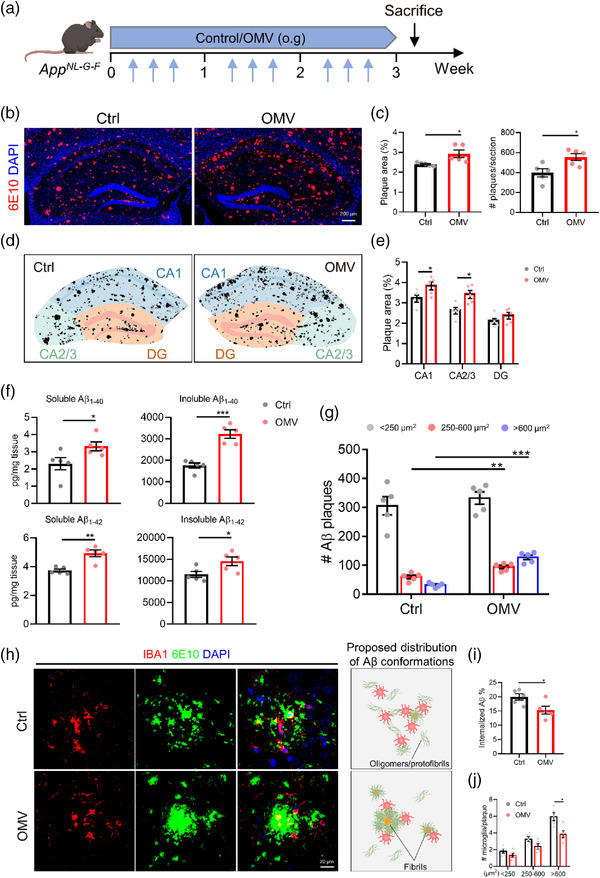
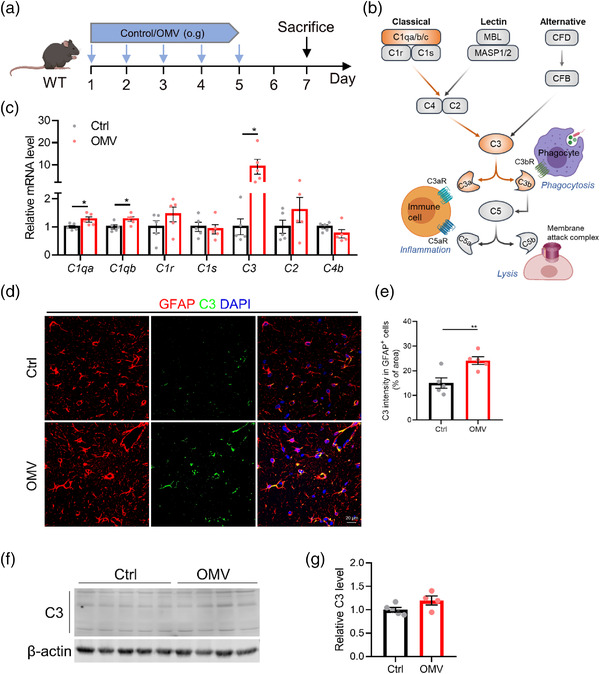
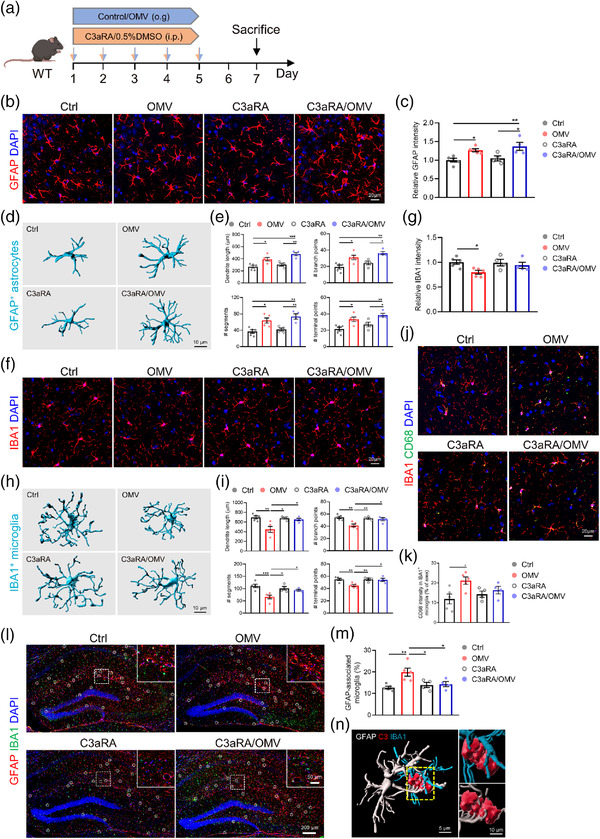
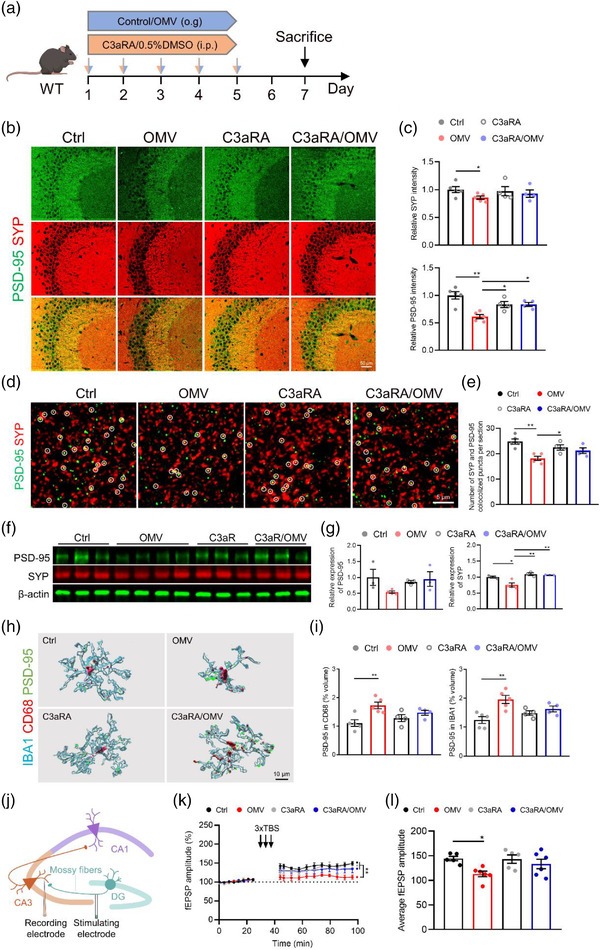
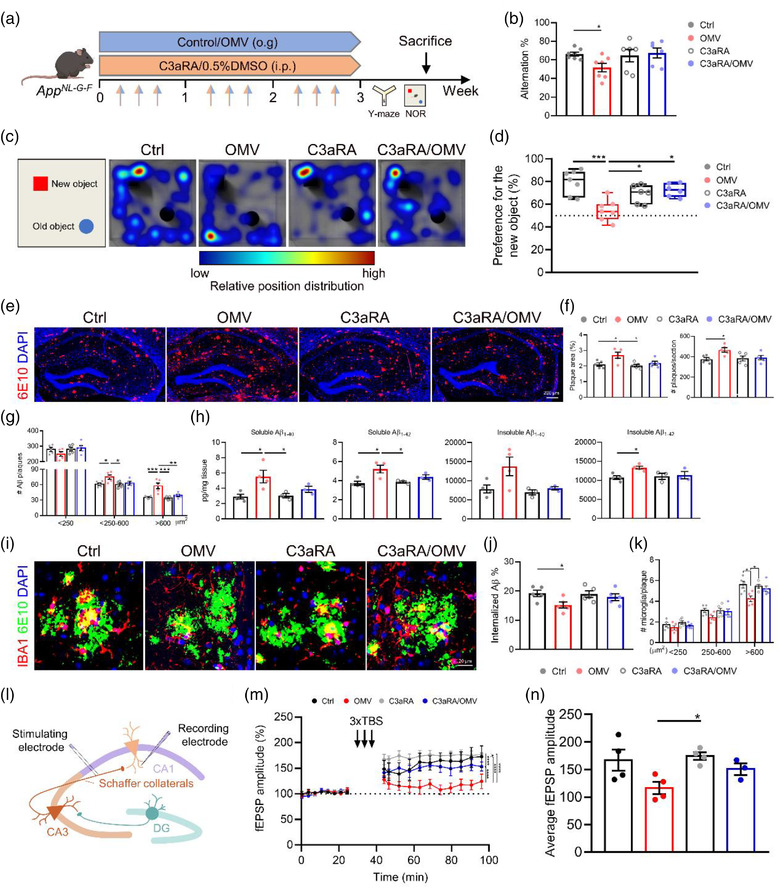
The gut microbiota represents a diverse and dynamic population of microorganisms that can influence the health of the host. Increasing evidence supports the role of the gut microbiota as a key player in the pathogenesis of neurodegenerative diseases, including Alzheimer's disease (AD). Unfortunately, the mechanisms behind the interplay between gut pathogens and AD are still elusive. It is known that bacteria-derived outer membrane vesicles (OMVs) act as natural carriers of virulence factors that are central players in the pathogenesis of the bacteria. Helicobacter pylori (H. pylori) is a common gastric pathogen and H. pylori infection has been associated with an increased risk to develop AD. Here, we are the first to shed light on the role of OMVs derived from H. pylori on the brain in healthy conditions and on disease pathology in the case of AD. Our results reveal that H. pylori OMVs can cross the biological barriers, eventually reaching the brain. Once in the brain, these OMVs are taken up by astrocytes, which induce activation of glial cells and neuronal dysfunction, ultimately leading to exacerbated amyloid-β pathology and cognitive decline. Mechanistically, we identified a critical role for the complement component 3 (C3)-C3a receptor (C3aR) signalling in mediating the interaction between astrocytes, microglia and neurons upon the presence of gut H. pylori OMVs. Taken together, our study reveals that H. pylori has a detrimental effect on brain functionality and accelerates AD development via OMVs and C3-C3aR signalling.

Keywords: Helicobacter pylori; Alzheimer's disease; C3; bacterial extracellular vesicles (bEVs); complement; gut-brain axis; outer membrane vesicles (OMVs).


Conflict of interest statement

The authors have declared that no conflict of interest exists.

Figures

FIGURE 1
FIGURE 1
Characterization of Helicobacter pylori OMVs. (a) Graphical illustration of H. pylori OMV isolation from bacterial cultures. (b) Particle and protein concentration in the different SEC fractions (0.5 ml per fraction) were determined using nanoparticle tracking analysis (NTA; red) and Nanodrop (brown), respectively. Data show all 30 fractions. (c) Limulus amebocyte lysate (LAL) assay quantified LPS activity levels in the different SEC fractions. (d) Representative negative staining TEM images of purified H. pylori OMVs from SEC fractions #7–11. Scale bars: 1 μm (left) and 0.5 μm (right). (e) Size distributions of purified H. pylori OMVs from SEC fractions #7‐11 analysed by NTA. (f) Western blot analysis of FlaA in bacterial cell lysate and purified H. pylori OMVs from SEC fractions #7–11 (left; 10 μg total protein was loaded) and all fractions separately (right; 20 μl per fraction was loaded). The graphs are shown as mean ± SEM. Data in b, c and d are shown for at least three biological replicates.
FIGURE 2
FIGURE 2
Helicobacter pylori OMVs migrate to the brain and are taken up by astrocytes. (a) Graphical illustration of saponin‐assisted Cre‐recombinase loading into H. pylori OMVs and repurification with SEC. (b) Treatment schedule of Rosa26.tdTomato mice treated with unmodified (OMVctrl) or Cre‐recombinase‐loaded (OMVcre) H. pylori OMVs. (c) Representative images of tdTomato staining in the hippocampus of Rosa26.tdTomato orally gavaged with OMVctrl and OMVCre. Scale bars, 50 μm. (d) Representative images of tdTomato and GFAP co‐staining in the hippocampus. Scale bars, 20 μm (left) and 10 μm (right). (e) Quantification of tdTomato+GFAP+ astrocytes. (f) Treatment schedule of WT mice treated with control or H. pylori OMVs. (g) Relative permeability of BBB and blood‐CSF barrier in control and OMV‐treated mice. (h) Relative gene expression of tight junctions Zo1 and Ocln in the hippocampus (left) and choroid plexus (right) in control and OMV‐treated mice. (i) Representative images of ZO‐1/CD31and OCLN/CD31 staining in the hippocampus control and OMV‐treated mice. Scale bars, 50 and 10 μm (insert). (j) Representative images of ZO‐1 and OCLN staining in choroid plexus control and OMV‐treated mice. Scale bars, 20 μm. The graphs are shown as the mean ± SEM and the datapoints are biological replicates. Images are representative for 3 (c and d) or 5 (h) biological replicates. Statistical significance was determined by two‐tailed Student's t‐test. **p < 0.01.
FIGURE 3
FIGURE 3
Helicobacter pylori OMVs promote AD pathology in AppNL‐G‐F mice. (a) Treatment schedule of AppNL‐G‐F mice treated with control or H. pylori OMVs. (b) Representative images of 6E10 staining in the hippocampus. Scale bars, 200 μm. (c) Quantification of Aβ plaque area (left) and number (right) in the hippocampus. (d) Corresponding masks used to quantify plaque load in subregions of the hippocampus. (e) Quantification of the plaque load in hippocampal subregions. (f) Soluble and insoluble Aβ1‐40 and Aβ1‐42 levels in the hippocampus. (g) Quantification of Aβ plaque size distribution in the hippocampus. (h) Representative images of IBA1+ microglia and 6E10 staining in the hippocampus and proposed Aβ conformations in the different plaque types. Scale bars, 20 μm. (i) Quantification of the percentage of overlay area of IBA1+ microglia and Aβ plaque. 3–5 plaques are analysed per mouse and 5 mice per group. (j) Plaques were divided into small (< 250 μm2), medium (250‐600 μm2), and large (> 600 μm2) plaques, and the number of microglia per plaque was quantified. 3–5 plaques are analysed per mouse and 5 mice per group. The graphs are shown as the mean ± SEM and the datapoints are biological replicates. Images are representative for 5 (b and h) biological replicates. Statistical significance was determined by two‐tailed Student's t‐test. *p < 0.05, **p < 0.01, ***p < 0.001.
FIGURE 4
FIGURE 4
Helicobacter pylori OMVs promote C3 activation in WT mice. (a) Treatment schedule of AppNL‐G‐F mice treated with control or H. pylori OMVs. (b) Simplified schematic of the complement pathway illustrating selected proteins. Proteins involved in the classical complement pathway and upregulated by H. pylori OMVs treatment are highlighted in orange. (c) Gene expression of complement components in the hippocampus. (d) Representative images of GFAP and C3 staining in CA3 region of hippocampus. Scale bars, 20 μm. (e) Quantification of the percentage of overlay area of C3 in astrocytes. (f) Western blot analysis of C3 expression in the hippocampus. Individual lanes are biological duplicates (n = 4 or 5). (g) Quantification of the relative C3 levels in the hippocampus. The graphs are shown as the mean ± SEM and the datapoints are biological replicates. Images are representative for 5 (d) biological replicates. Statistical significance was determined by two‐tailed Student's t‐test. *p < 0.05, **p < 0.01
FIGURE 5
FIGURE 5
Helicobacter pylori OMVs increase glial reactivity via C3‐C3aR signalling in WT mice. (a) Treatment schedule of WT mice treated with control/H. pylori OMVs and 0.5%DMSO/C3aRA. (b) Representative images of GFAP staining in CA3 region of hippocampus. Scale bars, 20 μm. (c) Quantification of the relative GFAP intensity in CA3 region of hippocampus. (d) Imaris‐based 3D morphometric reconstruction analysis of GFAP+ astrocytes in CA3 region of hippocampus. Scale bars, 10 μm. (e) Imaris‐based quantification of cell morphology of GFAP+ astrocytes in CA3 region of hippocampus. (f) Representative images of IBA1 staining in CA3 region of hippocampus. Scale bars, 20 μm. (g) Quantification the number of IBA1+ microglia in CA3 region of hippocampus. (h) Imaris‐based 3D morphometric reconstruction analysis of IBA1+ microglia in CA3 region of hippocampus. (i) Imaris‐based quantification of cell morphology of IBA1+ microglia in CA3 region of hippocampus. Scale bars, 10 μm. (j) Representative images of IBA1 and CD68 staining in CA3 region of hippocampus. Scale bars, 20 μm. (k) Quantification of the percentage of CD68 intensity in IBA1+ microglia in CA3 region of hippocampus. (l) Representative images of GFAP and IBA1 staining in the hippocampus. Scale bars, 200 and 50 μm (insert). (m) Quantification of the percentage of astrocyte colocalized microglia. (n) Imaris‐based 3D reconstruction of the interaction between astrocytes and microglia via C3. Scale bars, 5 μm (left) and 10 μm (right). The graphs are shown as the mean ± SEM and the datapoints are biological replicates. Images are representative for 4 or 5 (b, f, j and l) biological replicates. Statistical significance was determined by two‐way ANOVA Bonferroni's multiple comparisons. *p < 0.05, **p < 0.01, ***p < 0.001.
FIGURE 6
FIGURE 6
Helicobacter pylori OMVs induce synaptic deficits via C3‐C3aR signalling in WT mice. (a) Treatment schedule of WT mice treated with control/H. pylori OMVs and 0.5%DMSO/C3aRA. (b) Representative SYP and PSD‐95 co‐immunostaining in CA3 region of hippocampus. Scale bars, 50 μm. (c) Quantification of the relative intensity of SYP (upper) and PSD‐95 (lower). (d) Representative high magnification confocal images of SYP and PSD‐95 coimmunostaining in CA3 region of hippocampus of WT. Scale bars, 5 μm. (e) Quantification of the number of colocalized puncta of SYP and PSD‐95. (f) Western blot analysis of SYP and PSD‐95 in the hippocampus. Individual lanes are biological replicates (n = 3–4). (g) Quantification of relative SYP and PSD‐95 expression in the hippocampus. (h) Imaris‐based 3D reconstruction analysis of IBA1/CD68/PSD‐95 staining in CA3 region of hippocampus. Scale bars, 10 μm. (i) Quantification of the percentage of PSD‐95+ volume inside CD68+ phagosome (upper) and IBA1+microglia (lower). (j) Schematic diagram indicating the general experimental set‐up of LTP measurement. (k‐l) fEPSP amplitude recordings over time (k) and the average of the fEPSP amplitude recordings (l) after LTP induction in CA3 mossy fiber synapses. The graphs are shown as the mean ± SEM and the datapoints are biological replicates. Images are representative for 4 or 5 (b and d) biological replicates. Statistical significance was determined by two‐way ANOVA Bonferroni's multiple comparisons. *p < 0.05, **p < 0.01
FIGURE 7
FIGURE 7
C3aR antagonist treatment blocks the effects of Helicobacter pylori OMVs on AD pathology and memory function in AppNL‐G‐F mice. (a) Treatment schedule of AppNL‐G‐F mice treated with control/H. pylori OMVs and 0.5%DMSO/C3aRA. (b) Quantification of Y‐maze spontaneous alternation. (c) Representative heat maps of tracks in NOR test. (d) The percentage of NOR discrimination. (e) Representative images of 6E10 staining in the hippocampus. Scale bars, 200 μm. (f) Quantification of the plaque area (left) and number (right) in the hippocampus. (g) Quantification of Aβ plaque size distribution in the hippocampus. (h) Soluble and insoluble Aβ1‐40 and Aβ1‐42 levels in the hippocampus. (i) Representative images of IBA1 and 6E10 staining in the hippocampus. Scale bars, 20 μm. (j) Quantification of the percentage of overlay area of microglia and Aβ plaque. (k) Plaques were divided into small (< 250 μm2), medium (250‐600 μm2), and large (> 600 μm2), the number of microglia per plaque was quantified. (l) Schematic diagram indicating the general experimental set‐up of LTP measurement in AppNL‐G‐F mice. (m‐n) fEPSP amplitude recordings over time (m) and the average of the fEPSP amplitude recordings (n) after LTP induction in CA1 Schaffer collateral synapses. The graphs are shown as the mean ± SEM and the datapoints are biological replicates. Images are representative for 5 (c, e and i) or 3–4 (m and n) biological replicates. Statistical significance was determined by two‐way ANOVA Bonferroni's multiple comparisons. *p < 0.05, **p < 0.01, ***p < 0.001, ****p < 0.0001.

References

    1. Albaret, G. , Sifré, E. , Floch, P. , Laye, S. , Aubert, A. , Dubus, P. , Azzi‐Martin, L. , Giese, A. , Salles, N. , Mégraud, F. , Varon, C. , Lehours, P. , & Roubaud‐Baudron, C. (2020). Alzheimer's disease and Helicobacter pylori infection: Inflammation from stomach to brain? Journal of Alzheimers Disease, 73, 801–809. - PubMed
    1. Alvarez, J. I. , Katayama, T. , & Prat, A. (2013). Glial influence on the blood brain barrier. Glia, 61, 1939–1958. - PMC - PubMed
    1. Bartels, T. , De Schepper, S. , & Hong, S. (2020). Microglia modulate neurodegeneration in Alzheimer's and Parkinson's diseases. Science, 370, 66–69. - PubMed
    1. Berstad, A. E. , Høgåsen, K. , Bukholm, G. , Moran, A. P. , & Brandtzaeg, P. (2001). Complement activation directly induced by Helicobacter pylori . Gastroenterology, 120, 1108–1116. - PubMed
    1. Bielaszewska, M. , Rüter, C. , Bauwens, A. , Greune, L. , Jarosch, K.‐A. , Steil, D. , Zhang, W. , He, X. , Lloubes, R. , Fruth, A. , Kim, K. S. , Schmidt, M. A. , Dobrindt, U. , Mellmann, A. , & Karch, H. (2017). Host cell interactions of outer membrane vesicle‐associated virulence factors of enterohemorrhagic Escherichia coli O157: Intracellular delivery, trafficking and mechanisms of cell injury. PLoS Pathogens, 13, e1006159. - PMC - PubMed

Publication types