. 2023 Feb 15;14(2):130.
doi: 10.1038/s41419-023-05658-7.

Long noncoding RNA ENST00000436340 promotes podocyte injury in diabetic kidney disease by facilitating the association of PTBP1 with RAB3B

Affiliations

Long noncoding RNA ENST00000436340 promotes podocyte injury in diabetic kidney disease by facilitating the association of PTBP1 with RAB3B

Jinxiu Hu et al. Cell Death Dis. .

Abstract

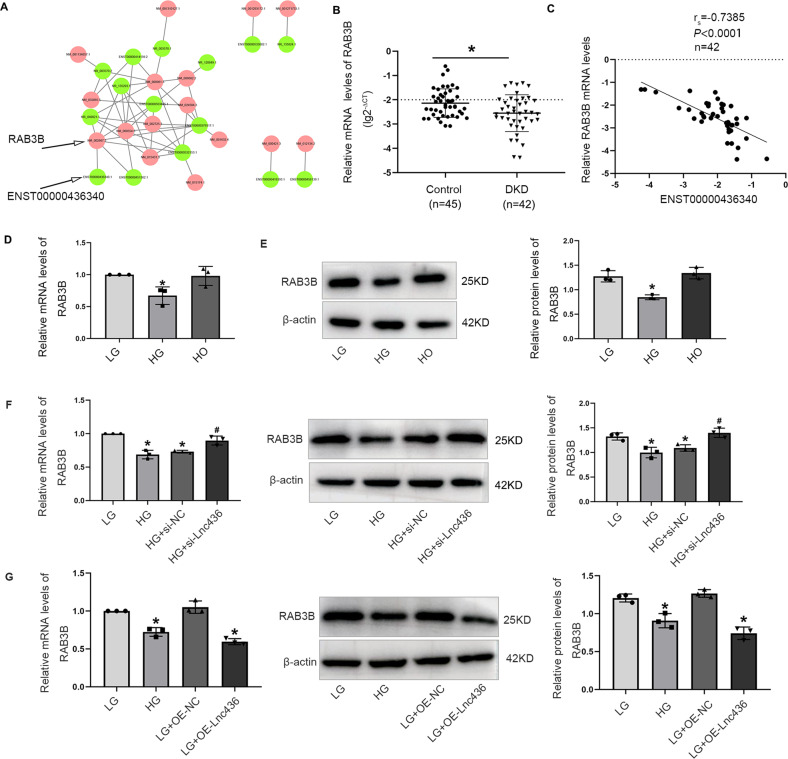
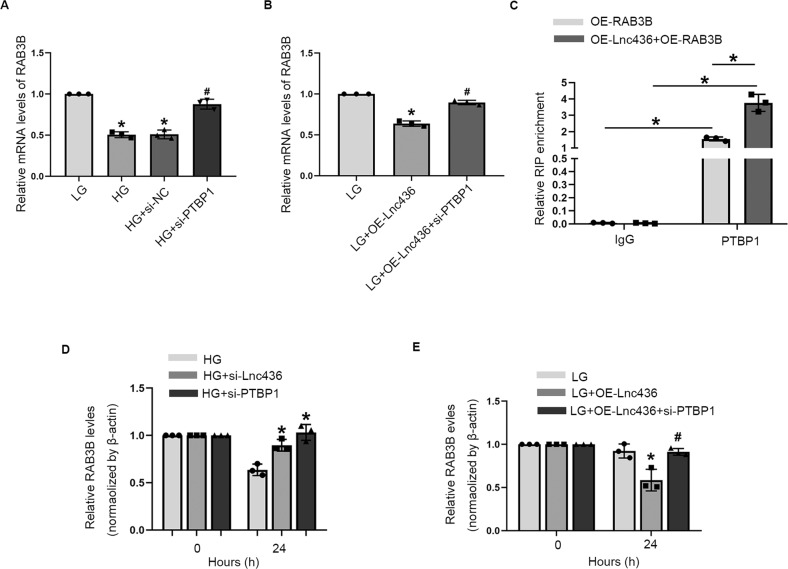
Dysfunction of podocytes has been regarded as an important early pathologic characteristic of diabetic kidney disease (DKD), but the regulatory role of long noncoding RNAs (lncRNAs) in this process remains largely unknown. Here, we performed RNA sequencing in kidney tissues isolated from DKD patients and nondiabetic renal cancer patients undergoing surgical resection and discovered that the novel lncRNA ENST00000436340 was upregulated in DKD patients and high glucose-induced podocytes, and we showed a significant correlation between ENST00000436340 and kidney injury. Gain- and loss-of-function experiments showed that silencing ENST00000436340 alleviated high glucose-induced podocyte injury and cytoskeleton rearrangement. Mechanistically, we showed that fat mass and obesity- associate gene (FTO)-mediated m6A induced the upregulation of ENST00000436340. ENST00000436340 interacted with polypyrimidine tract binding protein 1 (PTBP1) and augmented PTBP1 binding to RAB3B mRNA, promoted RAB3B mRNA degradation, and thereby caused cytoskeleton rearrangement and inhibition of GLUT4 translocation to the plasma membrane, leading to podocyte injury and DKD progression. Together, our results suggested that upregulation of ENST00000436340 could promote podocyte injury through PTBP1-dependent RAB3B regulation, thus suggesting a novel form of lncRNA-mediated epigenetic regulation of podocytes that contributes to the pathogenesis of DKD.


Conflict of interest statement

The authors declare no competing interests.

Figures

Fig. 1
Fig. 1. LncRNA ENST00000436340 was upregulated in human DKD.
Hierarchical clustering analysis of DEncRNAs (A) and DEmRNAs (C) between DKD and control groups. The horizontal axis represents the names of the samples. The vertical axis represents the names of DEncRNAs (A) and DEmRNAs (C). Each column indicates a sample and each row indicates a gene. The color scale indicates log10 (RPKM + 1) and intensity increases from blue to red, which indicates down- and up-regulation, respectively. A volcano plot exhibiting the DEncRNAs (B) DEmRNAs (D) in which horizontal axis represents the fold changes of RNA expression in different simples. The vertical axis represents the statistical significance of the differentially expressed RNAs. Horizontal dotted line refers to Q value (the corrected P value) = 0.05; vertical dotted lines refer to 2-fold changes in upregulation or downregulation; red points indicate that RNAs are significantly upregulated while green points indicate significantly downregulated, and gray shows no significant differences. E Real-time PCR detects the expression of Lnc436 in 45 kidney biopsy tissues from DKD patients and 42 normal kidney tissues from non-diabetic renal cancer patients undergoing surgical resection. *P < 0.05 vs Control. F Representative images of Lnc436 and podocyte-specific marker synaptopodin in the glomeruli of kidney. Arrows indicate colocalization of Lnc436 and synaptopodin. Plots of pixel intensity of white boxed region from merged images (right). Scale bar = 50 μm. G Real-time PCR detects the serum Lnc436 levels in Control (n = 47), microalbuminuria (n = 25), and macroalbuminuria (n = 23). *P < 0.05 vs. Control. H The correlation between serum ENST00000436340 levels and serum albumin, BUN, serum creatinine, and ACR. Lnc436: LncRNA ENST00000436340.
Fig. 2
Fig. 2. ENST00000436340 was involved in high glucose-induced podocyte injury and cytoskeleton rearrangement.
A 5′ and 3′rapid amplification of cDNA ends (RACE) assays in podocytes to detect the whole sequence of ENST00000436340. Left: a gel electrophoresis image of PCR products from the 5′-RACE and 3′-RACE assays. Right: sequencing of PCR products. B Northern blot analysis to confirm the length and expression of the ENST00000436340 in podocytes. β-actin was used as a loading control. C Real-time PCR analyses show the level of ENST00000436340 in different groups of podocytes. D Real-time PCR analyses show the mRNA levels of Demin and ZO-1 in podocytes treated with ENST00000436340 siRNA (si-Lnc436) or negative control (si-NC) in the presence of HG. E Western blot analyses show the protein levels of Desmin and ZO-1 in podocytes treated with ENST00000436340 siRNA (si-Lnc436) or negative control (si-NC) in the presence of HG. F Representative immunofluorescence images of Desmin, and ZO-1 in podocytes treated with ENST00000436340 siRNA (si-Lnc436) or negative control (si-NC) in the presence of HG. Scale bar = 50 μm. G Representative immunofluorescence images of F-actin in podocytes treated with ENST00000436340 siRNA (si-Lnc436) or negative control (si-NC) in the presence of HG. Scale bar = 50 μm. H Representative migration results of podocytes treated with ENST00000436340 siRNA (si-Lnc436) or negative control (si-NC) in the presence of HG. Scale bar = 100 μm. I real-time PCR analyses show the mRNA level of Demin and ZO-1 in podocytes treated with ENST00000436340 overexpression plasmid (OE-Lnc436) or control (OE-NC) vectors in the presence of LG. J Western blot analyses show the protein level of Desmin and ZO-1 in podocytes treated with ENST00000436340 overexpression plasmid (OE-Lnc436) or control (OE-NC) vectors in the presence of LG. K Representative immunofluorescence images of Desmin, and ZO-1 in podocytes treated with ENST00000436340 overexpression plasmid (OE-Lnc436) or control (OE-NC) vectors in the presence of LG. Scale bar = 50 μm. L Representative immunofluorescence images of F-actin in podocytes treated with ENST00000436340 overexpression plasmid (OE-Lnc436) or control (OE-NC) vectors in the presence of LG. Scale bar = 50 μm. M Representative migration results of podocytes treated with ENST00000436340 overexpression plasmid (OE-Lnc436) or control (OE-NC) vectors in the presence of LG. Scale bar = 100 μm. Data are shown as mean ± SD. *P < 0.05 vs LG, #P < 0.05 vs. HG. The experiment was performed in triplicate.
Fig. 3
Fig. 3. ENST00000436340 negatively regulated the expression of RAB3B.
A DElncRNA-DEmRNA networks. The green dots represent the DElncRNAs while the red dots represent the predicted target DEmRNAs of DElncRNAs, and the lines represent the relationship between DElncRNAs and DEmRNAs. B Real-time PCR analyses of RAB3B mRNA expression in DKD kidney tissues. *P < 0.05 vs Control. C The correlation between ENST00000436340 level with RAB3B expression in kidney tissue samples. D Real-time PCR analyses show the mRNA levels of RAB3B in different groups of podocytes. *P < 0.05 vs. LG. E Western blot analyses show the protein levels of RAB3B in different groups of podocytes. *P < 0.05 vs. LG. F Real-time PCR and Western blot analyses show the mRNA and protein levels of RAB3B in podocytes treated with ENST00000436340 siRNA (si-Lnc436) or negative control (si-NC) in the presence of HG. *P < 0.05 vs. LG, #P < 0.05 vs HG. G Real-time PCR and Western blot analyses show the mRNA and protein levels of RAB3B in podocytes treated with ENST00000436340 overexpression plasmid (OE-Lnc436) or control (OE-NC) vectors in the presence of LG. *P < 0.05 vs LG. Data are shown as mean ± SD. The experiment was performed in triplicate.
Fig. 4
Fig. 4. RAB3B was involved in high glucose-induced podocytes injury and cytoskeleton rearrangement.
A Real-time PCR analyses show the mRNA levels of Demin and ZO-1 in podocytes treated with RAB3B siRNA (si-RAB3B) or negative control (si-NC) in the presence of LG. B Western blot analyses show the protein levels of Desmin and ZO-1 in podocytes treated with RAB3B siRNA (si-RAB3B) or negative control (si-NC) in the presence of LG. C Representative immunofluorescence images of Desmin and ZO-1 in podocytes treated with RAB3B siRNA (si-RAB3B) or negative control (si-NC) in the presence of LG. Scale bar = 50 μm. D Representative images of F-actin in podocytes treated with RAB3B siRNA (si-RAB3B) or negative control (si-NC) in the presence of LG. Scale bar = 50 μm. E Representative migration results of podocytes treated with RAB3B siRNA (si-RAB3B) or negative control (si-NC) in the presence of LG. Scale bar = 100 μm. F Real-time PCR analyses show the mRNA levels of Demin and ZO-1 in podocytes treated with RAB3B overexpression plasmid (OE-RAB3B) or control (OE-NC) vectors in the presence of HG. G Western blot analyses show the protein levels of Desmin and ZO-1 in podocytes treated with RAB3B overexpression plasmid (OE-RAB3B) or control (OE-NC) vectors in the presence of HG. H Representative immunofluorescence images of Desmin and ZO-1 in podocytes treated with RAB3B overexpression plasmid (OE-RAB3B) or control (OE-NC) vectors in the presence of HG. Scale bar = 50 μm. I Representative images of F-actin in podocytes treated with RAB3B overexpression plasmid (OE-RAB3B) or control (OE-NC) vectors in the presence of HG. Scale bar = 50 μm. J Representative migration results of podocytes treated with RAB3B overexpression plasmid (OE-RAB3B) or control (OE-NC) vectors in the presence of HG. Scale bar = 100 μm. Data are shown as mean ± SD. *P < 0.05 vs. LG, #P < 0.05 vs. HG. The experiment was performed in triplicate.
Fig. 5
Fig. 5. RAB3B is essential for ENST00000436340-regulated high glucose-induced podocyte injury.
A real-time PCR analyses show the mRNA levels of Demin and ZO-1 in different groups of podocytes. B Western blot analyses show the protein levels of Desmin and ZO-1 in different groups of podocytes. C Representative immunofluorescence images of Desmin and ZO-1 in different groups of podocytes. Scale bar = 50 μm. D Representative images of F-actin in different groups of podocytes. Scale bar = 50 μm. (E) Representative migration results in different groups of podocytes. Scale bar = 100 μm. Data are shown as mean ± SD. *P < 0.05 vs. LG, #P < 0.05 vs. LG + OE-Lnc436. The experiment was performed in triplicate.
Fig. 6
Fig. 6. ENST00000436340 interacting with PTBP1.
A RNA-FISH showed that ENST00000436340 was distributed both in the cytoplasm and nucleus of podocytes. 18 s was used as the reference. Scale bar = 50 μm. B Subcellular fractionation assays verified that ENST00000436340(Lnc436) distributed both in the cytoplasm and nucleus of podocytes. C RNA pulldown assay showed that PTBP1 protein was enriched by ENST00000436340 in podocytes. β-actin was used as a negative control. D RIP was performed using anti-PTBP1 and control IgG antibodies, followed by real-time PCR to examine the enrichment of ENST00000436340(Lnc436). E Serial deletions of ENST00000436340 were used in RNA pulldown assays to map the PTBP1 binding region of ENST00000436340. F Serial deletions of PTBP1 were used in RNA pulldown assays to determine the region in PTBP1 that binds to ENST00000436340. Data are shown as mean ± SD. The experiment was performed in triplicate.
Fig. 7
Fig. 7. ENST00000436340 enhances PTBP1 binding to RAB3B mRNA to promote its degradation.
A real-time PCR analyses show the mRNA levels of RAB3B in podocytes treated with PTBP1 siRNA (si-PTBP1) or negative control (si-NC) in the presence of HG. *P < 0.05 vs. LG, #P < 0.05 vs. HG. B real-time PCR analyses show the mRNA levels of RAB3B in different groups of podocytes. *P < 0.05 vs. LG, #P < 0.05 vs. LG + OE-Lnc436. C RIP was performed to determine the interaction between RAB3B mRNA and PTBP1 protein using anti-PTBP1 or IgG in the presence or absence of ENST00000436340(Lnc436) coexpression. D Podocytes transfected with ENST00000436340 siRNA(si-Lnc436) or PTBP1 siRNA(si-PTBP1) were treated with ActD (5 μg/ml) for 0 h or 24 h and RAB3B mRNA abundance, relative to β-actin, was quantified by real-time PCR. *P < 0.05 vs. HG. (E) Podocytes transfected with ENST00000436340 overexpression plasmid vector (OE-Lnc436) alone or together with PTBP1 siRNA(si-PTBP1) were treated with ActD (5 μg/ml) for 0 h or 24 h and RAB3B mRNA abundance, relative to β-actin, was quantified by real-time PCR. *P < 0.05 vs LG, #P < 0.05 vs LG + OE-Lnc436. Data are shown as mean ± SD. The experiment was performed in triplicate.
Fig. 8
Fig. 8. GLUT4 plays a vital role in ENST00000436340/RAB3B-induced podocyte injury in DKD.
A Cells were transfected with HA-GLUT4 alone (Control), HA-GLUT4 and wild-type RAB3B (RAB3B WT), or HA-GLUT4 and RAB3B T36N mutant (RAB3B T36N), the surface-localized GLUT4 were detected by anti-HA antibody, and the mean fluorescence intensity was normalized to that of basal Control cells by using ImageJ/Fiji. Scale bar = 50 μm, *P < 0.05. B Representative images of the colocalization of RAB3B and GLUT4. Scale bar = 50 μm. Pearson’s correlation coefficient between RAB3B and GLUT4 was computed using the colocalization Finder of the ImageJ/Fiji software as indicated. C Cells were transfected with HA-GLUT4 alone (Control), HA-GLUT4, and ENST00000436340 overexpression plasmid without (OE-Lnc436) or with RAB3B overexpression plasmid (OE-Lnc436 + OE-RAB3B), the surface-localized GLUT4 were detected by anti-HA antibody, and the mean fluorescence intensity was normalized to that of basal Control cells by using ImageJ/Fiji. Scale bar = 50 μm, *P < 0.05. D Representative immunofluorescence images of Desmin and ZO-1 in different groups of podocytes. Scale bar = 50 μm. E real-time PCR analyses show the mRNA levels of Desmin and ZO-1 in podocytes treated with GLUT4 siRNA (si-GLUT4) or negative control (si-NC). *P < 0.05 vs Control. Data are shown as mean ± SD. The experiment was performed in triplicate. F Schematic model of the role of lncRNA ENST00000436340. FTO-mediated m6A induced the upregulation of ENST00000436340. ENST00000436340 interacted with PTBP1 and augmented PTBP1 binding to RAB3B mRNA and thereby promoted RAB3B mRNA degradation, caused cytoskeleton rearrangement and inhibition of GLUT4 translocation to the plasma membrane, leading to podocyte injury and DKD progression.

Similar articles

Cited by

References

    1. Li Y, Xu K, Xu K, Chen S, Cao Y, Zhan H. Roles of identified long noncoding RNA in diabetic nephropathy. J Diabetes Res. 2019;2019:5383010. doi: 10.1155/2019/5383010. - DOI - PMC - PubMed
    1. Zhang L, Long J, Jiang W, Shi Y, He X, Zhou Z, et al. Trends in chronic kidney disease in China. N. Engl J Med. 2016;375:905–6. doi: 10.1056/NEJMc1602469. - DOI - PubMed
    1. Gagliardini E, Novelli R, Corna D, Zoja C, Ruggiero B, Benigni A, et al. B7-1 is not induced in podocytes of human and experimental diabetic nephropathy. J Am Soc Nephrol. 2016;27:999–1005. doi: 10.1681/ASN.2015030266. - DOI - PMC - PubMed
    1. Zuo Y, Wang C, Sun X, Hu C, Liu J, Hong X, et al. Identification of matrix metalloproteinase-10 as a key mediator of podocyte injury and proteinuria. Kidney Int. 2021;100:837–49. doi: 10.1016/j.kint.2021.05.035. - DOI - PubMed
    1. Yuan JH, Yang F, Wang F, Ma JZ, Guo YJ, Tao QF, et al. A long noncoding RNA activated by TGF-beta promotes the invasion-metastasis cascade in hepatocellular carcinoma. Cancer Cell. 2014;25:666–81. doi: 10.1016/j.ccr.2014.03.010. - DOI - PubMed

Publication types

MeSH terms

Substances