. 2023 Feb 15;14(1):847.
doi: 10.1038/s41467-023-36518-9.

Molecular mechanisms of coronary artery disease risk at the PDGFD locus

Affiliations

Molecular mechanisms of coronary artery disease risk at the PDGFD locus

Hyun-Jung Kim et al. Nat Commun. .

Abstract

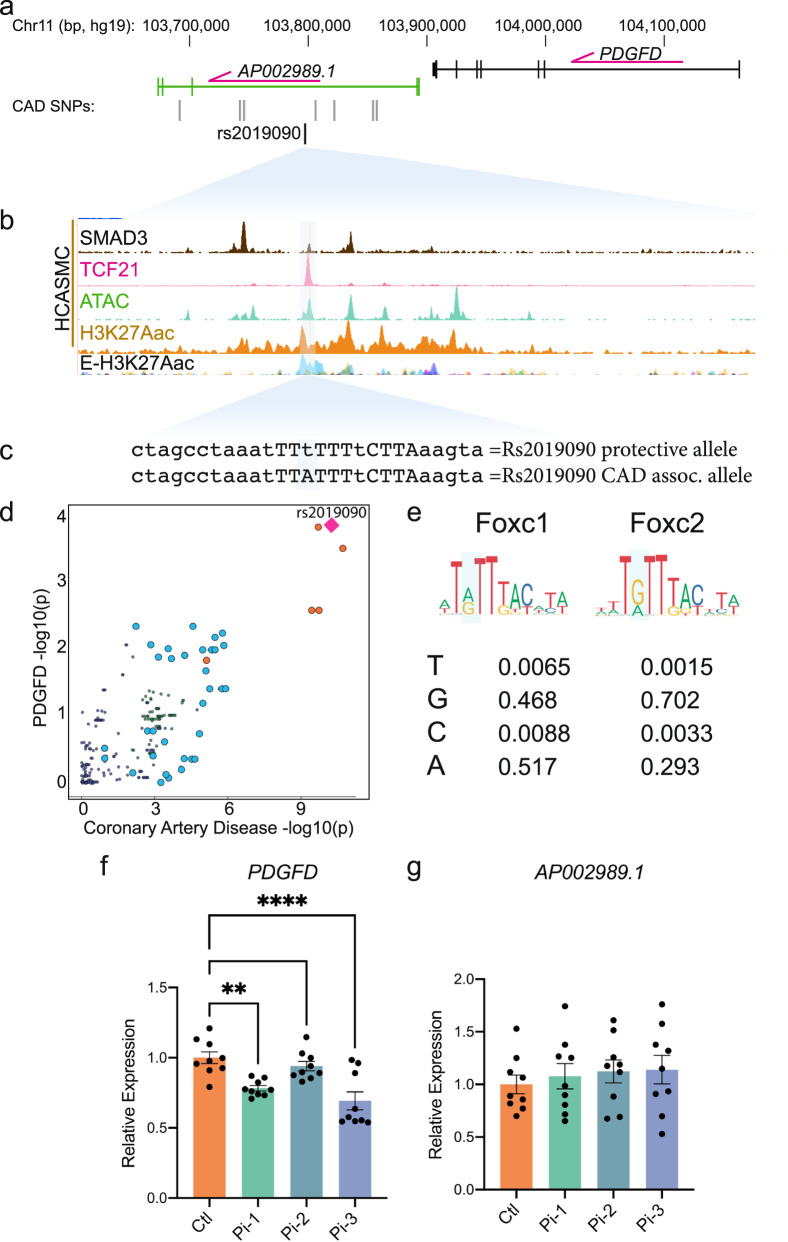
Genome wide association studies for coronary artery disease (CAD) have identified a risk locus at 11q22.3. Here, we verify with mechanistic studies that rs2019090 and PDGFD represent the functional variant and gene at this locus. Further, FOXC1/C2 transcription factor binding at rs2019090 is shown to promote PDGFD transcription through the CAD promoting allele. With single cell transcriptomic and histology studies with Pdgfd knockdown in an SMC lineage tracing male atherosclerosis mouse model we find that Pdgfd promotes expansion, migration, and transition of SMC lineage cells to the chondromyocyte phenotype. Pdgfd also increases adventitial fibroblast and pericyte expression of chemokines and leukocyte adhesion molecules, which is linked to plaque macrophage recruitment. Despite these changes there is no effect of Pdgfd deletion on overall plaque burden. These findings suggest that PDGFD mediates CAD risk by promoting deleterious phenotypic changes in SMC, along with an inflammatory response that is primarily focused in the adventitia.


Conflict of interest statement

C.S.W. is a consultant for Tensixteen Bio and Renovacor, T.Q. is a consultant for Saliogen, and a member of the Cardiometabolic Scientific Advisory Board of Amgen. S.J. and S.H. are paid employees of Amgen, and this work was supported in part by Amgen, Inc. All other authors declare no competing interests

Figures

Fig. 1
Fig. 1. Functional mapping of candidate 11q22.3 locus proposes regulatory mechanisms of PDGFD expression and disease association.
a UCSC browser screenshot at 11q22.3 locus showing position of PDGFD gene and lncRNA AP002989.1 relative to the candidate SNP rs2019090, and b overlap of rs2019090 with ChIP-seq tracks for CAD risk transcription factors SMAD3 and TCF21. Also shown are ATAC-seq open chromatin and active enhancer histone modification H3K27ac ChIP-seq tracks in human coronary artery smooth muscle cells (HCASMC), as well as ENCODE layered H3K27ac for HUVEC (blue) and NHLF (purple) cells. Genomic coordinates refer to hg19 assembly. c Genomic sequence at rs2019090 for protective and disease alleles, with FOXC1/C2 motifs indicated. d Co-localization of coronary artery disease (CAD) GWAS association data on the x-axis and PDGFD eQTL association data (GTEx v8, aorta) on the y-axis. P-values represent original GWAS findings, not a statistical test to determine variant causality. e Position weight matrices for FOXC1 and FOXC2, as per the JASPAR database. f, g CRISPRi epigenetic silencing by transduction of dCas9KRAB and single guide RNAs targeted around rs2019090 in cell lot 59386145, a HCASMC primary culture with AA genotype. Expression of PDGFD, ** p = 0.0033, **** p < 0.0001 and lncRNA AP002989.1 were evaluated by quantitative RT-PCR. Data were normalized relative to control and expressed as mean ± s.e.m. with p-values obtained using ordinary one-way ANOVA with Dunnett’s multiple comparisons post-hoc test. Dots represent three technical replicates from three biologically independent samples. Source data are provided in the Source Data File.
Fig. 2
Fig. 2. FOXC1 regulates PDGFD expression via functional SNP rs2019090 to establish a complex gene regulatory network.
Results of enhancer trap assay for a FOXC1, * p = 0.0126 and b FOXC2, * p = 0.0155, ** p = 0.0040, or empty control (pWPI) co-transfected with luciferase reporters with three copies of the 150 base pair region containing the A allele (Ax3) or T allele (Tx3) cloned into the minimal promoter-driven luciferase reporter vector pLUC-MCS (MCS). A7r5 rat vascular smooth muscle cells were used for these assays. Values represent mean ± s.e.m. of four biologically independent experiments expressed as fold change relative to pWPI-empty plasmid with p-values obtained with two-sided unpaired t-test. c Results of quantitative polymerase chain reaction (qPCR) analysis for PDGFD, n = 5 biologically independent knockdown samples, ** p = 0.0026, ** p = 0.0058, * p = 0.0123, and n = 4 biologically independent over-expression samples in 1508 cell lot and n = 3 for all other lots and conditions; *** p = 0.0004, *** p = 0.0002. Analysis was performed using one-way ANOVA with Dunnett’s multiple comparisons post-hoc test or d AP002989.1 expression with knockdown (KD), n = 6 biologically independent knockdown samples in 1508 cell lot, or over-expression (OE) of FOXC1, n = 3 biologically independent samples for all other conditions and cell lots, in HCASMC carrying different genotypes for rs2019090. Each dot represents a biologically independent sample. Data were normalized relative to controls and expressed as mean ± s.e.m with p-values using ordinary one-way ANOVA with Dunnett’s multiple comparisons post hoc test. e qPCR analysis for expression levels of PDGFD, ** p = 0.0028, f FOXC1, ** p = 0.0024, g AP002989.1, h PDGFRA, ** p = 0.0039, and i PDGFRB, ** p = 0.0068 with PDGFD knockdown (KD) in HCASMC. Each dot represents a biologically independent sample, n = 3. Data were expressed as mean ± s.e.m with p-values using a two-sided unpaired t-test. j qPCR analysis for expression levels of PDGFD, n = 6 for PD(Low) and PD(Mid), n = 4 for PD(High), *** p < 0.001, k FOXC1, n = 6 for PD(Low) and PD(Mid), n = 4 for PD(High), ** p = 0.0055, * p = 0.0177 l AP002989.1, n = 5 for PD(Low), n = 3 for PD(Mid), n = 2 for PD(High), m PDGFRA, n = 6 for PD(Low) and PD(High), n = 4 for PD(Mid), *** p = 0.0006, * p = 0.0189, *** p = 0.0004 and n PDGFRβ, n = 6 for PD(Low) and PD(Mid), n = 4 for PD(High), * p = 0.0244, ** p = 0.0035, * p = 0.0305 with PDGFD overexpression (OE) in HCASMC. Data grouped based on expression levels of PDGFD and expressed as mean ± s.e.m of biologically independent samples with p-values obtained from one-way ANOVA with Dunnett’s multiple comparisons post-hoc test. Each dot represents a biological replicate. Data represented as relative expression as control ratio (treatment of scramble siRNA (si-Ctl, KD control) or empty-pWPI (Ctl, OE control). Source data are provided in the Source Data File.
Fig. 3
Fig. 3. Single-cell transcriptomic profiling of mouse atherosclerotic aortic root in Pdgfd KO mice.
a Schematic of experimental design showing that dissected aortic tissues were harvested for single cell RNA sequencing (scRNAseq) and histology analyses from SMC-specific lineage tracing control (Ctl) and lineage tracing Pdgfd knockout (KO) mice. Eight-week-old mice, 2 Ctl and 3 KO captures (two mice per capture), were treated with tamoxifen twice at 3-day intervals and subsequently fed high fat diet for 16 weeks and then sacrificed. Tissues were digested to single cells, tdTomato positive (tdT+) fluorescence and negative (tdT-) cells collected and captured on the10x Chromium controller, libraries generated and sequenced. Created with BioRender.com. b Uniform manifold approximation and projection (UMAP) of scRNAseq results identified 13 different clusters at 2.6 clustering resolution, with respective biological cluster identities as defined by cluster marker genes. c UMAP displaying expression of indicated markers reflecting unique cluster identity: Cnn1, SMC; Fn1, FMC; Ibsp, CMC; Rgs5, pericytes. d UMAP visualizing dimension reduction plots of Pdgfd and Pdgfrb expression. e UMAP images comparing feature expression of tdTomato positive cells from Ctl and KO mice. The dotted line is generated based on the Ctl image. Arrows indicate increase in SMC number and decrease in transition cell (CMC) number. f Bar plot presenting the average percentage of lineage traced cells and g non-lineage traced cells in Ctl and KO groups.
Fig. 4
Fig. 4. Loss of Pdgfd mitigates the smooth muscle cell chondrogenic transition and inflammatory pathway activation.
a Bar plot showing the number of upregulated genes (58, red bars) and downregulated genes (107, blue bars) derived from all KO compared to all Ctl disease tissues. b Gene-disease network analysis of the differentially expressed genes (DEGs) among lineage traced cells in KO compared with Ctl as determined by gene set enrichment analysis with clusterprofiler, and shown as a gene-gene regulatory network with enrichplot. c Bar plot displaying numbers of DEGs in individual clusters, for KO compared with Ctl. d Heatmap showing expression patterns of downregulated DEGs across different cluster groups, based on fold-change of gene expression. Yellow color indicates differential expression, genes in red text reside in window of lead SNP ± 500 kilobases. eh Graphs depicting gene set enrichment analysis underlying biological process of DEGs for e FMC, f CMC, g pericytes, and h CMCs as determined by clusterProfiler. Gene set enrichment analysis (GSEA) was used, with permutation test to determine adjusted p-value.
Fig. 5
Fig. 5. In situ studies of mouse atherosclerosis reveal that Pdgfd KO lessens SMC cell state transitions and inflammation but without impact on plaque burden.
a X-gal staining visualizing β-galactosidase activity (lacZ, blue precipitate) to determine the cellular location of Pdgfd expression in mouse model atherosclerosis. Aortic root sections were also stained with a generic nuclear marker nuclear fast red (NFR), immunohistochemistry for the Cd68 macrophage marker or Cnn1 marker for SMC identification. b Quantification of total vessel area, n = 25 control and 17 KO mouse sections. c Quantification of lesion, n = 26 control and 17 KO mouse sections, and d acellular areas in Ctl and KO groups expressed as a ratio of the total vessel area per section, n = 10 control and 10 KO mouse sections, p < 0.0001. e Representative images identifying expression of the tdTomato gene to visualize the SMC lineage traced cells in aortic sections. f Quantification of tdTomato positive (tdT+) area relative to total vessel area, n = 18 control and 14 KO mouse sections, p < 0.0001. g Representative sections stained for Cnn1, a marker of the differentiated SMC. h Quantification of Cnn1 positive (Cnn1+) area at the media, n = 25 control and 17 KO mouse sections, p = 0.0061 and i compared to total cross-sectional area expressed as a ratio of the total vessel area per section, n = 25 control and 17 KO mouse sections, p = 0.0042. j Representative images of Cd68-stained aortic root area to quantify monocyte recruitment. k Quantification of Cd68 positive (Cd68+) area relative to the vessel area, n = 23 control and 17 KO mouse sections, p = 0.004. l Representative images of Col2a1 RNAscope of the aortic root in Ctl and KO mice. m Quantitative RNAscope of Col2a1, n = 12 control and 12 KO mouse sections, p = 0.0052 and n Ibsp expression, n = 13 control and 13 KO mouse sections, p = 0.0074. o Representative images stained for calcium deposits with alizarin red S. p Quantification of calcium deposits, n = 9 control and 9 KO mouse sections, p = 0.0076. Each dot represents quantification from identical level sections from individual animals. Data expressed as mean ± s.e.m with p-values using a two-sided unpaired t-test.
Fig. 6
Fig. 6. Single cell RNA-seq studies of antibody-mediated Pdgfd inhibition in the mouse atherosclerosis model.
a Schematic of experimental design showing that SMC-specific lineage tracing wildtype mice were treated with tamoxifen at 8 weeks of age and tissues harvested after 8 and 16 weeks of high fat diet. Blocking Pdgfd antibody or isotype control antibody administration,10 mg/kg subcutaneously twice weekly, was initiated at 11 weeks and continued until animals were sacrificed after either 8 weeks exposure to the diet (5 weeks antibody) or 16 weeks diet (13 weeks antibody), and scRNAseq conducted at these timepoints. Created with BioRender.com. b Heatmap showing gene expression changes after 5 weeks of antibody treatment. The Fblst-1 cluster shows early downregulation of Pdgfd-regulated genes, and FMC and CMC cluster cells beginning to show evidence of upregulation of these genes as the SMC lineage cells are undergoing phenotypic transition in the developing lesion. Yellow color indicates differential downregulated genes, genes in red text reside in window of lead SNP ± 500 kilobases. c Heatmap showing decreases in Pdgfd regulated genes across different cell clusters in targeted animals compared to controls. Yellow color indicates differential downregulated genes, genes in red text reside in window of lead SNP ± 500 kilobases. d Bar plot presenting the average percentage of lineage traced cells and e non-lineage traced cells in Ctl antibody and Pdgfd blocking antibody groups.

Update of

References

    1. Mathers CD, Loncar D. Projections of global mortality and burden of disease from 2002 to 2030. PLoS Med. 2006;3:e442. doi: 10.1371/journal.pmed.0030442. - DOI - PMC - PubMed
    1. Roth GA, et al. Global and regional patterns in cardiovascular mortality from 1990 to 2013. Circulation. 2015;132:1667–1678. doi: 10.1161/CIRCULATIONAHA.114.008720. - DOI - PubMed
    1. Erdmann J, Kessler T, Munoz Venegas L, Schunkert H. A decade of genome-wide association studies for coronary artery disease: the challenges ahead. Cardiovasc. Res. 2018;114:1241–1257. - PubMed
    1. Klarin D, et al. Genetic analysis in UK Biobank links insulin resistance and transendothelial migration pathways to coronary artery disease. Nat. Genet. 2017;49:1392–1397. doi: 10.1038/ng.3914. - DOI - PMC - PubMed
    1. Nelson CP, et al. Association analyses based on false discovery rate implicate new loci for coronary artery disease. Nat. Genet. 2017;49:1385–1391. doi: 10.1038/ng.3913. - DOI - PubMed

Publication types

Substances