. 2023 Feb 15;13(1):2710.
doi: 10.1038/s41598-023-29425-y.

Targeting mTOR to overcome resistance to hormone and CDK4/6 inhibitors in ER-positive breast cancer models

Affiliations

Targeting mTOR to overcome resistance to hormone and CDK4/6 inhibitors in ER-positive breast cancer models

María Jimena Rodriguez et al. Sci Rep. .

Abstract

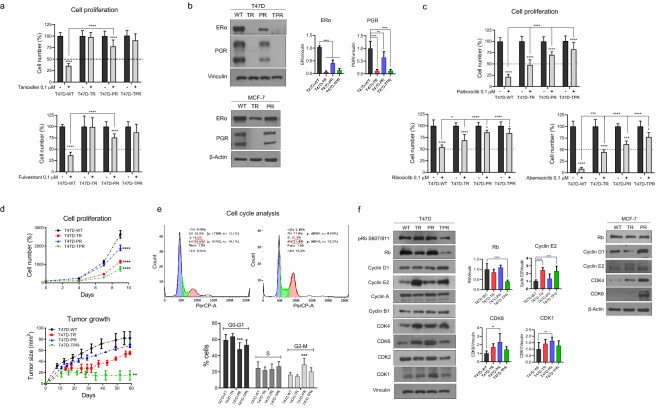
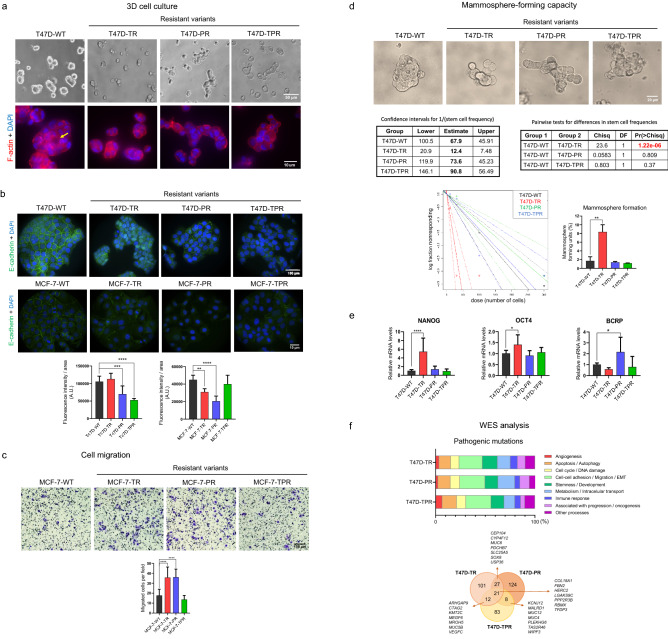
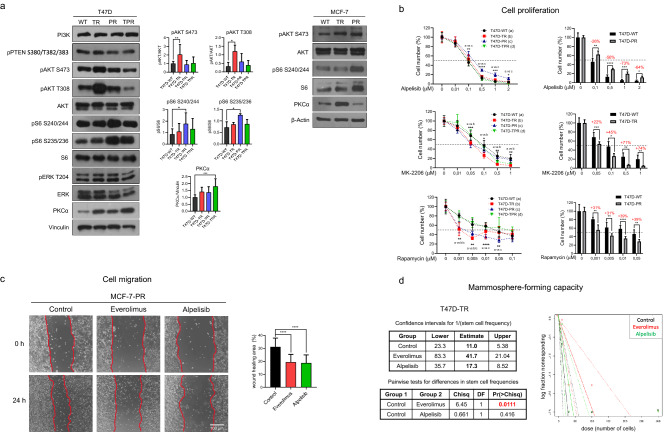
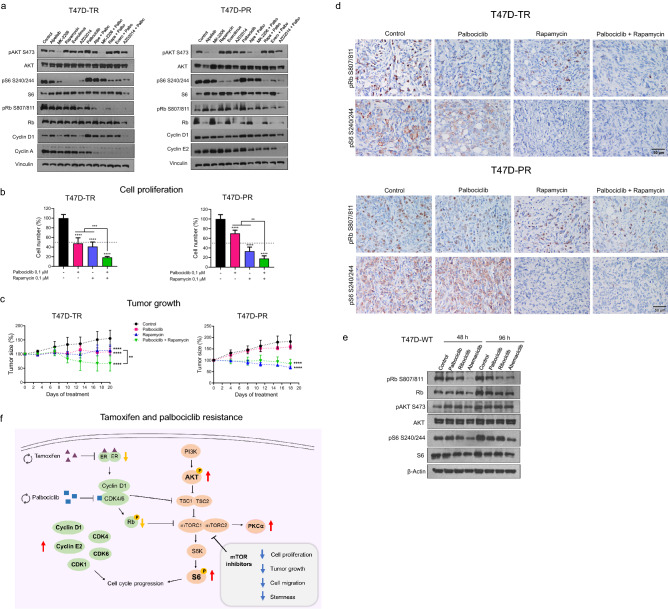
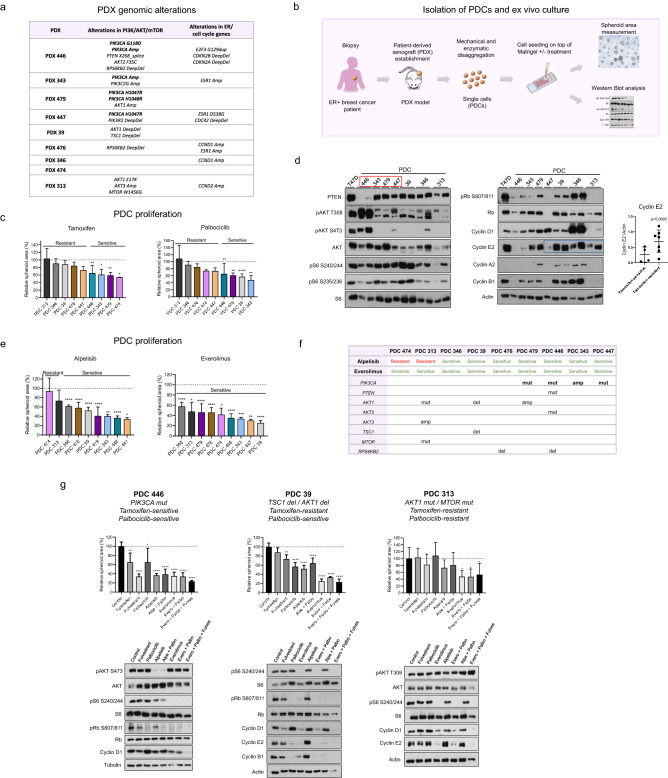
Resistance to therapy remains a major obstacle in cancer management. Although treatment with hormone and CDK4/6 inhibitors is successful in luminal breast cancer, resistance to these treatments is frequent, highlighting the need for novel therapeutic strategies to delay disease progression and improve patient survival. Here, we assessed the mechanisms of acquired resistance using T47D and MCF-7 tamoxifen- and palbociclib-resistant cell-line variants in culture and as xenografts, and patient-derived cells (PDCs) obtained from sensitive or resistant patient-derived xenografts (PDXs). In these models, we analyzed the effect of specific kinase inhibitors on survival, signaling and cellular aggressiveness. Our results revealed that mTOR inhibition is more effective than PI3K inhibition in overcoming resistance, irrespective of PIK3CA mutation status, by decreasing cell proliferation and tumor growth, as well as reducing cell migration and stemness. Moreover, a combination of mTOR and CDK4/6 inhibitors may prevent pathway reactivation downstream of PI3K, interfering with the survival of resistant cells and consequent tumor escape. In conclusion, we highlight the benefits of incorporating mTOR inhibitors into the current therapy in ER + breast cancer. This alternative therapeutic strategy not only enhances the antitumor response but may also delay the emergence of resistance and tumor recurrence.


Conflict of interest statement

The authors declare no competing interests.

Figures

Figure 1
Figure 1
The resistant cells display alterations in proliferation and cell cycle. (a) Effect of ER inhibitors on cell proliferation. T47D cell variants were treated with 4-hydroxytamoxifen (0.1 µM), fulvestrant (0.1 µM) or vehicle for 7 days and counted at the end of the experiment. ****p < 0.0001. Data represent mean ± SD, two-way ANOVA followed by Tukey's test (independent replicates n = 3, with 4 experimental replicates in each group). (b) Expression of hormone receptors. Protein lysates were obtained under basal conditions and analyzed by immunoblot with the indicated antibodies. For T47D variants, bands were quantified by densitometry and relativized to their loading control. **p < 0.01, ****p < 0.0001. Data represent mean ± SD, one-way ANOVA followed by Dunnett’s test (independent replicates n = 3, with 3 experimental replicates in each group). (c) Effect of CDK4/6 inhibitors on cell proliferation. T47D cells were treated with palbociclib (0.1 µM), ribociclib (0.1 µM), abemaciclib (0.1 µM) or vehicle for 7 days and counted at the end of the treatment. *p < 0.05, ***p < 0.001, ****p < 0.0001. Data represent mean ± SD, two-way ANOVA followed by Tukey's test (independent replicates n = 3, with 4 experimental replicates in each group). (d) Cell proliferation and tumor growth. Top: Cells were cultured in the absence of drugs and quantified every 2 days. ****p < 0.0001. Data represent mean ± SD, two-way ANOVA followed by Dunnett's test (independent replicates n = 3, with 4 experimental replicates in each group). Bottom: Tumor growth curves. 8 × 106 cells of each variant were injected subcutaneously in the lateral flank of NSG mice, previously implanted with silastic pellets containing 17β-estradiol (0.25 mg). **p < 0.01. Data represent mean ± SD, one-way ANOVA followed by Dunnett's test at the end of the experiment (independent replicates n = 2, with 3 experimental replicates in each arm of treatment). Representative curve of two. (e) Cell cycle analyses. T47D cells were stained with propidium iodide and analyzed by flow cytometry. ***p < 0.001. Data represent mean ± SD, one-way ANOVA followed by Dunnett's test (independent replicates n = 4, with 4 experimental replicates in each group). (f) Expression of cell cycle proteins. Protein lysates were obtained under basal conditions and analyzed by immunoblot with the indicated antibodies. For T47D variants, bands were quantified by densitometry and relativized to their loading control. **p < 0.01, ***p < 0.001, ****p < 0.0001. Data represent mean ± SD, one-way ANOVA followed by Dunnett's test (independent replicates n = 2, with 3 experimental replicates in each group). Original blots/gels are presented in Supplementary Material, unprocessed western blots section.
Figure 2
Figure 2
The resistant cells exhibit an altered phenotype. (a) 3D cultures. T47D cells were cultured on Geltrex for 48 h. 3D cultures were stained for F-actin with phalloidin (red), and nuclei were counterstained with DAPI (blue). Some of the T47D-WT spheroids exhibited a lumen (yellow arrow). (b) Expression and localization of E-cadherin. Confocal microscopy images of immunofluorescence staining for E-cadherin (green). Nuclei were counterstained with DAPI (blue). **p < 0.01, ***p < 0.001. Data represent mean ± SD, one-way ANOVA followed by Dunnett's test (independent replicates n = 2, with 10 analyzed fields in each group). Since resistant cells are bigger than wild type cells, fluorescence intensity was adjusted to cell area. (c) Cell migration. Transwell migration assays were performed by seeding MCF-7 cells onto 8 µm-pore inserts in the presence of a serum gradient. After 24 h, cells that passed through the insert and attached to the other side were quantified. ***p < 0.001. Data represent mean ± SD, one-way ANOVA followed by Dunnett's test (independent replicates n = 3, with 4 experimental replicates in each group). (d) Mammosphere-forming capacity. Mammosphere formation assays and Extreme limiting dilution assay were performed. Sphere formation frequencies were compared using the ELDA web tool (left). The number of cells seeded per well versus the logarithmic fraction of wells without any detected spheres was plotted (middle). Trend lines represent the estimated active cell frequency, dotted lines show the 95% confidence interval. Percentage of sphere-forming units was plotted according to % = 1/Frequency × 100 (right). **p < 0.01. Data represent mean ± SD, one-way ANOVA followed by Dunnett's test (independent replicates n = 2, with 6 experimental replicates in each group). (e) Expression of stemness markers. mRNA levels of NANOG, OCT4 and BCRP were measured by qRT-PCR. Expression levels were normalized to the GAPDH expression for each variant. *p < 0.05, ****p < 0.0001. Data represent mean ± SD, one-way ANOVA followed by Dunnett's test (independent replicates n = 3, with 3 experimental replicates in each group). (f) Pathogenic mutations in T47D-resistant cells. Mutations that were not present in the parental cells were filtered by potential pathogenicity using REVEL, SIFT, Polyphen2 and CLNSIG predictors. Top: Mutated genes were grouped according to their function or the cellular processes they are involved in. Bottom: Venn Diagram showing the number of pathogenic mutations in the resistant cells and some relevant mutated genes. Original images are presented in Supplementary Material, unprocessed photomicrographs section.
Figure 3
Figure 3
Targeting PI3K/AKT/mTOR pathway in the resistant cells. (a) Activation of PI3K/AKT/mTOR pathway. Protein lysates were obtained under basal conditions and analyzed by immunoblot with the indicated antibodies. For T47D variants, bands were quantified by densitometry and relativized to their loading control. *p < 0.05, **p < 0.01, ***p < 0.001. Data represent mean ± SD, one-way ANOVA followed by Dunnett's test (independent replicates n = 3, with 3 experimental replicates in each group). (b) Effect of PI3K/AKT/mTOR inhibitors on cell proliferation. Cells were treated with increasing concentrations of alpelisib (PI3Kα inhibitor), MK-2206 (pan-AKT inhibitor) and rapamycin (mTORC1 inhibitor) for 7 days and counted at the end of the experiment. Bar graphs on the right show the percentage (red numbers) of increase (+) or decrease (−) in inhibition of cell proliferation at the different concentrations. *p < 0.05, **p < 0.01, ***p < 0.001, ****p < 0.0001. Data represent mean ± SD at each drug concentration, two-way ANOVA followed by Dunnett's test (independent replicates n = 2, with 4 experimental replicates in each group). (c) Effect of PI3K/AKT/mTOR inhibitors on cell migration. Wound healing assays were performed in MCF-7-PR cells. Cells were treated with alpelisib (0.1 µM), everolimus (0.1 µM) or vehicle for 24 h. Representative pictures at the beginning (T0) and at the end (Tf) are shown on the left panel. The wound healing area was quantified as T0-Tf (right). ****p < 0.0001. Data represent mean ± SD, one-way ANOVA followed by Dunnett's test (independent replicates n = 2, with 4 experimental replicates in each group). (d) Effect of PI3K/AKT/mTOR inhibitors on mammosphere-forming capacity. Extreme limiting dilution assays were performed in T47D-TR cells. Cells were treated with alpelisib (0.1 µM), everolimus (0.1 µM) or vehicle for 7 days. Left: Sphere formation frequencies were compared using the ELDA web tool. Right: The number of cells seeded per well versus the logarithmic fraction of wells without any detected spheres was plotted. Trend lines represent the estimated active cell frequency, dotted lines show the 95% confidence interval. P-values for significant differences between treatments were calculated using ELDA webtool software (independent replicates n = 2, with 6 experimental replicates in each group). Original blots/gels are presented in Supplementary Material, unprocessed western blots section. Original images are presented in Supplementary Material, unprocessed photomicrographs section.
Figure 4
Figure 4
Combined inhibition of mTOR and CDK4/6 to overcome resistance. (a) Effect of palbociclib in combination with PI3K/AKT/mTOR inhibitors on cell cycle proteins and PI3K/AKT/mTOR activation. T47D-TR and T47D-PR cells were treated with alpelisib (0.1 µM), MK-2206 (0.1 µM), rapamycin (0.1 µM), everolimus (0.1 µM), AZD2014 (0.1 µM) and their combinations with palbociclib (0.1 µM) for 30 h. Protein lysates were analyzed by immunoblot with the indicated antibodies. (b) Effect of palbociclib in combination with rapamycin on cell proliferation. T47D-TR and T47D-PR cells were treated with palbociclib (0.1 μM), rapamycin (0.1 µM) and the combination for 7 days. **p < 0.01, ***p < 0.001, ****p < 0.0001. Data represent mean ± SD, one-way ANOVA followed by Tukey's test (independent replicates n = 3, with 4 experimental replicates in each group). (c) Effect of palbociclib in combination with rapamycin on tumor growth. 8 × 106 T47D-TR or T47D-PR cells were inoculated subcutaneously in the lateral flank of NSG mice. Tumor sizes were relativized to their size before starting treatment. Tumors were treated with palbociclib (25 mg/kg 5 times per week, subcutaneously), rapamycin (17.5 mg/kg 2 times per week, by intraperitoneal injection) or the combination for 18–20 days. **p < 0.01, ****p < 0.0001. Data represent mean ± SD, two-way ANOVA followed by Tukey’s test (independent replicates n = 2, with 3 to 6 experimental replicates in each arm of treatment). Representative curve of two in each variant. (d) Effect of palbociclib in combination with rapamycin on pRb and pS6 levels in tumors. Immunohistochemistry for pRb Ser807/811 and pS6 Ser240/244 was performed on tumors treated with palbociclib, rapamycin, and the combination. Representative images of stained tumor sections. (e) Effect of different CDK4/6 inhibitors on PI3K/AKT/mTOR activation. T47D-WT cells were treated with palbociclib (0.1 µM), ribociclib (0.1 µM), abemaciclib (0.1 µM) or vehicle for 48 or 96 h. Protein lysates were analyzed by immunoblot with the indicated antibodies. (f) Summary of the results found in T47D and MCF-7 resistant cell variants. Red/yellow arrows represent upregulation/downregulation of phosphorylation or protein expression. Blue arrows represent downregulation of cellular processes. Original blots/gels are presented in Supplementary Material, unprocessed western blots section.
Figure 5
Figure 5
Targeting PI3K/AKT/mTOR pathway in patient-derived cells. (a) Genomic alterations in PI3K/AKT/mTOR pathway, ER and cell cycle genes in PDXs. (b) Isolation of PDCs and ex vivo culture. (c) Sensitivity to tamoxifen and palbociclib. PDCs were treated with tamoxifen (0.1 μM), palbociclib (0.5 μM) or vehicle for 7 days. Waterfall plots represent the response of each PDC to treatment. The average area of treated spheres was relativized to the area of the control spheres (vehicle). PDCs were grouped as sensitive if significant differences in sphere area compared to their respective control were found; otherwise, they were classified as resistant. *p < 0.05, **p < 0.01, ****p < 0.0001. Data represent mean ± SD, one-way ANOVA followed by Tukey's test (independent replicates n = 2, with 2 experimental replicates in each group). (d) Activation of PI3K/AKT/mTOR pathway and expression of cell cycle proteins. Protein lysates from PDCs were analyzed by immunoblot with the indicated antibodies. PDCs harboring alterations in PIK3CA (red box), did not necessarily exhibit higher AKT or S6 phosphorylation levels. Tamoxifen-resistant PDCs showed an upward trend in cyclin E2 expression (blue box). Bands were quantified by densitometry and relativized to their loading control (bar graph). Data represent mean ± SD, two-sided Student’s t-test. (e) Sensitivity to alpelisib and everolimus. PDCs were treated with alpelisib (1 μM), everolimus (0.1 μM) or vehicle for 7 days. Waterfall plots represent the response of each PDC to treatment. The average area of treated spheres was relativized to the area of the control spheres (vehicle). PDCs were grouped as sensitive if significant differences in sphere area compared to their respective control were found; otherwise, they were classified as resistant. *p < 0.05, **p < 0.01, ***p < 0.001, ****p < 0.0001. Data represent mean ± SD, one-way ANOVA followed by Tukey's test (independent replicates n = 2, with 2 experimental replicates in each group). (f) Genomic alterations in PI3K/AKT/mTOR pathway. Alpelisib-resistant PDCs (474 and 313) presented PIK3CA-wt, while four out of seven  alpelisib-sensitive PDCs harbored alterations in PIK3CA. All PDCs were sensitive to everolimus regardless of the presence of alterations in the PI3K/AKT/mTOR pathway. (g) Combined treatment with palbociclib, alpelisib/everolimus and fulvestrant. PDCs were treated with tamoxifen (0.1 µM), fulvestrant (0.1 µM), palbociclib (0.5 µM), alpelisib (1 µM), everolimus (0.1 µM) and their combinations for 7 days (sensitivity analysis, top panels) or 30 h (western blot, bottom panels). *p < 0.05, **p < 0.01, ***p < 0.001, ****p < 0.0001. Data represent mean ± SD, one-way ANOVA followed by Tukey's test (independent replicates n = 2, with 2 experimental replicates in each group). Original blots/gels are presented in Supplementary Material, unprocessed western blots section.

References

    1. Preusser M, et al. CDK4/6 inhibitors in the treatment of patients with breast cancer: Summary of a multidisciplinary round-table discussion. ESMO Open. 2018;3:e000368. doi: 10.1136/esmoopen-2018-000368. - DOI - PMC - PubMed
    1. Cogliati, V. et al. How to treat HR+/HER2- metastatic breast cancer patients after CDK4/6 inhibitors: An unfinished story. Life (Basel)12 (2022). - PMC - PubMed
    1. Hanker AB, Sudhan DR, Arteaga CL. Overcoming endocrine resistance in breast cancer. Cancer Cell. 2020;37:496–513. doi: 10.1016/j.ccell.2020.03.009. - DOI - PMC - PubMed
    1. Xi J, Ma CX. Sequencing endocrine therapy for metastatic breast cancer: What do we do after disease progression on a CDK4/6 inhibitor? Curr. Oncol. Rep. 2020;22:57. doi: 10.1007/s11912-020-00917-8. - DOI - PubMed
    1. Watt AC, Goel S. Cellular mechanisms underlying response and resistance to CDK4/6 inhibitors in the treatment of hormone receptor-positive breast cancer. Breast Cancer Res. 2022;24:17. doi: 10.1186/s13058-022-01510-6. - DOI - PMC - PubMed

Publication types

MeSH terms