Multicenter Study
. 2023 Jul;28(7):3013-3022.
doi: 10.1038/s41380-023-01977-5. Epub 2023 Feb 15.

Functional connectivity signatures of major depressive disorder: machine learning analysis of two multicenter neuroimaging studies

Affiliations
Multicenter Study

Functional connectivity signatures of major depressive disorder: machine learning analysis of two multicenter neuroimaging studies

Selene Gallo et al. Mol Psychiatry. 2023 Jul.

Abstract

The promise of machine learning has fueled the hope for developing diagnostic tools for psychiatry. Initial studies showed high accuracy for the identification of major depressive disorder (MDD) with resting-state connectivity, but progress has been hampered by the absence of large datasets. Here we used regular machine learning and advanced deep learning algorithms to differentiate patients with MDD from healthy controls and identify neurophysiological signatures of depression in two of the largest resting-state datasets for MDD. We obtained resting-state functional magnetic resonance imaging data from the REST-meta-MDD (N = 2338) and PsyMRI (N = 1039) consortia. Classification of functional connectivity matrices was done using support vector machines (SVM) and graph convolutional neural networks (GCN), and performance was evaluated using 5-fold cross-validation. Features were visualized using GCN-Explainer, an ablation study and univariate t-testing. The results showed a mean classification accuracy of 61% for MDD versus controls. Mean accuracy for classifying (non-)medicated subgroups was 62%. Sex classification accuracy was substantially better across datasets (73-81%). Visualization of the results showed that classifications were driven by stronger thalamic connections in both datasets, while nearly all other connections were weaker with small univariate effect sizes. These results suggest that whole brain resting-state connectivity is a reliable though poor biomarker for MDD, presumably due to disease heterogeneity as further supported by the higher accuracy for sex classification using the same methods. Deep learning revealed thalamic hyperconnectivity as a prominent neurophysiological signature of depression in both multicenter studies, which may guide the development of biomarkers in future studies.


Conflict of interest statement

GvW received research funding from Philips. The other authors declare no competing interests.

Figures
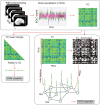
Fig. 1
Fig. 1. Pipeline from 4D rs-fMRI data to input for the classification task.
Visual representation of our pipeline. For the psymri dataset, preprocessing of the raw 4D rs-fMRI and parcellation of the brain in regions of interest (ROIs) according to the Harvard-Oxford atlas was performed in house, while the mddrest consortium provided us directly with the time course of the same ROIs. The functional connectivity (FC) matrix was calculated using Pearson correlation between ROIs. Each entry in the FC represented the strength of functional connectivity between two ROIs, each row represented the correlation profile between one ROI and other ROIs. Since the FC is symmetrical, only one of the triangles was used as input for the SVM classifiers. From the FC we constructed the graph, which was used as GCN input. The ROIs were used as the nodes of the graphs. To construct the edges between nodes, i.e., the FC between ROIs, we first binarized the FC matrix so that only the 50th highest absolute values of the correlations of the matrix were transformed into ones, while the rest were transformed into zeros. We then drew an edge between ROIs whose correlation survived the binarization process. A feature was assigned to each node. The features were the original (i.e., before binarization) correlation profile of the node itself with the rest of the ROIs in the brain, therefore an entire row of the FC. SVM support vector machine, GCN graph convolutional network.
Fig. 2
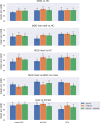
Fig. 2. Performance of each classifier for each comparison, expressed as average balanced accuracy across five folds.
Error bars indicate standard deviation across folds, * indicates classification results better than chance level after permutation testing. Significance level was corrected for the number of experiments performed, using the Bonferroni procedure.
Fig. 3
Fig. 3. GCN explainer and ablation results for the classification of MDD and HC.
A Results of the GCN explainer experiment obtained using the psymri dataset (left panel) and on the mddrest dataset (right panel): on top is the graphic representation of the functional connections between areas identified as necessary to discriminate MDD from HC, which are listed. The results on the left panel were obtained from the experiment on the psymri dataset, while those on the right are from the mddrest dataset. Connections identified by experiments in both datasets are shaded in gray. B Results of the ablation experiment obtained using the psymri dataset (left panel) and the mddrest dataset (right panel). Regions identified by experiments in both datasets are shaded in gray. L left, R right, ant anterior, inf. inferior, post posterior, acc balanced accuracy.
Fig. 4
Fig. 4. Univariate t-test results and Cohen’s d.
Left: Results of the univariate t-test for the classification task MDD vs HC for the mddrest dataset (top) and for the psymri (bottom). The mddrest results are corrected for multiple comparison and thresholded using FDR < 0.05. The red lines correspond to the left and the right thalami. For the psymri dataset, t-tests did not survive correction for multiple comparisons, and the results are thresholded at p-uncorr < 0.05 to illustrate the comparable pattern as for mddrest. The clustering for lobes is done merely for illustration purposes. Right: Cohen’s d for the classification task MDD vs HC for the mddrest dataset (top) and for the psymri (bottom), calculated for each voxel group comparison.

Similar articles

Cited by

References

    1. GBD 2017 Disease and Injury Incidence and Prevalence Collaborators. Global, regional, and national incidence, prevalence, and years lived with disability for 354 diseases and injuries for 195 countries and territories, 1990-2017: a systematic analysis for the Global Burden of Disease Study 2017. Lancet. 2018;392:1789–858. doi: 10.1016/S0140-6736(18)32279-7. - DOI - PMC - PubMed
    1. Coleman JRI, Gaspar HA, Bryois J, Bipolar Disorder Working Group of the Psychiatric Genomics Consortium, Major Depressive Disorder Working Group of the Psychiatric Genomics Consortium. Breen G. The genetics of the mood disorder spectrum: genome-wide association analyses of more than 185,000 cases and 439,000 controls. Biol Psychiatry. 2020;88:169–84. doi: 10.1016/j.biopsych.2019.10.015. - DOI - PMC - PubMed
    1. Topol EJ. High-performance medicine: the convergence of human and artificial intelligence. Nat Med. 2019;25:44–56. doi: 10.1038/s41591-018-0300-7. - DOI - PubMed
    1. Kambeitz J, Cabral C, Sacchet MD, Gotlib IH, Zahn R, Serpa MH, et al. Detecting neuroimaging biomarkers for depression: a meta-analysis of multivariate pattern recognition studies. Biol Psychiatry. 2017;82:330–8. doi: 10.1016/j.biopsych.2016.10.028. - DOI - PMC - PubMed
    1. Schnack HG, Kahn RS. Detecting neuroimaging biomarkers for psychiatric disorders: sample size matters. Front Psychiatry. 2016;7:50. doi: 10.3389/fpsyt.2016.00050. - DOI - PMC - PubMed

Publication types