. 2023 Feb 15;14(1):837.
doi: 10.1038/s41467-023-36545-6.

A molecular atlas reveals the tri-sectional spinning mechanism of spider dragline silk

Affiliations

A molecular atlas reveals the tri-sectional spinning mechanism of spider dragline silk

Wenbo Hu et al. Nat Commun. .

Abstract

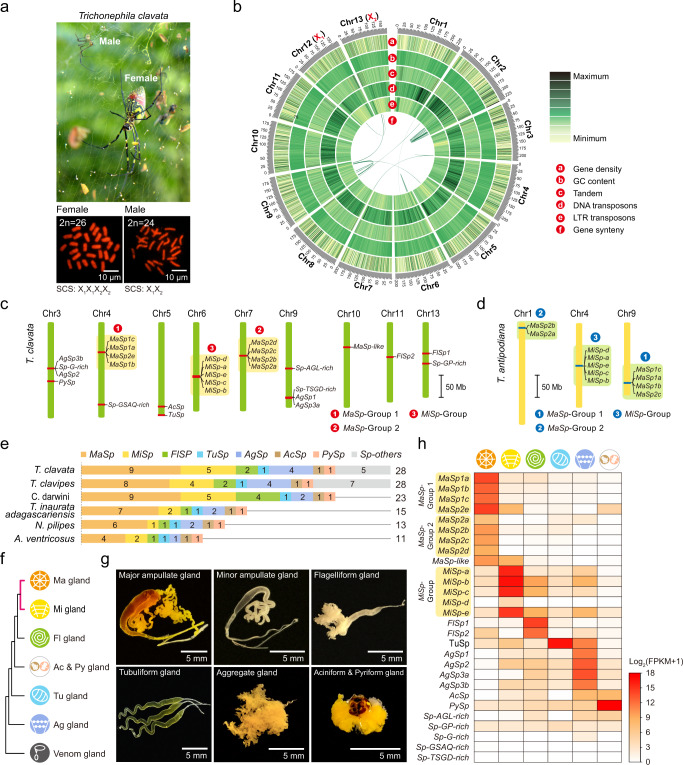
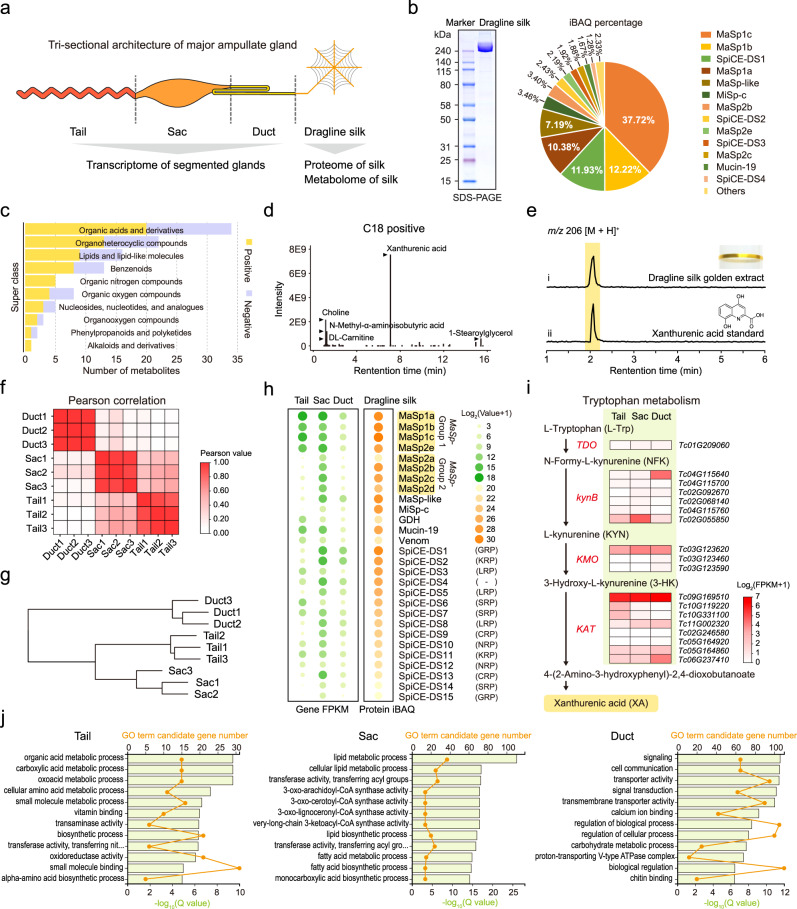
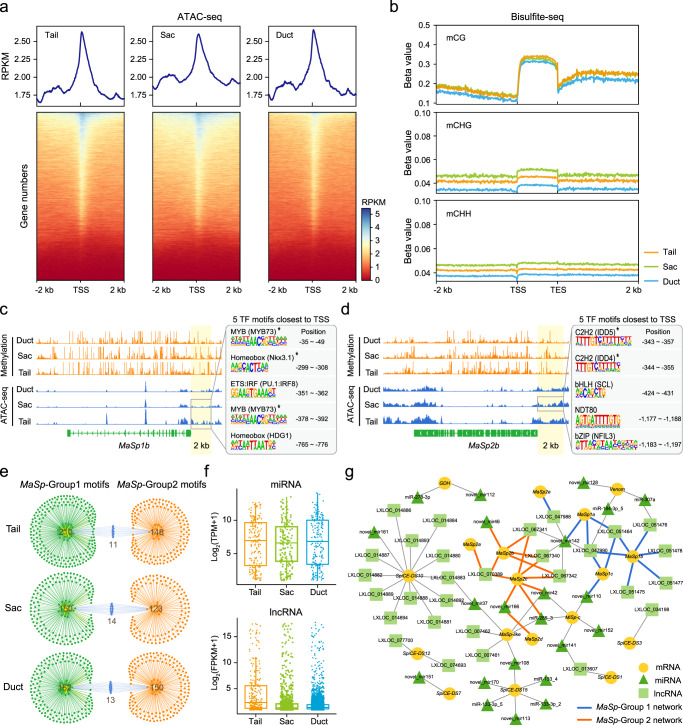
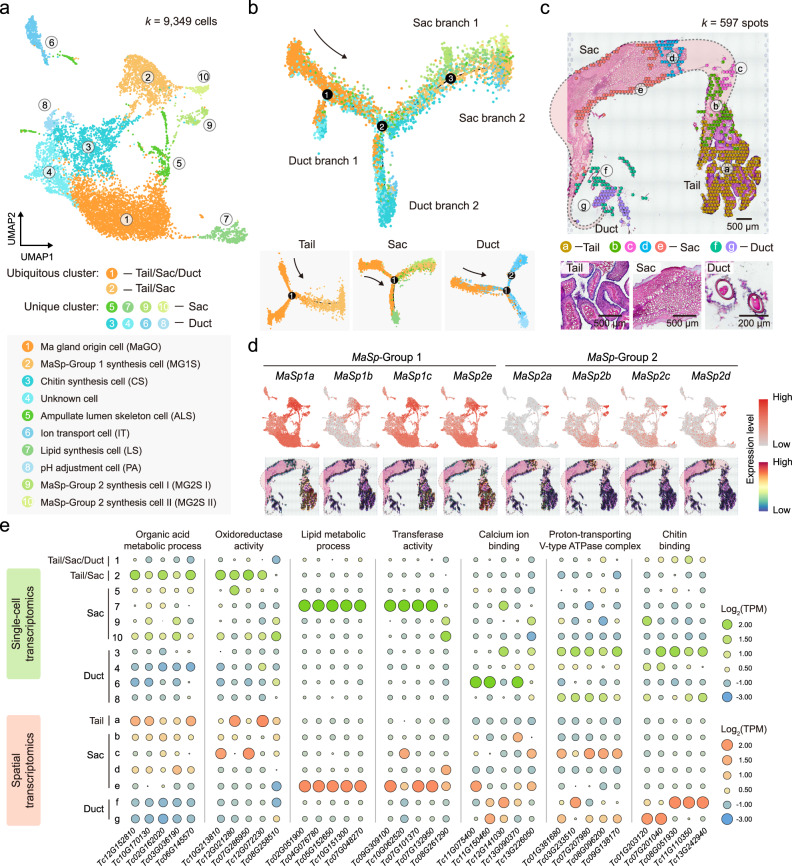
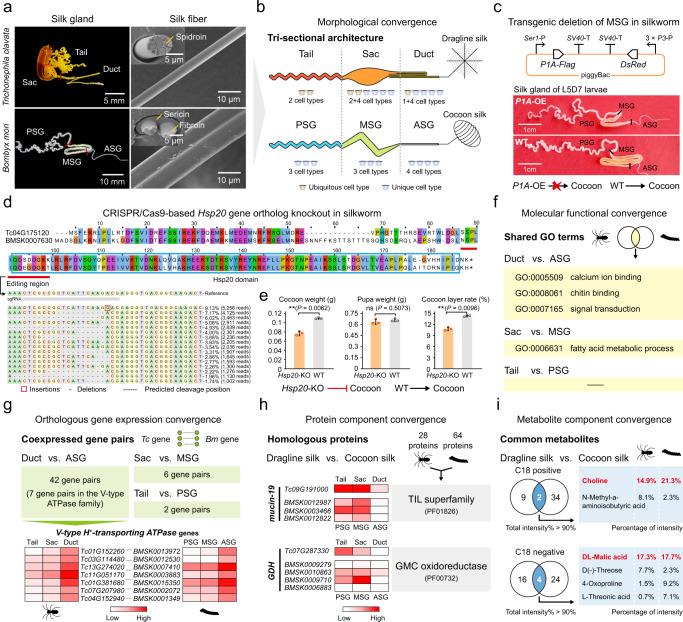
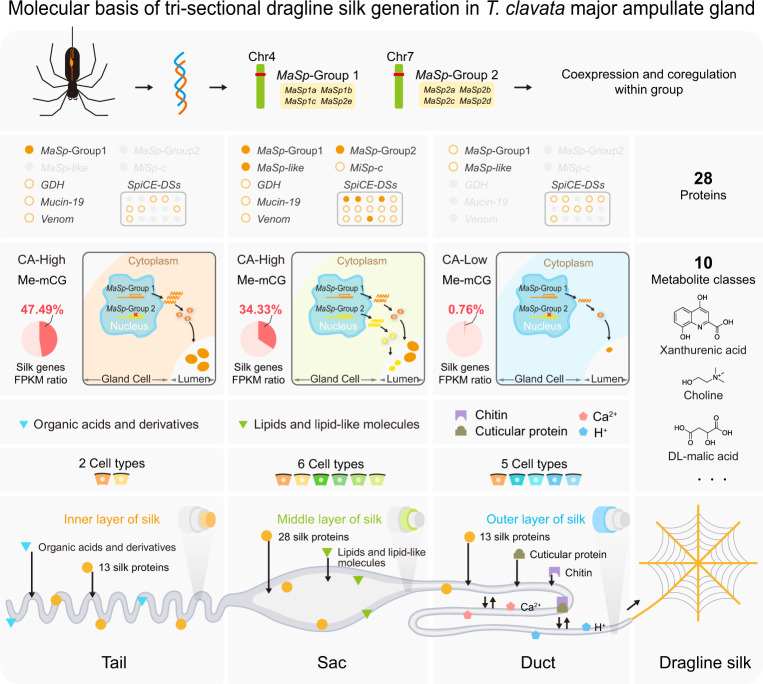
The process of natural silk production in the spider major ampullate (Ma) gland endows dragline silk with extraordinary mechanical properties and the potential for biomimetic applications. However, the precise genetic roles of the Ma gland during this process remain unknown. Here, we performed a systematic molecular atlas of dragline silk production through a high-quality genome assembly for the golden orb-weaving spider Trichonephila clavata and a multiomics approach to defining the Ma gland tri-sectional architecture: Tail, Sac, and Duct. We uncovered a hierarchical biosynthesis of spidroins, organic acids, lipids, and chitin in the sectionalized Ma gland dedicated to fine silk constitution. The ordered secretion of spidroins was achieved by the synergetic regulation of epigenetic and ceRNA signatures for genomic group-distributed spidroin genes. Single-cellular and spatial RNA profiling identified ten cell types with partitioned functional division determining the tri-sectional organization of the Ma gland. Convergence analysis and genetic manipulation further validated that this tri-sectional architecture of the silk gland was analogous across Arthropoda and inextricably linked with silk formation. Collectively, our study provides multidimensional data that significantly expand the knowledge of spider dragline silk generation and ultimately benefit innovation in spider-inspired fibers.


Conflict of interest statement

The authors declare no competing interests.

Figures

Fig. 1
Fig. 1. Chromosomal-scale genome assembly and full spidroin gene set of T. clavata.
a Photograph of T. clavata showing an adult female and an adult male on the golden orb-web (above) and the female and male karyotypes (below). SCS, sex chromosome system. b Circular diagram depicting the genomic landscape of the 13 pseudochromosomes (Chr113 on an Mb scale). c Twenty-eight T. clavata spidroin genes anchored on chromosomes. d Spidroin gene groups of another orb-web spider, T. antipodiana. The published genomic data of T. antipodiana was analyzed to identify the location information of spidroin genes. e Spidroin gene catalog of six orb-web spider species. f Expression clustering of silk glands (major and minor ampullate (Ma and Mi), flagelliform- (Fl), tubuliform- (Tu), aggregate- (Ag), and aciniform & pyriform (Ac & Py) glands) and venom glands. The pink line shows the closest relationship between the Ma and Mi glands. g Morphology of T. clavata silk glands. Similar results were obtained in three independent experiments and summarized in Source data. h Expression patterns of 28 spidroin genes in different types of silk glands. Source data are provided as a Source Data file.
Fig. 2
Fig. 2. Dragline silk origin and the functional character of the Ma gland segments.
a Schematic illustration of Ma gland segmentation. b Sodium dodecyl sulfate–polyacrylamide gel electrophoresis (SDS–PAGE) (left) and LC–MS (right) analyses of dragline silk protein. iBAQ, intensity-based absolute quantification. Similar results were obtained in three independent experiments and summarized in Source data. c Classification of the identified metabolites in dragline silk. d LC–MS analyses of the metabolites. e LC–MS analyses of the golden extract from T. clavata dragline silk. The golden pigment was extracted with 80% methanol. The extracted ion chromatograms (EICs) showed a peak at m/z 206 [M + H]+ for xanthurenic acid. f Pearson correlation of different Ma gland segments (Tail, Sac, and Duct). g Expression clustering of the Tail, Sac, and Duct. The transcriptomic data were clustered according to the hierarchical clustering (HC) method. h Combinational analysis of the transcriptome and proteome showing the expression profile of the dragline silk genes in the Tail, Sac, and Duct. i Concise biosynthetic pathway of xanthurenic acid (tryptophan metabolism) in the T. clavata Ma gland. Gene expression levels mapped to tryptophan metabolism are shown in three segments of the Ma gland. Enzymes involved in the pathway are indicated in red, and the genes encoding the enzymes are shown beside them. j Gene Ontology (GO) enrichment analysis of Ma gland segment-specific genes indicating the biological functions of the Tail, Sac, and Duct. The top 12 significantly enriched GO terms are shown for each segment of the Ma gland. A P-value <0.05 was set as the criterion for screening significantly enriched GO terms. Source data are provided as a Source Data file.
Fig. 3
Fig. 3. Comprehensive epigenetic features and ceRNA network of the tri-sectional Ma gland.
a Metagene plot of ATAC-seq signals and heatmap of the ATAC-seq read densities in the Tail, Sac, and Duct. The chromatin accessibility was indicated by the mean RPKM value (upper) and the blue region (bottom). b Metagene plot of DNA methylation levels in CG/CHG/CHH contexts in the Tail, Sac, and Duct. (c, d) Screenshots of the methylation and ATAC-seq tracks of the MaSp1b (c) and MaSp2b (d) genes within the Tail, Sac, and Duct. The potential TF motifs (E-value <1e−10) in the indicated peak set (2 kb upstream of the TSS) are listed to the right and sorted by position. Asterisks represent the shared TF motif within the corresponding MaSp group. e Venn network of TF motifs between MaSp-Group1 and MaSp-Group2. f Expression levels of miRNAs and lncRNAs in the Tail, Sac, and Duct. Date are presented as mean ± SD (n = 3 for each Ma segment). Box plots show minimum to maximum (whiskers), 25–75% (box), median (band inside) with all data points. g ceRNA network of the dragline silk genes.
Fig. 4
Fig. 4. Single-cell spatial architecture at the whole-Ma-gland scale.
a Uniform manifold approximation and projection (UMAP) analysis of cell types in the Ma gland and their grouping into ten cell clusters. The numbers in white-filled circles indicate cell clusters. The ubiquitous clusters are shown in the yellow series, the Sac clusters in the green series, and the Duct clusters in the blue series. b Pseudotime trajectory of all 9349 Ma gland cells. Each dot indicates a single cell, color-coded by the cluster as in (a). The numbers in black-filled circles indicate branch sites. The black arrows indicate the start of the trajectory. c Hematoxylin and eosin staining of Ma gland sections and unbiased clustering of spatial transcriptomic (ST) spots. Dotted lines depict the outline of the Ma gland. Similar results were obtained in three independent experiments and summarized in Source data. d UMAP and ST feature plots of the expression of genes in the MaSp group. e Heatmap showing the expression of Ma gland segment-specific genes in each cell type and each ST cluster along with corresponding GO terms. Source data are provided as a Source Data file.
Fig. 5
Fig. 5. Convergent evolution of the tri-sectional silk gland between T. clavata and B. mori.
a Morphology of the T. clavata Ma gland, dragline silk, B. mori silk gland, and cocoon silk. Insets show cross-sections of silk threads. Similar results were obtained in three independent experiments and summarized in Source data. b Schematic illustration showing the morphological convergence of the T. clavata Ma gland, with the Tail, Sac, and Duct indicated (above), and the B. mori silk gland, with the PSG, MSG, and ASG indicated (below). c Construction of the piggyBac transgenic vector (above) and silk gland phenotypes of the P1A-OE and wild-type (WT) strains in silkworm (below). Ser1-P, Ser1 promoter. 3 × P3-P, 3 × P3 promoter. SV40-T, SV40 terminator. L5D7 represents the 7th day of the fifth instar. The arrows indicate the silk production process, and a red cross indicates that the process was blocked. d Sequence alignment of the orthologous Hsp20 proteins (Tc04G175120 and BMSK0007630) in spider and silkworm. The red line indicates the editing region. The arrow shows the distribution of identified alleles around the cleavage site of the sgRNA. The top 16 sequences with a high percentage were exhibited. e Cocoon weight, pupa weight, and cocoon layer rate performance of the CRISPR/Cas9-based Hsp20 knockout silkworm strain. Data were presented as mean ± SD (n = 3). Statistical comparisons were made using two-tailed Student’s t test. ns indicates non-significant. **P-value <0.01. The arrow indicates the silk production process. The red line ending in a crossbar indicates that the process was suppressed. f Molecular functional convergence of the T. clavata Ma gland and the B. mori silk gland according to GO term analysis. A P-value < 0.05 was set as the criterion for screening significantly enriched GO terms. g Orthologous gene expression convergence between the T. clavata Ma gland and the B. mori silk gland. h, i Component convergence of protein (h) and metabolite (i) between silks produced by T. clavata and B. mori. The metabolites with a total intensity percentage above 90% were analyzed. The major metabolites in T. clavata dragline silk and B. mori cocoon silk are indicated in red. Source data are provided as a Source Data file.
Fig. 6
Fig. 6. Molecular basis of tri-sectional dragline silk generation in the T. clavata Ma gland.
Orange solid circles represent the genes with an FPKM > 10,000, and orange hollow circles represent the genes with an FPKM < 10,000, CA chromatin accessibility, Me methylation. Adobe Illustrator 2020 was used to create the image.

Similar articles

Cited by

References

    1. Natural History Museum Bern. World Spider Catalog. Version 23.5. http://wsc.nmbe.ch (accessed 17 July 2022).
    1. Pennisi E. Untangling spider biology. Science. 2017;358:288–291. doi: 10.1126/science.358.6361.288. - DOI - PubMed
    1. Vollrath F, Knight DP. Liquid crystalline spinning of spider silk. Nature. 2001;410:541–548. doi: 10.1038/35069000. - DOI - PubMed
    1. Garrison NL, et al. Spider phylogenomics: untangling the spider tree of life. PeerJ. 2016;4:e1719. doi: 10.7717/peerj.1719. - DOI - PMC - PubMed
    1. Roberts AD, et al. Synthetic biology for fibres, adhesives and active camouflage materials in protection and aerospace. MRS Commun. 2019;9:486–504. doi: 10.1557/mrc.2019.35. - DOI - PMC - PubMed

Publication types