. 2023 Feb 15;6(1):175.
doi: 10.1038/s42003-023-04546-2.

Selectivity for food in human ventral visual cortex

Affiliations

Selectivity for food in human ventral visual cortex

Nidhi Jain et al. Commun Biol. .

Abstract

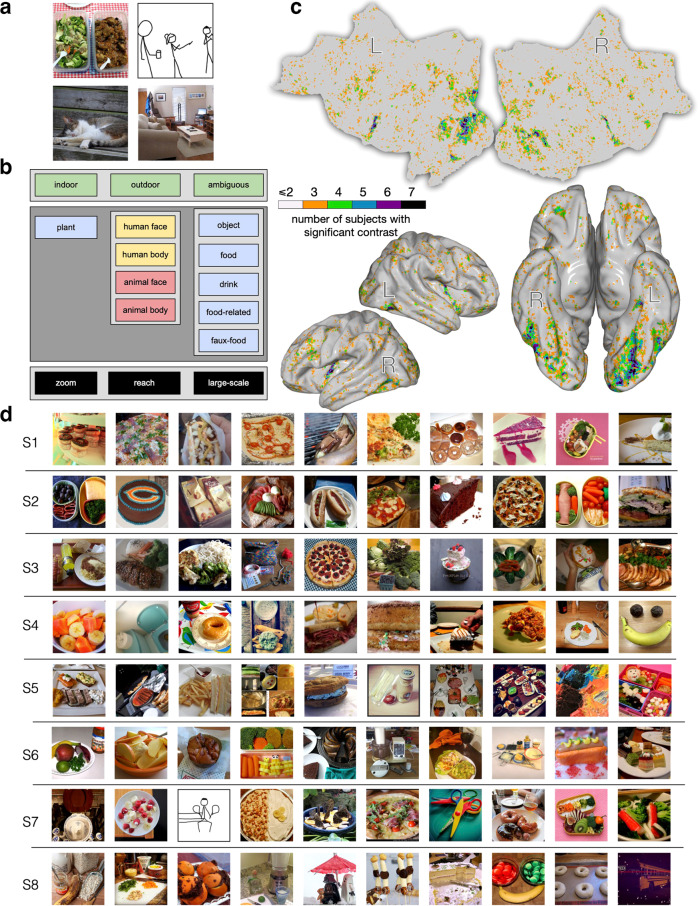
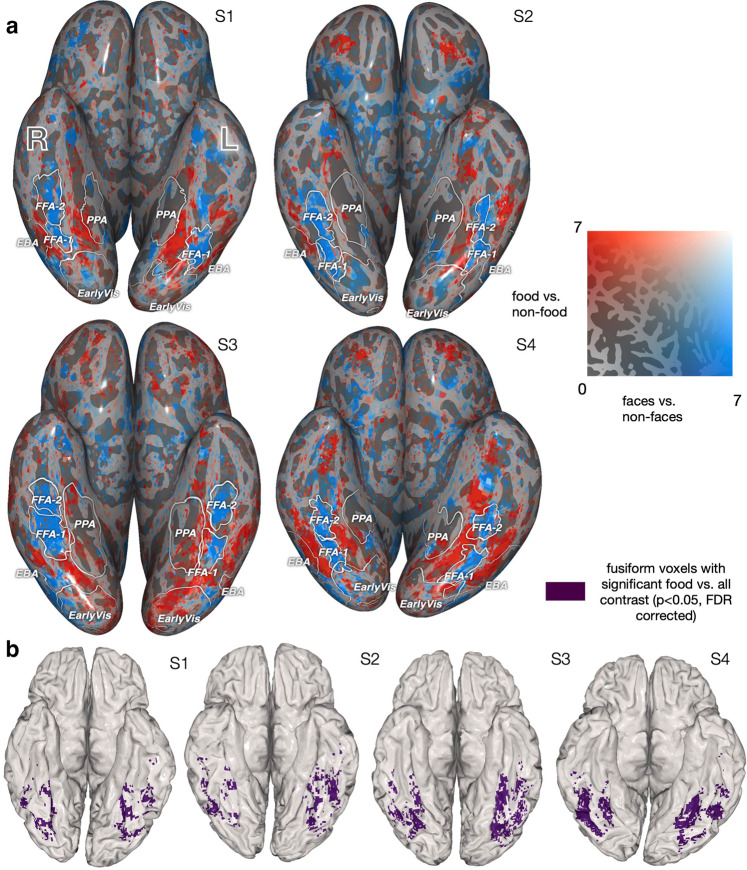
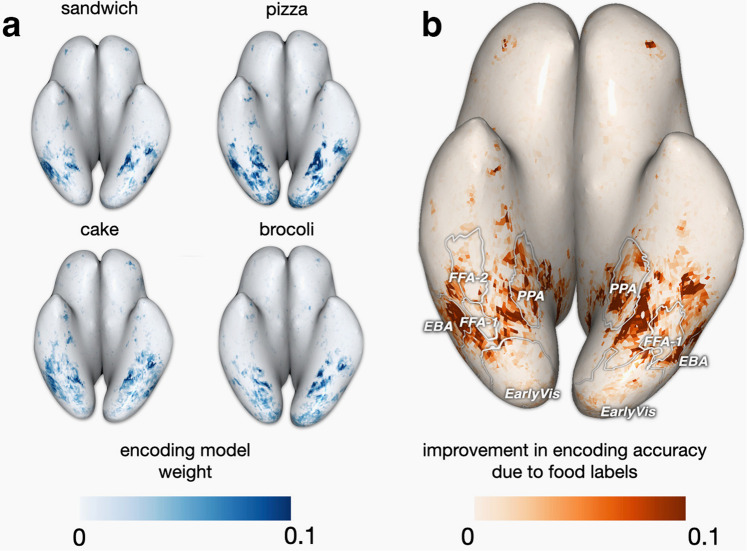
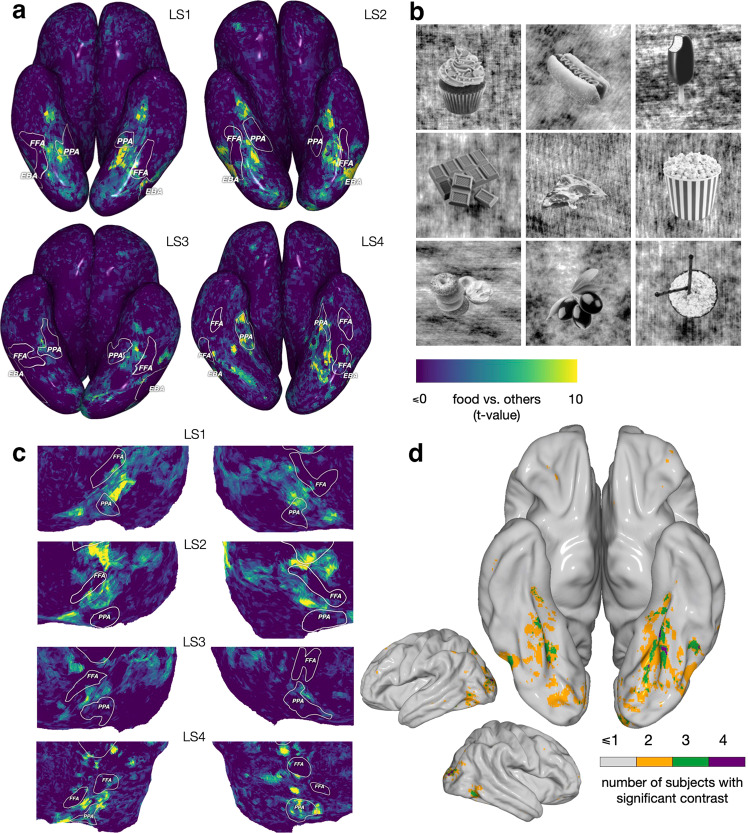
Visual cortex contains regions of selectivity for domains of ecological importance. Food is an evolutionarily critical category whose visual heterogeneity may make the identification of selectivity more challenging. We investigate neural responsiveness to food using natural images combined with large-scale human fMRI. Leveraging the improved sensitivity of modern designs and statistical analyses, we identify two food-selective regions in the ventral visual cortex. Our results are robust across 8 subjects from the Natural Scenes Dataset (NSD), multiple independent image sets and multiple analysis methods. We then test our findings of food selectivity in an fMRI "localizer" using grayscale food images. These independent results confirm the existence of food selectivity in ventral visual cortex and help illuminate why earlier studies may have failed to do so. Our identification of food-selective regions stands alongside prior findings of functional selectivity and adds to our understanding of the organization of knowledge within the human visual system.


Conflict of interest statement

The authors declare no competing interests.

Figures

Fig. 1
Fig. 1. Experiment 1. The images that could have been potentially viewed by all 8 subjects in NSD were manually relabeled to investigate responsiveness to naturalistic food images.
a Example images labeled as (clockwise, from upper left): {outdoor, food, food-related, reach} {indoor, human face, human body, object, large-scale}, {indoor, object, large-scale}, {outdoor, animal face, animal body, object, zoom}. b The labeling taxonomy, including attributes of location (top), content (middle), and image perspective (bottom). c Flattened, semi-inflated lateral, and semi-inflated bottom views of the MNI surface indicating voxels with higher activity for food than all non-food labels for the shared images. The subject count for a significant contrast was obtained at each MNI voxel. Voxels more responsive to food are found in the frontal, insular, and dorsal visual cortex, with the highest concentration across subjects occurring in the fusiform visual cortex. Both hemispheres show two strips within the fusiform that are separated by a gap that lies on the posterior-to-anterior axis. d Top 10 images per subject (S1–S8) leading to the largest responses in the food area. These images, which overwhelmingly depict food, were unique for each subject and were not in the set used to localize the food-selective region. Due to licensing concerns, images showing people that were used in our study have been replaced with stick figures representing the structure of the original stimulus images. Replacement images (badly) drawn by MJT.
Fig. 2
Fig. 2. Experiment 1. Food-selective regions at the individual subject level.
a Comparing the spatial localization of food- and face-selective neural populations on the ventral surface, for S1–S4 (see Suppl. Fig. S1 for S5–S8). Voxels’ t-statistics from two 1-sided t-tests comparing food vs. non-food (red) and face vs. non-face (blue). The regions identified by each contrast are largely non-overlapping. This pattern is maintained for food vs. non-(food and face) and face vs. non-(face and food) (Suppl. Fig. S5). b Spatial mask for food-selective regions used in subsequent analyses for S1–S4 (highlighting ventral visual responses). The mask is the overlap between the region that is identified from the t-test for food vs. non-food (a, red) at p < 0.05 (FDR corrected) and relevant neuroanatomically localized regions using the HCP atlas (see Methods).
Fig. 3
Fig. 3. Experiment 1. A consistent set of food-selective regions can be identified across independent image sets with different labeling schemes.
We used the set of images for each subject that were not included in previous analyses, and an encoding model built from the 80 COCO object labels. a Voxel-wise encoding model weights for four food sub-categories from the original COCO dataset, shown for S1. We see variability in the weights, such as (perhaps, not surprisingly) pizza yielding higher weights in some areas than broccoli. b We compared predictive accuracy of an encoding model with all COCO labels (including 13 food and 67 non-food labels) to an encoding model with only the 67 non-food COCO labels. On S1’s native surface, there is an improvement in validation set R2 values when including the food labels (R2 for the full model; R2 for the model with food removed), with S1–S8 results in Suppl. Fig. S6. Weights corresponding to individual food labels (a) and the pattern of improvement in R2 (b) highlight similar food-selective regions. Such consistent results lend further support for these regions being robustly food selective.
Fig. 4
Fig. 4. Experiment 1. PCA of responses from food-selective regions provides insight into their functional structure.
a Average principal component score across subjects for PC1, PC2, and PC3, shown on the MNI surface. Blue-green indicates high, brown indicates low PC scores. These top three PCs explain, respectively, 34.31%, 12.68%, and 11.16% of the variance. In (b) and (c), we show the images that lead to the highest and lowest activations in each PC. We include the 4 top and bottom images for ease of visualization. Top images for PC1 and PC2 are plotted in a 2D space (b), with the points connected to each image indicating its position in the space. In (c), we plot the top and bottom images for PC3 along a linear axis. Several patterns emerge here: PC1 scores yield small positive patches around the center of each food-preferring strip with more negative values close to the edges of each strip, and may capture the prominence of food in an image, separating images with focus on food in the foreground from those with food in the background. PC2 scores are higher medially (closer to PPA) and lower laterally, and seem to distinguish large-scale images of food-related places from close-by images of food and people eating food. PC3 scores in the right hemisphere food regions are lower at the center of the two strips, in the areas that border the FFA, while the left hemisphere does not show a clear pattern. PC3 appears to distinguish non-social food settings from social food settings. These results highlight that the combination of food with other ecologically important categories, including people (both faces and bodies) and places, creates a richer co-organization that reveals itself as gradients across cortex Due to licensing concerns, images showing people that were used in our study have been replaced with stick figures representing the structure of the original stimulus images. Replacement images (badly) drawn by MJT.
Fig. 5
Fig. 5. Experiment 2. Food-selective regions identified in an independent set of subjects using a visual localizer that includes grayscale images.
The fLoc localizer by Stigliani et al. was adapted to include a food condition that was constructed by identifying images of food items from different categories and with different shapes, converting them to grayscale and superposing them on the scrambled images from the fLoc localizer (see Methods). Other conditions included faces, bodies, places and written words. a t-value of the food vs. other contrast shown on the cortical surface (viewed from the bottom) of each localizer subject (LS1–LS4). For each subject, the PPA, FFA and EBA were traced using the corresponding conditions in the localizer. Food-selective regions with a high value for the food vs. other contrast sit between the FFA and PPA of different subjects, with some subjects having high values on both sides of the FFA. See Supplementary Fig. S9 for the significance thresholds. b Examples of the stimulus images used in the food condition. c A cut-out of the flattened brain of each subject providing a different view of the food regions. There exists some spatial variability between subjects, but the relationship between the ROIs is more stable. d Semi-inflated lateral and semi-inflated bottom views of the MNI surface indicating voxels the subject count for a significant food vs. all contrast. Voxels more responsive to food are found in the dorsal visual cortex, with the highest concentration across subjects occurring in the fusiform visual cortex. This result replicates our initial finding with NSD (compare with Fig. 1c). As predicted, the location of the food region is spatially variable across subjects (see Suppl. Fig. S10 to compare with the variability of other classical localizers).

References

    1. Sergent J, Ohta S, MacDonald B. Functional neuroanatomy of face and object processing: A positron emission tomography study. Brain. 1992;115:15–36. doi: 10.1093/brain/115.1.15. - DOI - PubMed
    1. Kanwisher N, McDermott J, Chun MM. The fusiform face area: a module in human extrastriate cortex specialized for face perception. J. Neurosci. 1997;17:4302–4311. doi: 10.1523/JNEUROSCI.17-11-04302.1997. - DOI - PMC - PubMed
    1. Epstein R, Kanwisher N. A cortical representation of the local visual environment. Nature. 1998;392:598–601. doi: 10.1038/33402. - DOI - PubMed
    1. Downing PE, Jiang Y, Shuman M, Kanwisher N. A cortical area selective for visual processing of the human body. Science. 2001;293:2470–2473. doi: 10.1126/science.1063414. - DOI - PubMed
    1. McCandliss BD, Cohen L, Dehaene S. The visual word form area: expertise for reading in the fusiform gyrus. Trends Cogn. Sci. 2003;7:293–299. doi: 10.1016/S1364-6613(03)00134-7. - DOI - PubMed

Publication types

MeSH terms