. 2023 Feb;614(7948):479-485.
doi: 10.1038/s41586-022-05586-0. Epub 2023 Feb 15.

Suppressed basal melting in the eastern Thwaites Glacier grounding zone

Affiliations

Suppressed basal melting in the eastern Thwaites Glacier grounding zone

Peter E D Davis et al. Nature. 2023 Feb.

Abstract

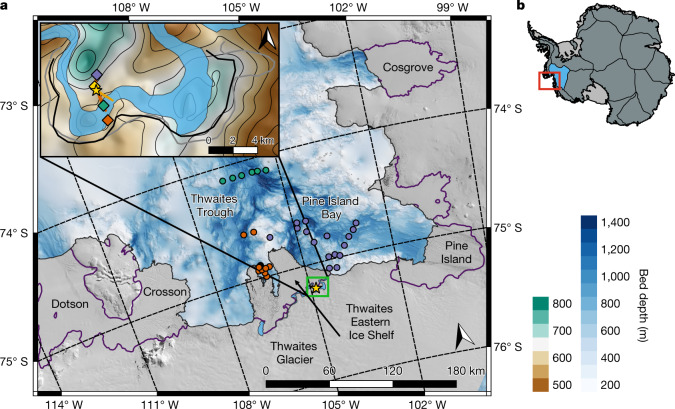
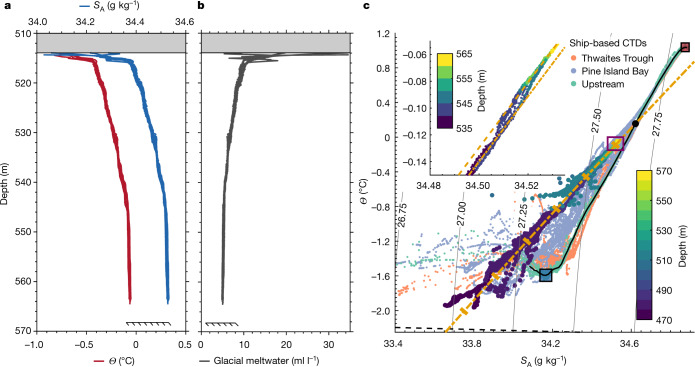
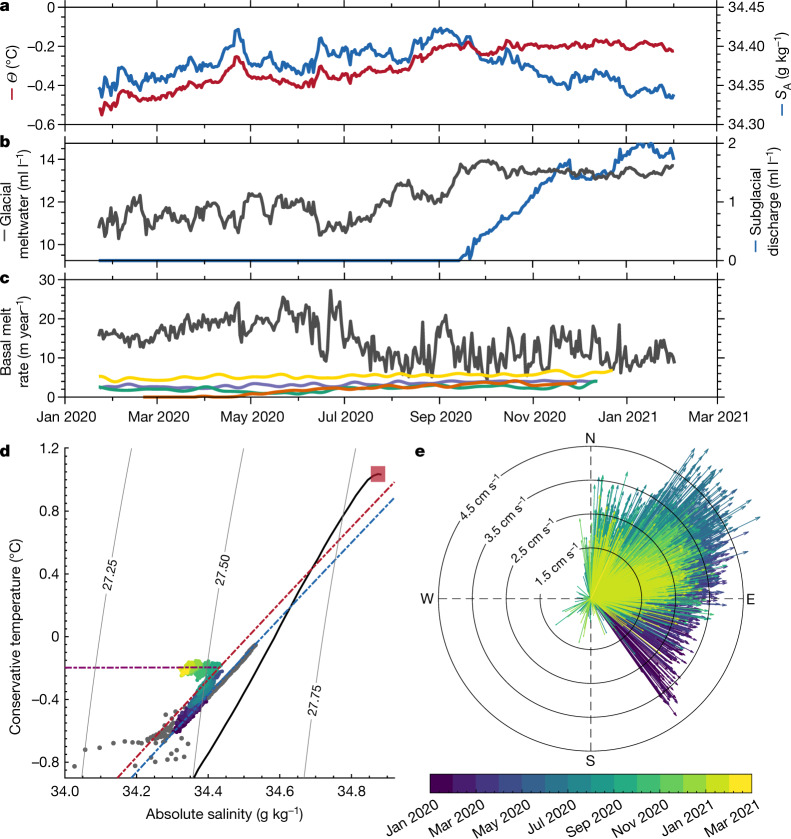
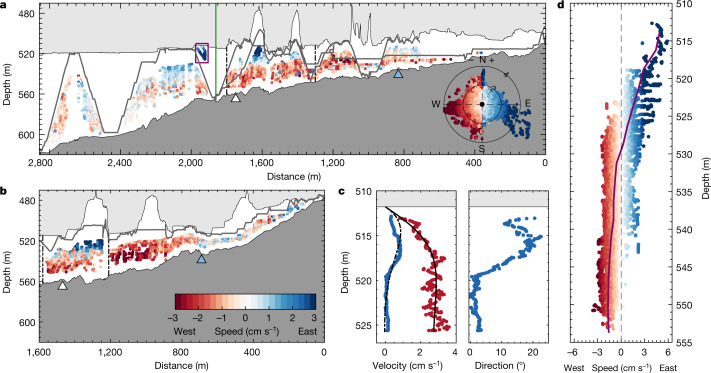
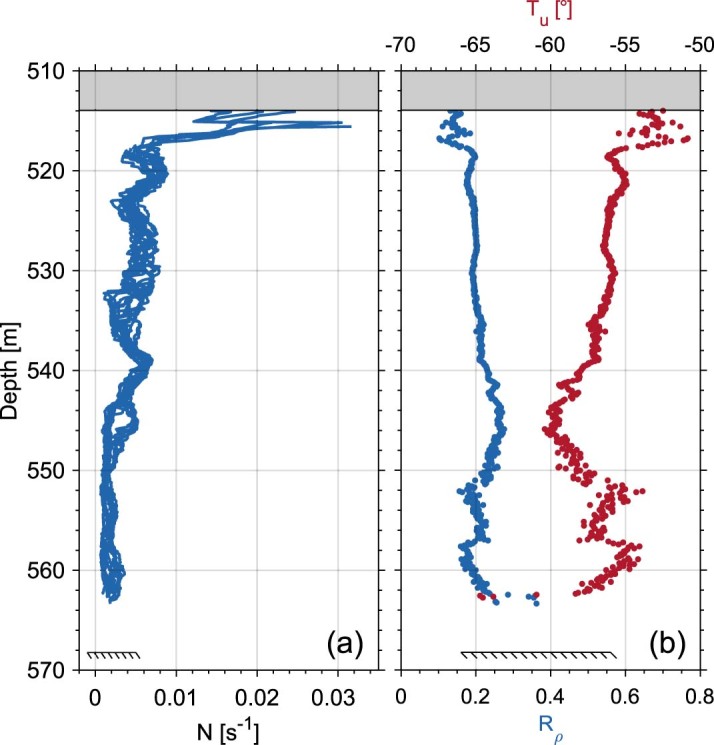
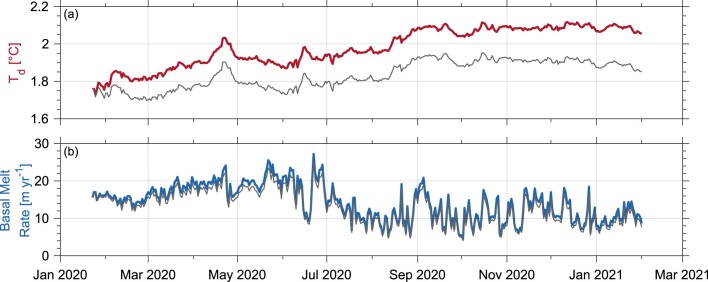
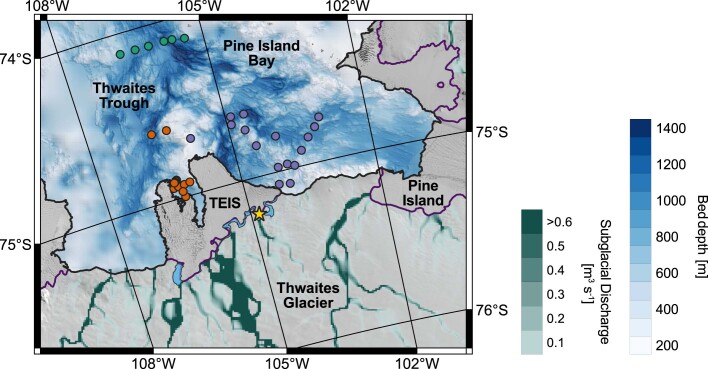
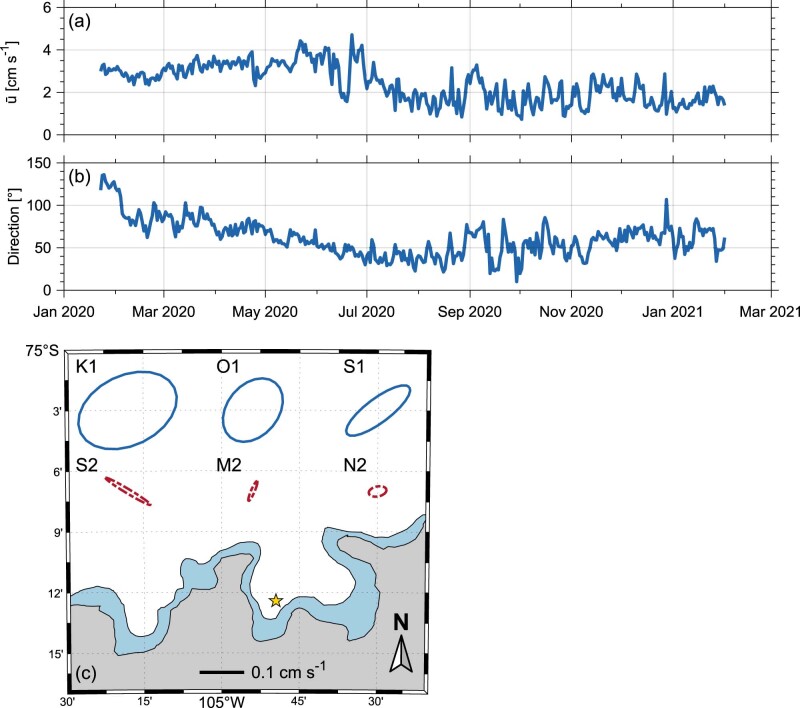
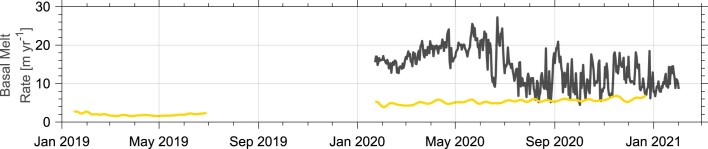
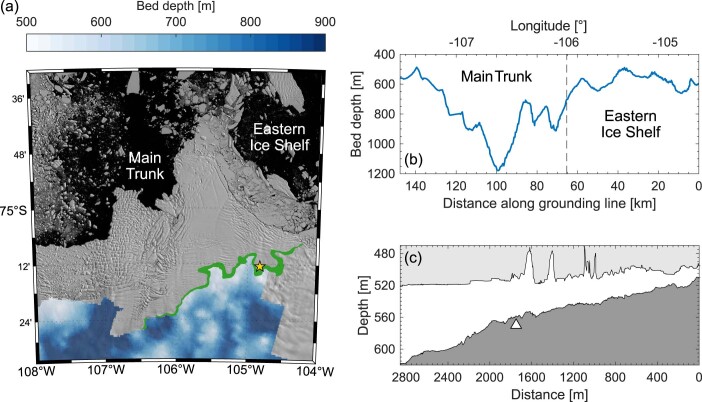
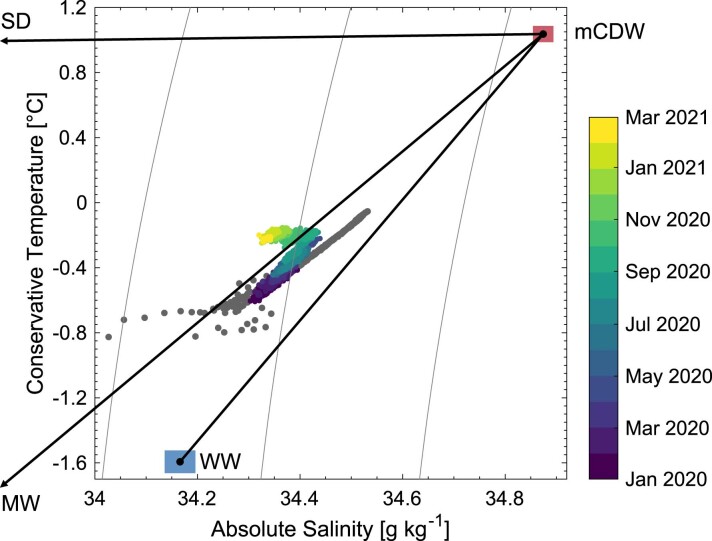
Thwaites Glacier is one of the fastest-changing ice-ocean systems in Antarctica1-3. Much of the ice sheet within the catchment of Thwaites Glacier is grounded below sea level on bedrock that deepens inland4, making it susceptible to rapid and irreversible ice loss that could raise the global sea level by more than half a metre2,3,5. The rate and extent of ice loss, and whether it proceeds irreversibly, are set by the ocean conditions and basal melting within the grounding-zone region where Thwaites Glacier first goes afloat3,6, both of which are largely unknown. Here we show-using observations from a hot-water-drilled access hole-that the grounding zone of Thwaites Eastern Ice Shelf (TEIS) is characterized by a warm and highly stable water column with temperatures substantially higher than the in situ freezing point. Despite these warm conditions, low current speeds and strong density stratification in the ice-ocean boundary layer actively restrict the vertical mixing of heat towards the ice base7,8, resulting in strongly suppressed basal melting. Our results demonstrate that the canonical model of ice-shelf basal melting used to generate sea-level projections cannot reproduce observed melt rates beneath this critically important glacier, and that rapid and possibly unstable grounding-line retreat may be associated with relatively modest basal melt rates.


Conflict of interest statement

The authors declare no competing interests.

Figures

Fig. 1
Fig. 1. Map of Thwaites Glacier and location of the observations used in this study.
a, Landsat 8 satellite image of Thwaites Glacier and the location of the hot-water-drilled access hole (yellow star; 75.207° S, 104.825° W) in the grounding-zone ‘butterfly’ region of TEIS (inset map). Blue-coloured contours with hillshade show bed depth in the Amundsen Sea from ship-based survey and BedMachine. The lilac, green and orange dots show the location of 2019–2020 ship-based CTD profiles from the International Thwaites Glacier Collaboration TARSAN project. The coastline (black) and grounding line (purple) are from the SCAR Antarctic Digital Database. The inset map shows the detail of the grounding-zone butterfly region. Green–brown-coloured contours with hillshade show bed depth from BedMachine. The blue-shaded area shows the location of the 2016–2017 grounding-zone region, whereas the solid black and grey lines show the position of the grounding line in 2019 and 2021, respectively. Green, purple, orange and yellow diamonds show the location of ApRES instruments measuring the basal melt rate, in addition to the ApRES located at the hot-water-drilled access hole (yellow star). The red (T1) and orange (T2) lines show the transects taken by the Icefin remotely operated underwater vehicle. b, Overview of Antarctica using data from MEaSUREs Antarctic Boundaries with the location of Thwaites Glacier shown by the red box. Thin black lines delineate the main ice-sheet drainage basins, with the Thwaites drainage basin highlighted in blue. Figure 1 was created with the QGIS Geographic Information System.
Fig. 2
Fig. 2. Hydrography and meltwater content beneath TEIS.
a,b, Vertical profiles of conservative temperature (Θ; red) and absolute salinity (SA; blue) (a) and glacial meltwater content (grey) (b) collected over 4 days (9 to 12 January 2020) in the grounding-zone region of Thwaites Glacier (yellow star in Fig. 1). The ice base is indicated by the shaded grey box and the seabed is indicated by the slash-backed line. c, ΘSA diagram with σ0 (density) contours for the grounding-zone CTD and Icefin data (large dots coloured by depth) and the ship-based CTD data from the International Thwaites Glacier Collaboration TARSAN project (small dots coloured by location: orange for Thwaites Trough, purple for Pine Island Bay and green for upstream that match the colours used to indicate their location in Fig. 1). The solid black line indicates the ambient mCDW–WW thermocline. The dot-dashed orange line indicates the meltwater mixing line that characterizes the grounding-zone data. The large black dot indicates where this meltwater mixing line intersects the ambient mCDW–WW thermocline. The thick orange dashes on the meltwater mixing line indicate 5 ml l−1 intervals in glacial meltwater content, starting at 0 ml l−1 at the large black dot. The dashed black line indicates the in situ freezing temperature as a function of salinity at the grounding line. The red and blue boxes with black outline indicate the range of Θ and SA values of the mCDW and WW endmembers. The inset axes in c show the ΘSA relationship coloured by depth (note the different colour scale) for the CTD data from the well-mixed benthic boundary layer (purple box in the main plot). The dashed orange line indicates the slightly warmer meltwater mixing line that characterizes the data from this region of the water column.
Fig. 3
Fig. 3. Temporal evolution of hydrographic conditions, meltwater content and basal melt rate.
a, Daily averaged time series of conservative temperature (Θ; red) and absolute salinity (SA; blue) from the ocean mooring deployed 1.5 m beneath the ice base. b, Glacial meltwater (grey) and subglacial runoff (blue) derived from observations of Θ and SA. c, Observed ApRES basal melt rate (green, purple, yellow and orange lines) low-pass-filtered with a 15-day cutoff plotted against the basal melt rate estimated from the three-equation melt-rate model (grey line; see Methods). The line colours for the ApRES basal melt-rate time series in c match their locations in Fig. 1. d, ΘSA diagram with σ0 contours for the time series data in a coloured as a function of time. The blue and red dot-dashed lines are meltwater mixing lines that fit the observed data for January 2020 (blue) and August 2020 (red). The purple dot-dashed line is a mixing line between the grounding-zone Θ and SA values in August 2020 and fresh subglacial runoff. The solid black line indicates the ambient mCDW–WW thermocline from ship-based CTD data (Fig. 2c), whereas the red-shaded box indicates the range of Θ and SA values of the mCDW endmember. The grey dots show the CTD data from the borehole. e, Velocity vectors from the sub-ice current meter coloured as a function of time. Radial contours indicate flow speed in cm s−1.
Fig. 4
Fig. 4. Cross-sections and vertical profiles of current speed and direction.
a,b, Flow speed and direction in the grounding-zone region from an ADCP mounted on the Icefin remotely operated underwater vehicle for transect T1 (a) and transect T2 (b) (see inset panel in Fig. 1). Individual data points are coloured by flow speed, with blue colours indicating flow to the east (into the page) and red colours indicating flow to the west (out of the page). The vehicle track is indicated by the grey line, with the ice shelf and seabed indicated by the light grey and dark grey patches, respectively. The green line in a marks the location of the borehole, and the purple box indicates the region of the water column plotted in c. Inset in a is geographic velocity vectors coloured by flow speed for the combined data from T1 and T2. Radial contours indicate flow speed in cm s−1. Triangles in a and b mark the location of historic grounding-line locations estimated from satellite interferometry in 2011 (white) and the furthest downstream estimate in 2016 (blue). c, u eastward velocity (blue), v northward velocity (red) and geographic flow direction within 14 m of the ice base about 2,000 m from the grounding zone along T1 (purple box in panel a). The dot-dashed and solid black lines show the u (dot-dashed) and v (solid) velocity profiles from an analytical model of an under-ice Ekman boundary layer. d, Average velocity profile coloured by flow speed for all velocity data between 1,300 m and 1,800 m from the grounding zone along transect T1 (black dot-dashed lines in panel a) and between 1,210 m and 1,580 m from the grounding zone along transect T2 (black dot-dashed lines in panel b).
Extended Data Fig. 1
Extended Data Fig. 1. Vertical profiles of buoyancy frequency, density ratio and Turner angle.
a,b, Individual vertical profiles of buoyancy frequency (N) (a) and average vertical profile of the density ratio (blue) and Turner angle (red; see Methods) (b) collected over 4 days (9 to 12 January 2020) in the grounding-zone region of Thwaites Glacier (yellow star in Fig. 1). The ice base is indicated by the shaded grey box and the seabed is indicated by the slash-backed line.
Extended Data Fig. 2
Extended Data Fig. 2. Thermal driving and basal melt rate from the three-equation melt-rate model.
a,b, Daily averaged time series of thermal driving (red) (a) and basal melt rate (blue) (b) predicted by the three-equation melt-rate model (see Methods). The grey lines in a and b show the thermal driving and basal melt rate corrected for effects of ice-base recession using the vertical profiles of Θ and SA from the CTD data (see Methods).
Extended Data Fig. 3
Extended Data Fig. 3. Subglacial discharge beneath Thwaites Glacier.
Landsat 8 satellite image of Thwaites Glacier and the location of the hot-water-drilled access hole (yellow star; 75.207° S, 104.825° W) in the grounding-zone ‘butterfly’ region of TEIS. White–blue-coloured contours with hillshade show bed depth in the Amundsen Sea from ship-based survey and BedMachine, whereas green-coloured contours show subglacial freshwater pathways and rate of discharge. The purple, green and orange dots show the location of 2019–2020 ship-based CTD profiles from the International Thwaites Glacier Collaboration TARSAN project. The coastline (black) and grounding line (purple) are from the SCAR Antarctic Digital Database. The blue-shaded area shows the location of the 2016–2017 grounding-zone region. Extended Data Figure 3 was created with the QGIS Geographic Information System.
Extended Data Fig. 4
Extended Data Fig. 4. Flow speed, direction and tidal ellipses.
a,b, Daily averaged time series of flow speed (a) and geographic flow direction (b) from the current meter deployed about 1.5 m beneath the ice base in the grounding-zone region of Thwaites Glacier (yellow star in Fig. 1). For flow direction, 0° indicates flow to the north, 90° indicates flow to the east and 150° indicates flow to the south of southeast. c, Amplitude and geographic orientation of the main diurnal (blue) and semidiurnal tidal constituents at the location of the borehole (yellow star). Solid lines indicate ellipses with positive semi-minor axes (anticlockwise rotation in time), whereas dot-dashed lines indicate ellipses with negative semi-minor axes (clockwise rotation in time). The blue polygon shows the location of the 2016–2017 grounding-zone region, and the grey area shows where the ice is grounded. The map in panel c was created with MATLAB.
Extended Data Fig. 5
Extended Data Fig. 5. Extended ApRES basal melt-rate time series from the borehole location.
Observed ApRES basal melt rate (yellow) at the borehole location (2020; yellow star in Fig. 1) and a secondary location 360 m downstream of the borehole location (2019; yellow diamond in Fig. 1) low-pass-filtered with a 15-day cutoff plotted against the basal melt rate estimated from the three-equation melt-rate model (grey; see Methods).
Extended Data Fig. 6
Extended Data Fig. 6. Bedrock depth along the Thwaites Glacier grounding line.
a, Sentinel-2 image of TEIS and Thwaites Main Trunk from 9 February 2019. Coloured contours show gridded bed depth beneath present-day grounded ice from NASA IceBridge Multichannel Coherent Radar Depth Sounder (MCoRDS) data collected over Thwaites Glacier between 1 January 2006 and 31 December 2012. The green area indicates the location of the 2016–2017 grounding-zone region, whereas the yellow star indicates the location of the hot-water-drilled access hole. b, Profile of bed depth along the present-day grounding line beneath TEIS and Thwaites Main Trunk from NASA IceBridge MCoRDS data. The dotted line at 106° W marks the boundary between TEIS and the Thwaites Main Trunk. c, Profiles of ice base (light grey) and seabed (dark grey) from the Icefin T1 transect. The white triangle marks the location of the 2011 grounding line from satellite interferometry. The map in panel a was created with MATLAB.
Extended Data Fig. 7
Extended Data Fig. 7. Temperature–salinity diagram and linear mixing lines between the main sub-ice shelf water masses.
Linear mixing lines between the mCDW (red box), WW (blue box), glacial MW and SD, along with ΘSA observations from each individual CTD cast (grey dots) and the sub-ice shelf mooring (dots coloured by time). Note that the endmember properties of MW and SD fall outside the range of the axes (Extended Data Table 2). From the end of September 2020 onwards, individual ΘSA observations lie above the mCDW–MW mixing line, indicating the presence of subglacial discharge and the negligible influence of WW.

Comment in

References

    1. Scambos TA, et al. How much, how fast?: A science review and outlook for research on the instability of Antarctica’s Thwaites Glacier in the 21st century. Glob. Planet. Change. 2017;153:16–34. doi: 10.1016/j.gloplacha.2017.04.008. - DOI
    1. Yu H, et al. Impact of iceberg calving on the retreat of Thwaites Glacier, West Antarctica over the next century with different calving laws and ocean thermal forcing. Geophys. Res. Lett. 2019;46:14539–14547. doi: 10.1029/2019GL084066. - DOI
    1. Joughin I, et al. Marine ice sheet collapse potentially under way for the Thwaites Glacier Basin, West Antarctica. Science. 2014;344:735–738. doi: 10.1126/science.1249055. - DOI - PubMed
    1. Fretwell P, et al. Bedmap2: improved ice bed, surface and thickness datasets for Antarctica. Cryosphere. 2013;7:375–393. doi: 10.5194/tc-7-375-2013. - DOI
    1. Morlighem M, et al. Deep glacial troughs and stabilizing ridges unveiled beneath the margins of the Antarctic ice sheet. Nat. Geosci. 2020;13:132–137. doi: 10.1038/s41561-019-0510-8. - DOI

Publication types