. 2023 Feb 15;13(1):2674.
doi: 10.1038/s41598-023-29804-5.

Cross-municipality migration and spread of tuberculosis in South Africa

Affiliations

Cross-municipality migration and spread of tuberculosis in South Africa

Abdou M Fofana et al. Sci Rep. .

Abstract

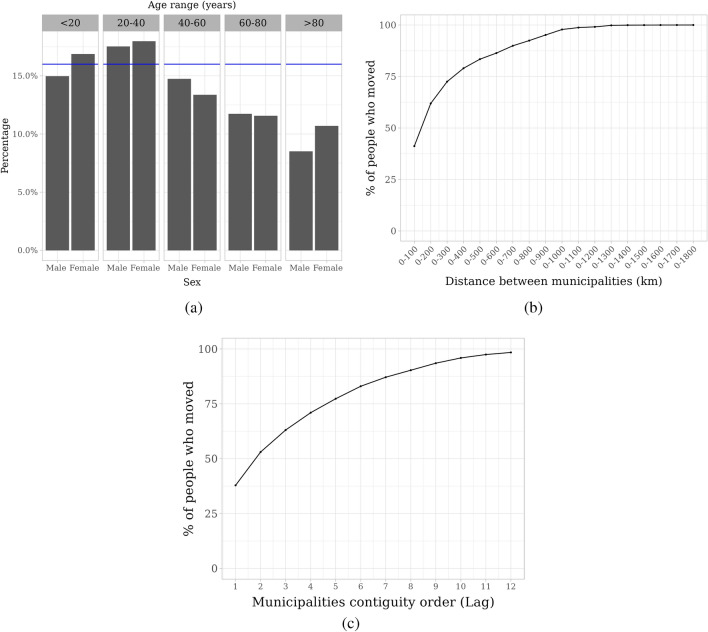
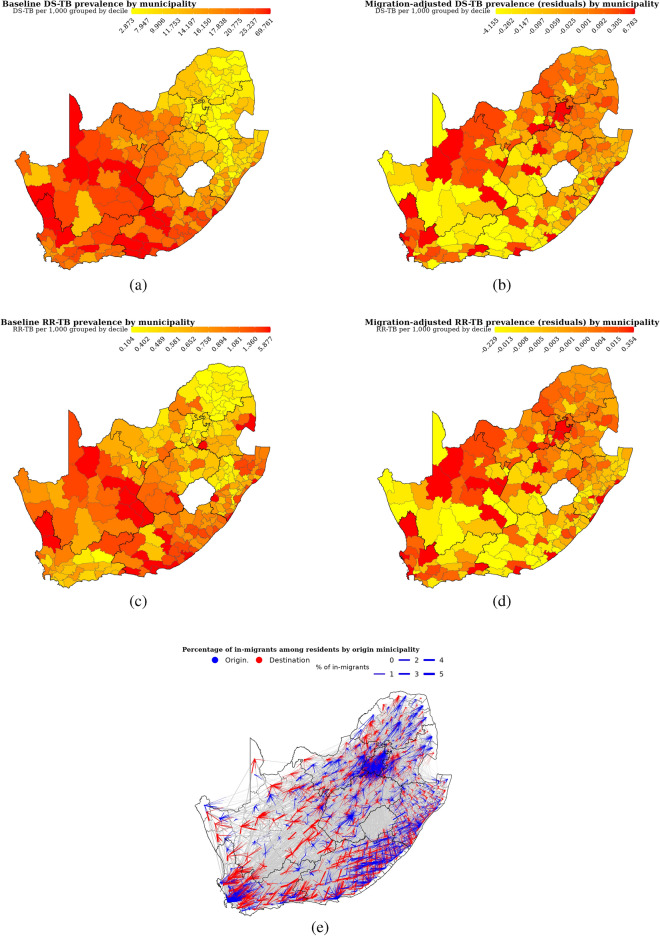
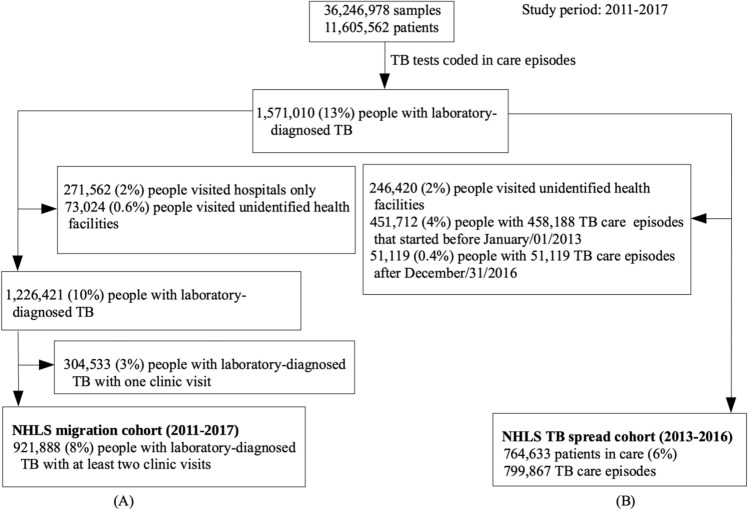
Human migration facilitates the spread of infectious disease. However, little is known about the contribution of migration to the spread of tuberculosis in South Africa. We analyzed longitudinal data on all tuberculosis test results recorded by South Africa's National Health Laboratory Service (NHLS), January 2011-July 2017, alongside municipality-level migration flows estimated from the 2016 South African Community Survey. We first assessed migration patterns in people with laboratory-diagnosed tuberculosis and analyzed demographic predictors. We then quantified the impact of cross-municipality migration on tuberculosis incidence in municipality-level regression models. The NHLS database included 921,888 patients with multiple clinic visits with TB tests. Of these, 147,513 (16%) had tests in different municipalities. The median (IQR) distance travelled was 304 (163 to 536) km. Migration was most common at ages 20-39 years and rates were similar for men and women. In municipality-level regression models, each 1% increase in migration-adjusted tuberculosis prevalence was associated with a 0.47% (95% CI: 0.03% to 0.90%) increase in the incidence of drug-susceptible tuberculosis two years later, even after controlling for baseline prevalence. Similar results were found for rifampicin-resistant tuberculosis. Accounting for migration improved our ability to predict future incidence of tuberculosis.


Conflict of interest statement

The authors declare no competing interests.

Figures

Figure 1
Figure 1
Cross-municipality migration rate stratified by demographics among people with laboratory-diagnosed tuberculosis (a) and stratified by distance (b) and contiguity between origin and destination municipalities (c) among people who moved. We calculated migration rate as the percentage of migrants among people with at least two clinic visits in each group. We defined migrants as people with laboratory-diagnosed tuberculosis who submitted tuberculosis test samples to clinics located in more than one municipality. We used laboratory tuberculosis test results, which were linked to identify individuals, from South Africa’s National Health Laboratory Service database to create a cohort (‘NHLS migration cohort’) to assess cross-municipality migration among people with laboratory-diagnosed tuberculosis. The blue line in (a) is migration rate in our migration cohort, distance in (b) was calculated as the geodesic distance between centroids of the origin and destination municipalities, and municipality contiguity order in (c) measures proximity between origin and destination municipalities based on kth order neighboring municipality.
Figure 2
Figure 2
Emigration (a) and immigration ratios (b) by municipality among people with laboratory-diagnosed TB, and map of South Africa showing provincial boundaries and major cities (c). We calculated municipality-level emigration ratio as the share of outmigrants among people who initially visited a municipality, and immigration ratio as the share of in-migrants among all people who subsequently visited a municipality. We used laboratory tuberculosis test results, which were linked to identify individuals, from South Africa’s National Health Laboratory Service database to assess cross-municipality migration among people with laboratory-diagnosed tuberculosis. We defined migrants as people with laboratory-diagnosed tuberculosis who submitted tuberculosis test samples to clinics located in more than one municipality. The symbols in (c) are major cities in South Africa: Square, circle, triangle point up, plus, cross, diamond, triangle down, and square cross symbols are city of Cape town, Buffalo city, Nelson Mandela Bay, Mangaung, Ethekwini, Ekurhuleni, city of Johannesburg, and city of Tshwane respectively.
Figure 3
Figure 3
Baseline drug-susceptible tuberculosis prevalence (a), migration-adjusted drug-susceptible prevalence (b), baseline rifampicin-resistant tuberculosis prevalence (c), migration-adjusted rifampicin-resistant tuberculosis prevalence (d) by municipality, and cross-municipality migration rates (e). Migration-adjusted prevalence was presented as the residuals (difference between migration-adjusted and baseline prevalence) which we estimated using municipality-level tuberculosis prevalence from South Africa’s National Health Laboratory Service database and cross-municipality migration rates from the 2016 South African Community Survey.
Figure 4
Figure 4
Flow diagram of our migration cohort (A) and tuberculosis spread cohort (B). The cohorts were created using tuberculosis laboratory results, which were linked to identify individuals, from South Africa’s National Health Laboratory Service database. We used the migration cohort to assess cross-municipality migration in people with laboratory-diagnosed tuberculosis and tuberculosis spread cohort to quantify the role of migration in tuberculosis spread.

References

    1. Ismail N, et al. Prevalence of drug-resistant tuberculosis and imputed burden in South Africa: A national and sub-national cross-sectional survey. Lancet Infect. Dis. 2018;18:779–787. doi: 10.1016/S1473-3099(18)30222-6. - DOI - PMC - PubMed
    1. McIntosh A, et al. Using routinely collected laboratory data to identify high rifampicin-resistant tuberculosis burden communities in the Western Cape Province, South Africa: A retrospective spatiotemporal analysis. PLoS Med. 2018;15:e1002638. doi: 10.1371/journal.pmed.1002638. - DOI - PMC - PubMed
    1. Changruenngam S, Bicout D, Modchang C. How the individual human mobility spatio-temporally shapes the disease transmission dynamics. Sci. Rep. 2020;10:1–13. doi: 10.1038/s41598-020-68230-9. - DOI - PMC - PubMed
    1. Dougherty E, Seidel D, Carlson C, Spiegel O, Getz W. Going through the motions: Incorporating movement analyses into disease research. Ecol. Lett. 2018;21:588–604. doi: 10.1111/ele.12917. - DOI - PubMed
    1. Charu V, et al. Human mobility and the spatial transmission of influenza in the United States. PLoS Comput. Biol. 2017;13:e1005382. doi: 10.1371/journal.pcbi.1005382. - DOI - PMC - PubMed