

The interplay between spatiotemporal overlap and morphology as determinants of microstructure suggests no 'perfect fit' in a bat-flower network
- PMID: 36792891
- PMCID: PMC9932087
- DOI: 10.1038/s41598-023-29965-3
The interplay between spatiotemporal overlap and morphology as determinants of microstructure suggests no 'perfect fit' in a bat-flower network
Abstract
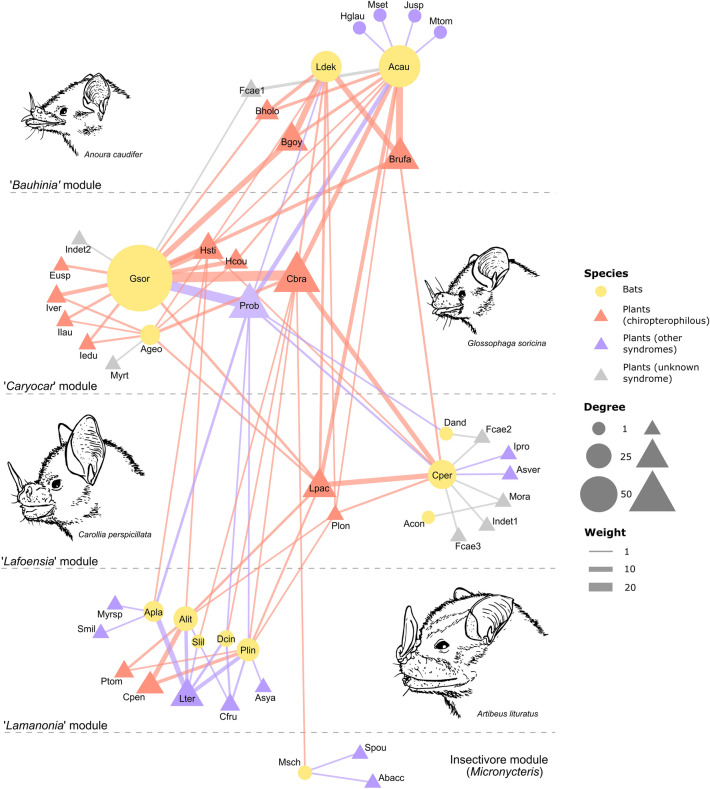
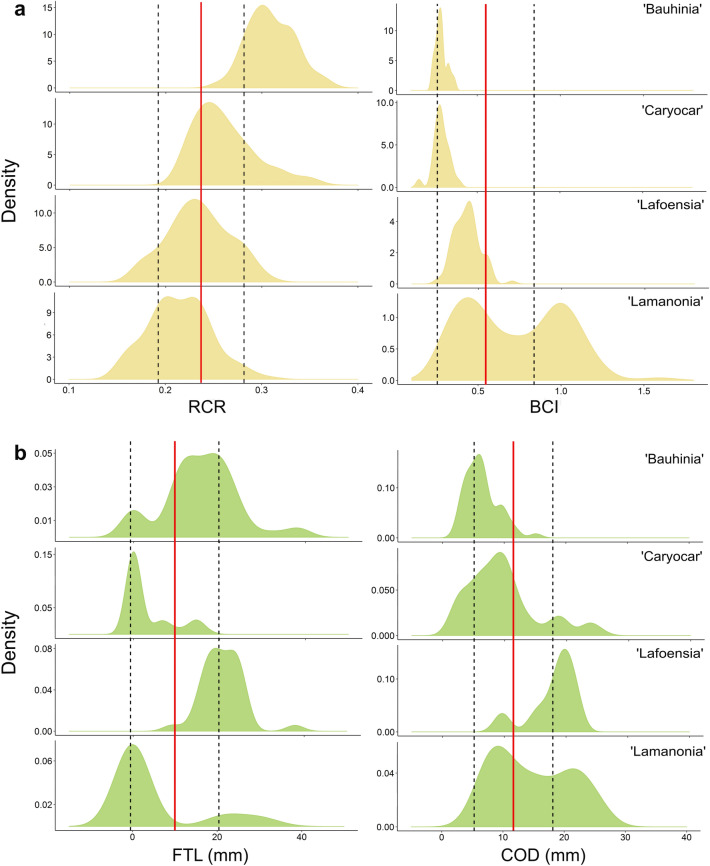
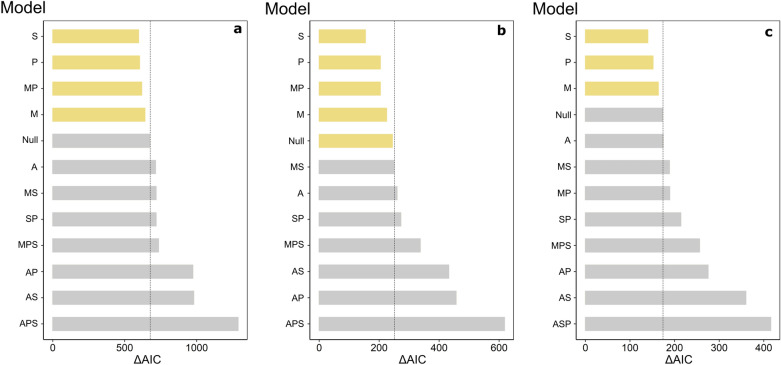
Plant-pollinator interactions in diverse tropical communities are often predicted by a combination of ecological variables, yet the interaction drivers between flower-visiting bats and plants at the community level are poorly understood. We assembled a network between Neotropical bats and flowering plants to describe its macrostructure and to test the role of neutral and niche variables in predicting microstructure. We found a moderately generalized network with internally nested modules comprising functionally similar plant and bat species. Modules grouped bats and plants with matching degrees of specialization but had considerable overlap in species morphologies and several inter-module interactions. The spatiotemporal overlap between species, closely followed by morphology, and not abundance, were the best predictors of microstructure, with functional groups of bats also interacting more frequently with plants in certain vegetation types (e.g., frugivores within forests) and seasons (e.g., long-snouted nectarivores in the dry season). Therefore, flower-visiting bats appear to have species-specific niche spaces delimited not only by their ability to exploit certain flower types but also by preferred foraging habitats and the timing of resource availability. The prominent role of resource dissimilarity across vegetation types and seasons likely reflects the heterogeneity of Neotropical savannas, and further research in biomes beyond the Cerrado is needed to better understand the complexity of this system.
© 2023. The Author(s).
Conflict of interest statement
The authors declare no competing interests.
Figures

References
-
- Sutherland WJ, et al. Identification of 100 fundamental ecological questions. J. Ecol. 2013;101:58–67. doi: 10.1111/1365-2745.12025. - DOI
-
- Schleuning M, Fründ J, García D. Predicting ecosystem functions from biodiversity and mutualistic networks: An extension of trait-based concepts to plant–animal interactions. Ecography. 2015;38:380–392. doi: 10.1111/ecog.00983. - DOI
-
- Armbruster WS. The specialization continuum in pollination systems: Diversity of concepts and implications for ecology, evolution and conservation. Funct. Ecol. 2017;31:88–100. doi: 10.1111/1365-2435.12783. - DOI
-
- Olito C, Fox JW. Species traits and abundances predict metrics of plant–pollinator network structure, but not pairwise interactions. Oikos. 2015;124:428–436. doi: 10.1111/oik.01439. - DOI
Publication types
MeSH terms
LinkOut - more resources
Full Text Sources
