

petiteFinder: an automated computer vision tool to compute Petite colony frequencies in baker's yeast
- PMID: 36793007
- PMCID: PMC9930278
- DOI: 10.1186/s12859-023-05168-5
petiteFinder: an automated computer vision tool to compute Petite colony frequencies in baker's yeast
Abstract
Background: Mitochondrial respiration is central to cellular and organismal health in eukaryotes. In baker's yeast, however, respiration is dispensable under fermentation conditions. Because yeast are tolerant of this mitochondrial dysfunction, yeast are widely used by biologists as a model organism to ask a variety of questions about the integrity of mitochondrial respiration. Fortunately, baker's yeast also display a visually identifiable Petite colony phenotype that indicates when cells are incapable of respiration. Petite colonies are smaller than their Grande (wild-type) counterparts, and their frequency can be used to infer the integrity of mitochondrial respiration in populations of cells. Unfortunately, the computation of Petite colony frequencies currently relies on laborious manual colony counting methods which limit both experimental throughput and reproducibility.
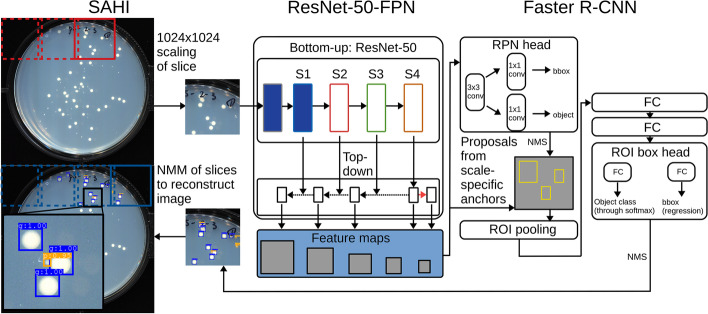
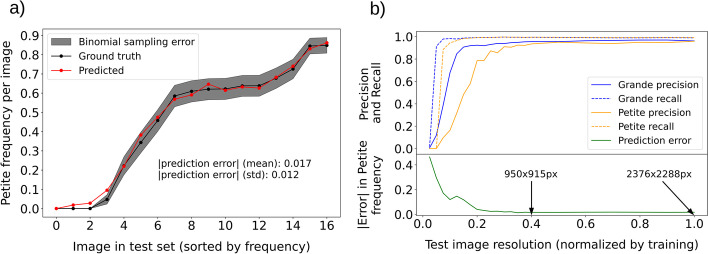
Results: To address these problems, we introduce a deep learning enabled tool, petiteFinder, that increases the throughput of the Petite frequency assay. This automated computer vision tool detects Grande and Petite colonies and computes Petite colony frequencies from scanned images of Petri dishes. It achieves accuracy comparable to human annotation but at up to 100 times the speed and outperforms semi-supervised Grande/Petite colony classification approaches. Combined with the detailed experimental protocols we provide, we believe this study can serve as a foundation to standardize this assay. Finally, we comment on how Petite colony detection as a computer vision problem highlights ongoing difficulties with small object detection in existing object detection architectures.
Conclusion: Colony detection with petiteFinder results in high accuracy Petite and Grande detection in images in a completely automated fashion. It addresses issues in scalability and reproducibility of the Petite colony assay which currently relies on manual colony counting. By constructing this tool and providing details of experimental conditions, we hope this study will enable larger-scale experiments that rely on Petite colony frequencies to infer mitochondrial function in yeast.
Keywords: Baker’s yeast; Colony morphology; Computer vision; Mitochondrial respiration; Object detection.
© 2023. The Author(s).
Conflict of interest statement
The authors declare that they have no competing interests.
Figures


Similar articles
-
Factors which affect the frequency of sporulation and tetrad formation in Saccharomyces cerevisiae baker's yeasts.Appl Environ Microbiol. 1995 Feb;61(2):630-8. doi: 10.1128/aem.61.2.630-638.1995. Appl Environ Microbiol. 1995. PMID: 7574601 Free PMC article.
-
Genomic stability of Saccharomyces cerevisiae baker's yeasts.Syst Appl Microbiol. 1999 Sep;22(3):329-40. doi: 10.1016/S0723-2020(99)80040-X. Syst Appl Microbiol. 1999. PMID: 10553285
-
New Saccharomyces cerevisiae baker's yeast displaying enhanced resistance to freezing.J Agric Food Chem. 2003 Jan 15;51(2):483-91. doi: 10.1021/jf020701a. J Agric Food Chem. 2003. PMID: 12517114
-
The petite mutation in yeasts: 50 years on.Int Rev Cytol. 2000;194:197-238. doi: 10.1016/s0074-7696(08)62397-9. Int Rev Cytol. 2000. PMID: 10494627 Review.
-
Inventions on baker's yeast strains and specialty ingredients.Recent Pat Food Nutr Agric. 2009 Jun;1(2):104-32. doi: 10.2174/2212798410901020104. Recent Pat Food Nutr Agric. 2009. PMID: 20653532 Review.
Cited by
-
[PSI]-CIC: A Deep-Learning Pipeline for the Annotation of Sectored Saccharomyces cerevisiae Colonies.Bull Math Biol. 2024 Dec 6;87(1):12. doi: 10.1007/s11538-024-01379-w. Bull Math Biol. 2024. PMID: 39641894 Free PMC article.
References
-
- Ephrussi B, Hottinguer H, Tavlitzki J. Action de l’acriflovine sur les levures: ii-etude genetique de mutant petite colonie. Ann Inst Pasteur. 1949;76:419–450.
-
- Ephrussi B. Nucleo-cytoplasmic relations in micro-organisms–their bearing on cell heredity and differentiation. Oxford: Oxford at the Clarendon Press; 1953.
MeSH terms
Grants and funding
LinkOut - more resources
Full Text Sources
Molecular Biology Databases
