. 2023 Feb 15;23(1):36.
doi: 10.1186/s12911-023-02111-9.

Towards a clinically-based common coordinate framework for the human gut cell atlas: the gut models

Affiliations

Towards a clinically-based common coordinate framework for the human gut cell atlas: the gut models

Albert Burger et al. BMC Med Inform Decis Mak. .

Abstract

Background: The Human Cell Atlas resource will deliver single cell transcriptome data spatially organised in terms of gross anatomy, tissue location and with images of cellular histology. This will enable the application of bioinformatics analysis, machine learning and data mining revealing an atlas of cell types, sub-types, varying states and ultimately cellular changes related to disease conditions. To further develop the understanding of specific pathological and histopathological phenotypes with their spatial relationships and dependencies, a more sophisticated spatial descriptive framework is required to enable integration and analysis in spatial terms.

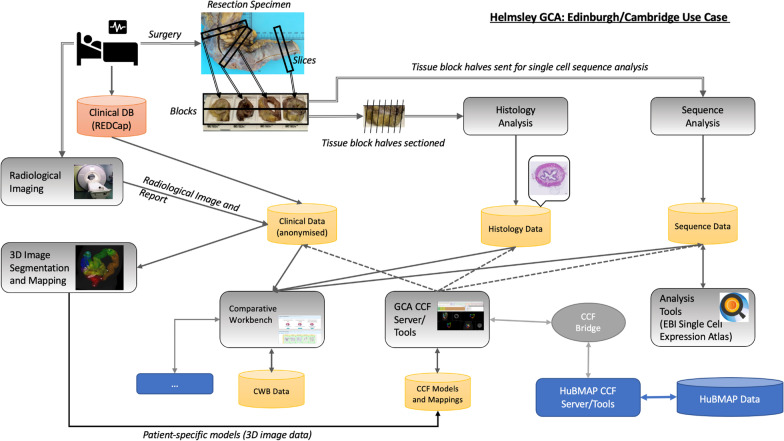
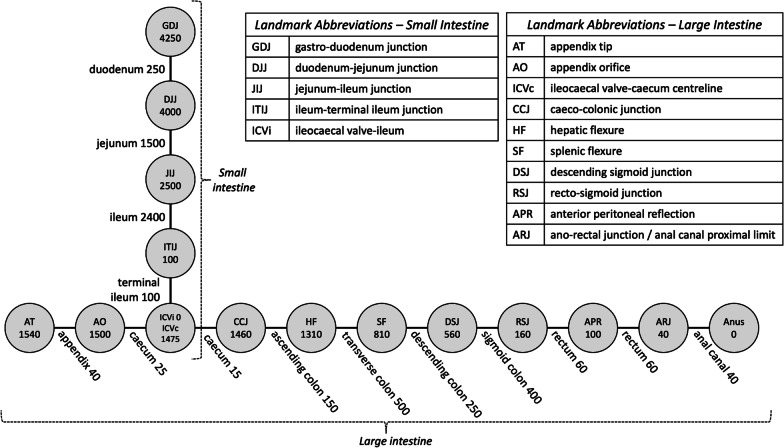
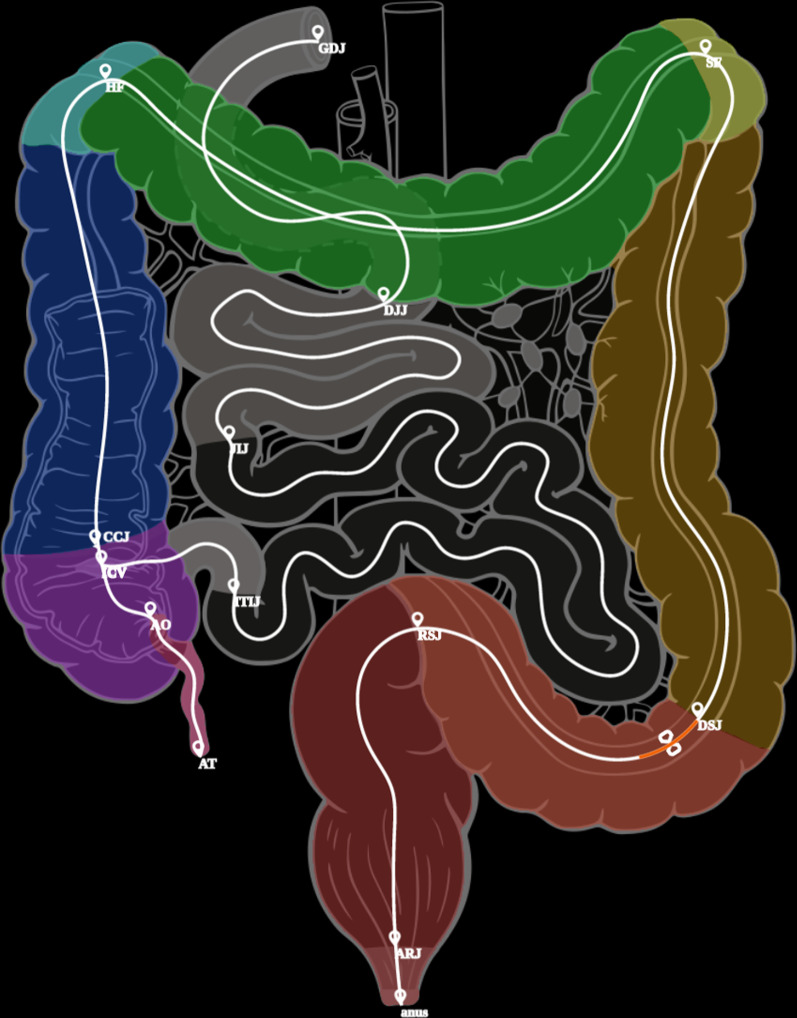
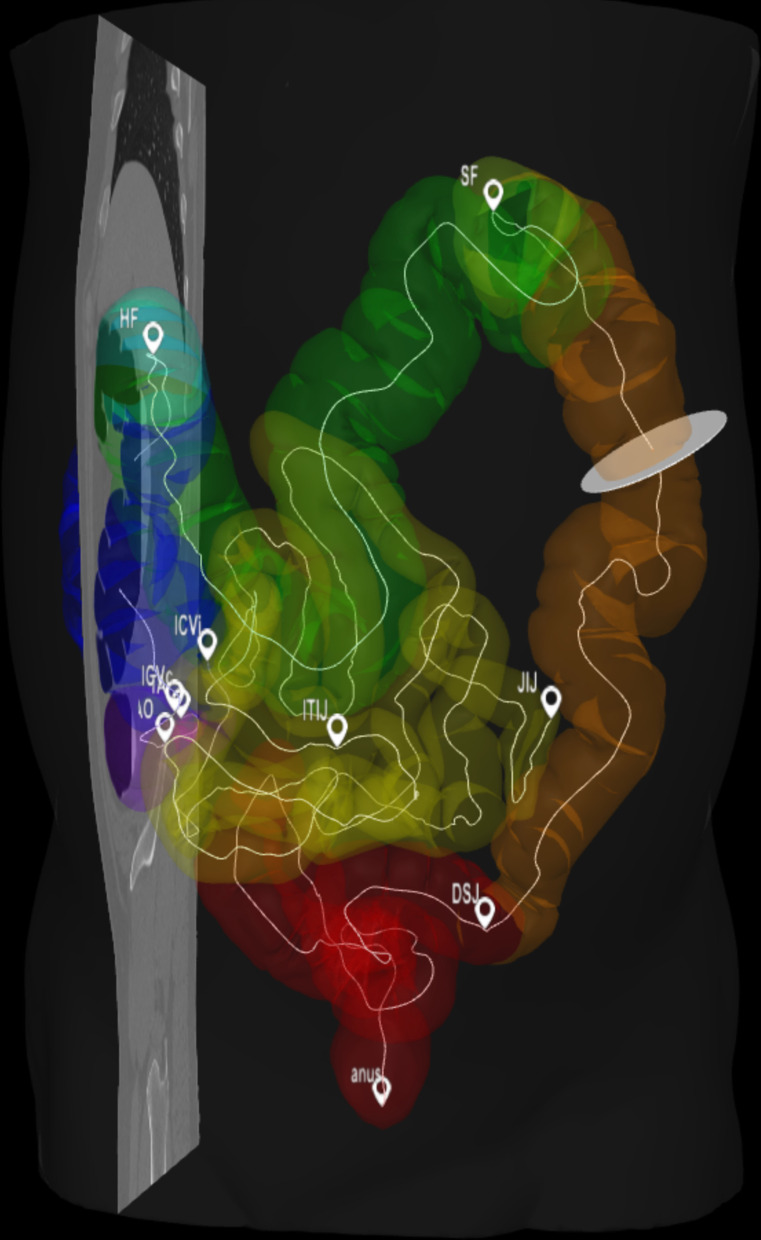
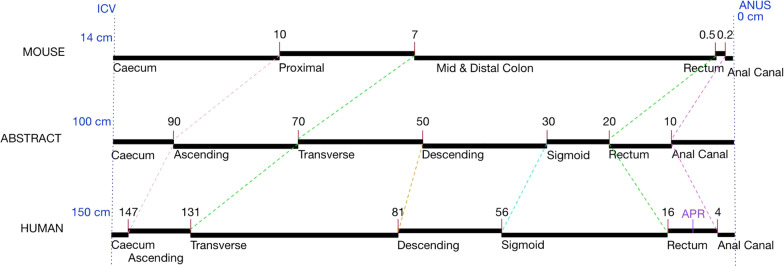
Methods: We describe a conceptual coordinate model for the Gut Cell Atlas (small and large intestines). Here, we focus on a Gut Linear Model (1-dimensional representation based on the centreline of the gut) that represents the location semantics as typically used by clinicians and pathologists when describing location in the gut. This knowledge representation is based on a set of standardised gut anatomy ontology terms describing regions in situ, such as ileum or transverse colon, and landmarks, such as ileo-caecal valve or hepatic flexure, together with relative or absolute distance measures. We show how locations in the 1D model can be mapped to and from points and regions in both a 2D model and 3D models, such as a patient's CT scan where the gut has been segmented.

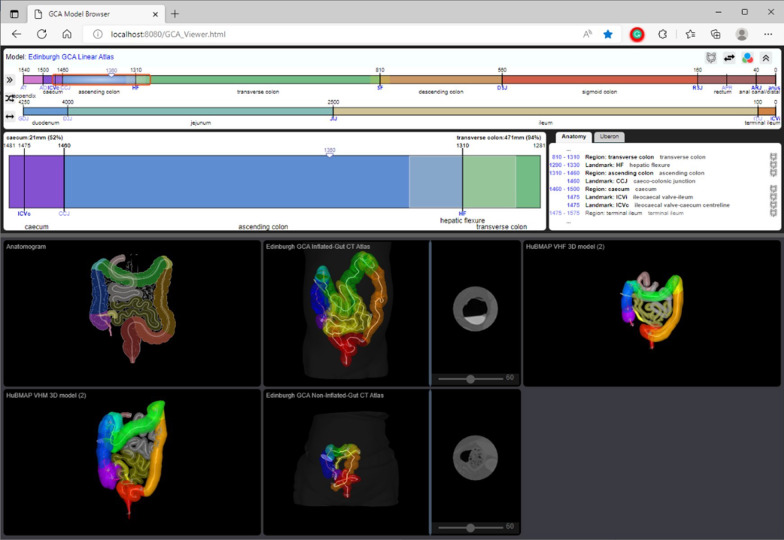
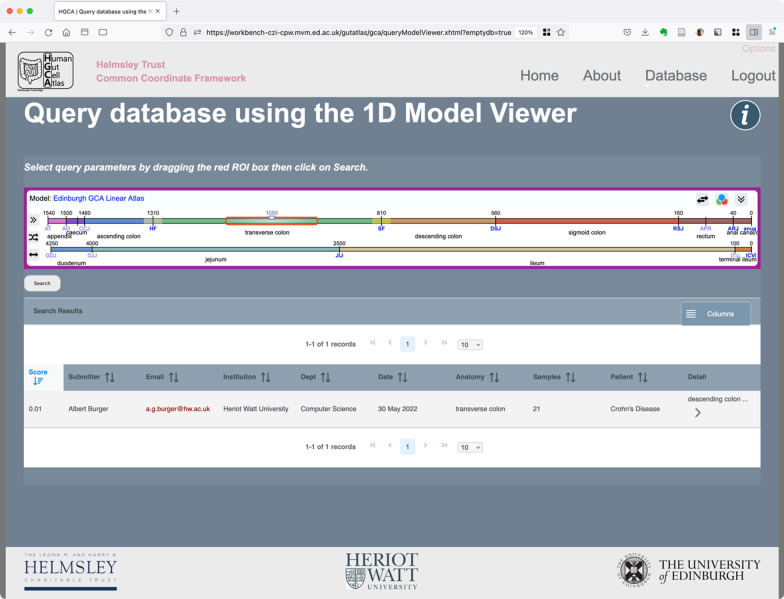
Results: The outputs of this work include 1D, 2D and 3D models of the human gut, delivered through publicly accessible Json and image files. We also illustrate the mappings between models using a demonstrator tool that allows the user to explore the anatomical space of the gut. All data and software is fully open-source and available online.

Conclusions: Small and large intestines have a natural "gut coordinate" system best represented as a 1D centreline through the gut tube, reflecting functional differences. Such a 1D centreline model with landmarks, visualised using viewer software allows interoperable translation to both a 2D anatomogram model and multiple 3D models of the intestines. This permits users to accurately locate samples for data comparison.

Keywords: Common coordinate framework; Human cell atlas; Human gut cell atlas.


Conflict of interest statement

The authors declare that they have no competing interests.

Figures

Fig. 1
Fig. 1
Endoscope showing distance markings. These could be used to establish a gut-location by taking readings for the sample location coupled with the nearest proximal and nearest distal gut landmarks e.g. the hepatic and splenic flexures for locations within the transverse colon
Fig. 2
Fig. 2
Edinburgh-Cambridge Helmsley Trust project HGCA CCF use-case. The project design includes pre-surgery MRI imaging followed by Crohn’s lesion resection. The resected material is processed to produce histological sections for staining and imaging matched to adjacent tissues used for single-cell transcriptomics. The transcriptome data is archived at and accessible from the Single Cell Expression Atlas and the radiological and histology image data is submitted to the HCA archive
Fig. 3
Fig. 3
1D Core Model depicted as a graph, with nodes representing anatomical landmarks and edges representing anatomical regions. Regions are generally delimited by their start and end landmarks. The rectum has an additional intermediate landmark known as the anterior peritoneal reflection (APR) and the caecum has an additional intermediate landmark known as the ileocaecal valve (ICV). In the context of the large intestine, the latter is referred to as the ileocaecal valve-caecum centreline (ICVc), whereas the end point for the small intestine is labelled as the ileocaecal valve-ileum (ICVi). Numbers in nodes represent the landmarks’ distances (in mm) to the anus (for large intestine) and the ICVi (for small intestine). Numbers on links represent the lengths (in mm) of the corresponding gut region. The numbers shown in this diagram reflect a typical live human’s anatomy, different patients will have different measurements
Fig. 4
Fig. 4
Gut Anatomogram with segmented domains, midline paths and all gut landmarks displayed. This image is captured as a screen shot from the model online visualisation, on the screen the markers and associated text are easier to read. The orange bar at the proximal end of the sigmoid colon depicts the position of the region of interest
Fig. 5
Fig. 5
Screenshot of the 3D model viewer showing the segmented large intestine and ileum. The mid-line paths are shown as thin white curved lines with landmarks between sections indicated as small “flags” each labelled with their respective abbreviation. Note in this screenshot image the markers and text are not very distinct compared with the live viewer with a zoom capability. The viewer allows arbitrary sections through the original image to be viewed in the context of the surface models and the cross-sectional disc through the descending colon indicates the position of the image view through the colon shown in Fig. 5
Fig. 6
Fig. 6
Browser screenshot of Edinburgh Gut Cell Atlas viewer containing the linear model viewer in the upper panel and the 2D and 3D viewer in the lower panel. The browser can be accessed through the project web page [34]
Fig. 7
Fig. 7
Model-based Query Interface. The red rectangle is used to identify the Region of Interest. Where there is an overlap between the selected query region and the previously recorded image annotation results are returned (sorted by the Jaccard Index)
Fig. 8
Fig. 8
Linear Model-based Mapping of Gut Location across mouse and human using an abstract intermediate

References

    1. Regev A, Teichmann SA, Lander ES, Amit I, Benoist C, Birney E, et al. The human cell atlas. Elife. 2017;6:e27041. doi: 10.7554/eLife.27041. - DOI - PMC - PubMed
    1. Human Cell Atlas Home Page. https://www.humancellatlas.org/. Accessed 18 Nov 2022.
    1. Alatab S, Sepanlou SG, Ikuta K, Vahedi H, Bisignano C, Safiri S, et al. The global, regional, and national burden of inflammatory bowel disease in 195 countries and territories, 1990–2017: a systematic analysis for the Global Burden of Disease Study 2017. Lancet Gastroenterol Hepatol. 2020;5:17–30. doi: 10.1016/S2468-1253(19)30333-4. - DOI - PMC - PubMed
    1. Narula N, Wong ECL, Dehghan M, Mente A, Rangarajan S, Lanas F, et al. Association of ultra-processed food intake with risk of inflammatory bowel disease: prospective cohort study. BMJ. 2021;374:n1554. doi: 10.1136/bmj.n1554. - DOI - PMC - PubMed
    1. Racine A, Carbonnel F, Chan SSM, Hart AR, Bueno-de-Mesquita HB, Oldenburg B, et al. Dietary patterns and risk of inflammatory bowel disease in Europe: results from the EPIC study. Inflamm Bowel Dis. 2016;22:345–354. doi: 10.1097/MIB.0000000000000638. - DOI - PubMed

Publication types

LinkOut - more resources