

Implementation fidelity of a multifactorial in-hospital fall prevention program and its association with unit systems factors: a single center, cross-sectional study
- PMID: 36793084
- PMCID: PMC9930071
- DOI: 10.1186/s12913-023-09157-5
Implementation fidelity of a multifactorial in-hospital fall prevention program and its association with unit systems factors: a single center, cross-sectional study
Abstract
Background: Falls are a common, costly global public health burden. In hospitals, multifactorial fall prevention programs have proved effective in reducing falls' incidence; however, translating those programs accurately into daily clinical practice remains challenging. This study's aim was to identify ward-level system factors associated with implementation fidelity to a multifactorial fall prevention program (StuPA) targeting hospitalized adult patients in an acute care setting.
Methods: This retrospective cross-sectional study used administrative data on 11,827 patients admitted between July and December 2019 to 19 acute care wards at the University Hospital Basel, Switzerland, as well as data on the StuPA implementation evaluation survey conducted in April 2019. Data were analysed using descriptive statistics, Pearson's coefficients and linear regression modelling for variables of interest.
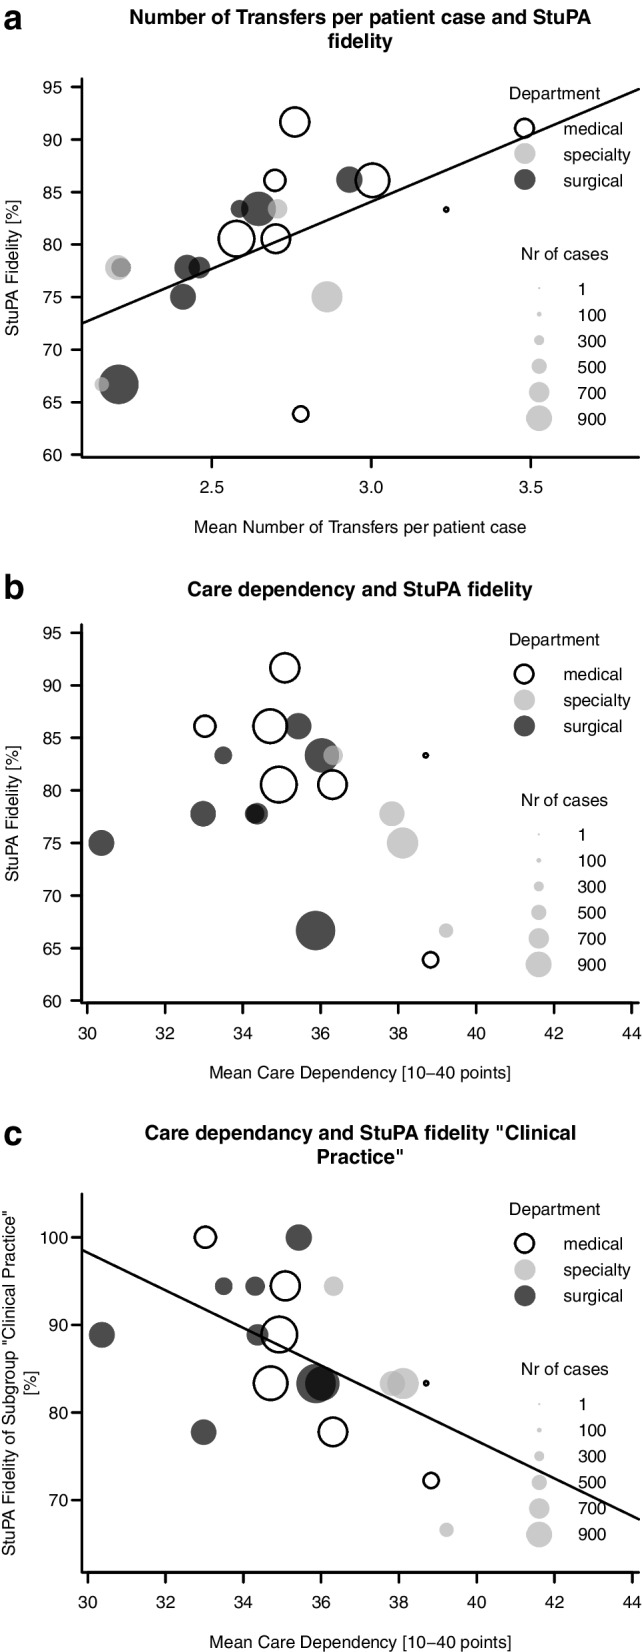
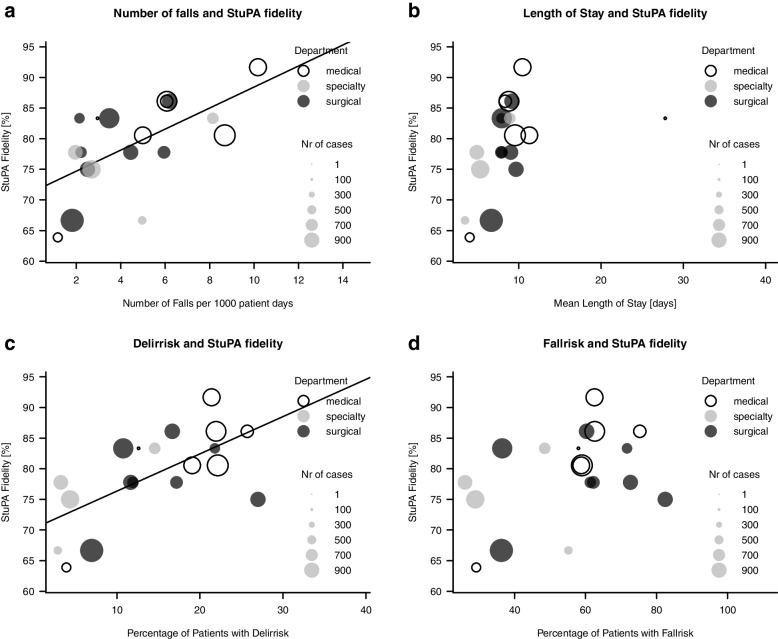
Results: The patient sample had an average age of 68 years and a median length of stay of 8.4 (IQR: 2.1) days. The mean care dependency score was 35.4 points (ePA-AC scale: from 10 points (totally dependent) to 40 points (totally independent)); the mean number of transfers per patient -(e.g., change of room, admission, discharge) was 2.6 (range: 2.4- 2.8). Overall, 336 patients (2.8%) experienced at least one fall, resulting in a rate of 5.1 falls per 1'000 patient days. The median inter-ward StuPA implementation fidelity was 80.6% (range: 63.9-91.7%). We found the mean number of inpatient transfers during hospitalisation and the mean ward-level patient care dependency to be statistically significant predictors of StuPA implementation fidelity.
Conclusion: Wards with higher care dependency and patient transfer levels showed higher implementation fidelity to the fall prevention program. Therefore, we assume that patients with the highest fall prevention needs received greater exposure to the program. For the StuPA fall prevention program, our results suggest a need for implementation strategies contextually adapted to the specific characteristics of the target wards and patients.
Keywords: Accidental falls; Fall prevention program; Implementation outcomes; Implementation science; Patient safety; Preventive health services; Routinely collected health data.
© 2023. The Author(s).
Conflict of interest statement
The authors declare that they have no competing interests.
Figures
References
-
- WHO. WHO Falls Factsheet who.int: World Health Organisation. 2018. updated 16 January 2018. Available from: https://www.who.int/en/news-room/fact-sheets/detail/falls.
-
- ANQ . Nationaler Vergleichsbericht Sturz und Dekubitus Erwachsene. 2019.
MeSH terms
LinkOut - more resources
Full Text Sources
Research Materials
Miscellaneous
