. 2023 Feb 16;25(1):14.
doi: 10.1186/s12968-023-00922-3.

Localized strain characterization of cardiomyopathy in Duchenne muscular dystrophy using novel 4D kinematic analysis of cine cardiovascular magnetic resonance

Affiliations

Localized strain characterization of cardiomyopathy in Duchenne muscular dystrophy using novel 4D kinematic analysis of cine cardiovascular magnetic resonance

Conner C Earl et al. J Cardiovasc Magn Reson. .

Abstract

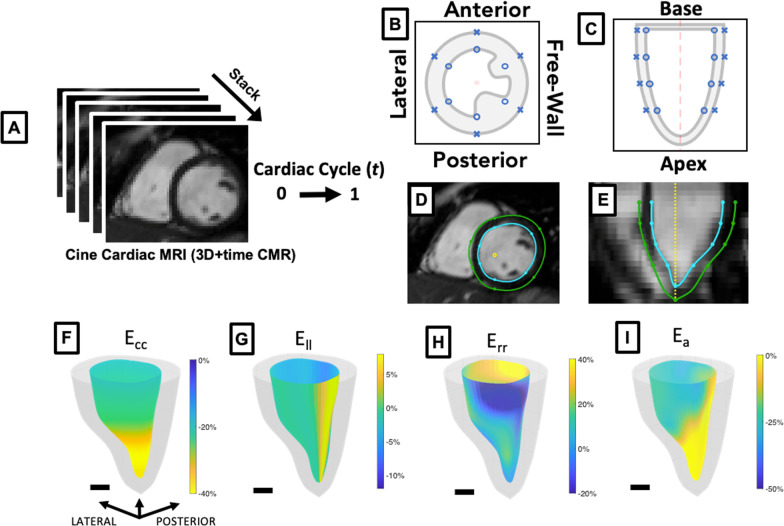
Background: Cardiomyopathy (CMP) is the most common cause of mortality in Duchenne muscular dystrophy (DMD), though the age of onset and clinical progression vary. We applied a novel 4D (3D + time) strain analysis method using cine cardiovascular magnetic resonance (CMR) imaging data to determine if localized strain metrics derived from 4D image analysis would be sensitive and specific for characterizing DMD CMP.

Methods: We analyzed short-axis cine CMR image stacks from 43 DMD patients (median age: 12.23 yrs [10.6-16.5]; [interquartile range]) and 25 male healthy controls (median age: 16.2 yrs [13.3-20.7]). A subset of 25 male DMD patients age-matched to the controls (median age: 15.7 yrs [14.0-17.8]) was used for comparative metrics. CMR images were compiled into 4D sequences for feature-tracking strain analysis using custom-built software. Unpaired t-test and receiver operator characteristic area under the curve (AUC) analysis were used to determine statistical significance. Spearman's rho was used to determine correlation.

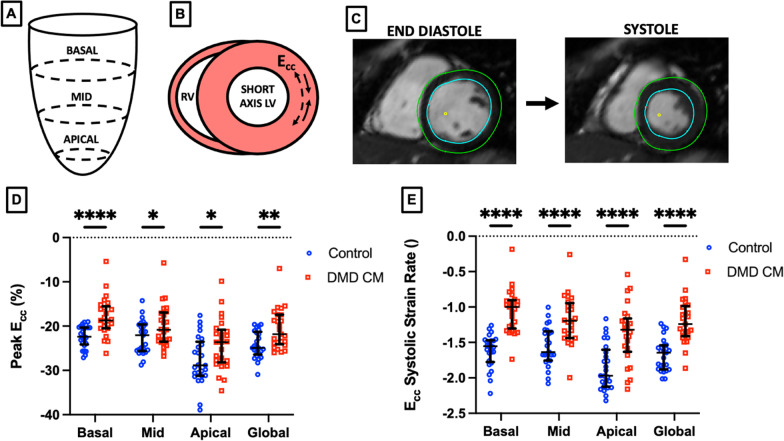
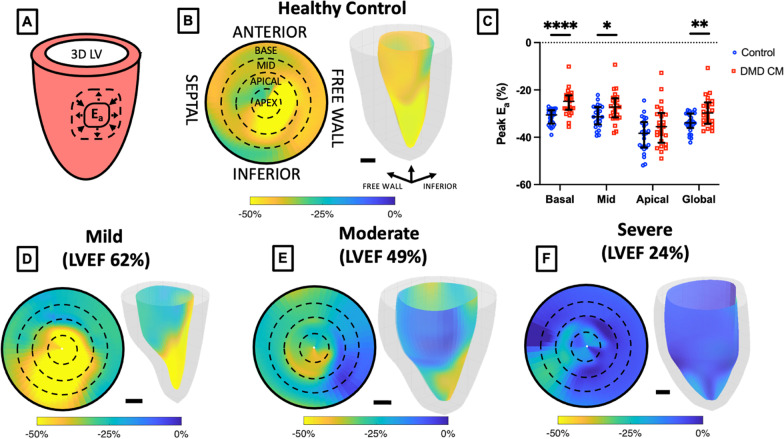
Results: DMD patients had a range of CMP severity: 15 (35% of total) had left ventricular ejection fraction (LVEF) > 55% with no findings of myocardial late gadolinium enhancement (LGE), 15 (35%) had findings of LGE with LVEF > 55% and 13 (30%) had LGE with LVEF < 55%. The magnitude of the peak basal circumferential strain, basal radial strain, and basal surface area strain were all significantly decreased in DMD patients relative to healthy controls (p < 0.001) with AUC values of 0.80, 0.89, and 0.84 respectively for peak strain and 0.96, 0.91, and 0.98 respectively for systolic strain rate. Peak basal radial strain, basal radial systolic strain rate, and basal circumferential systolic strain rate magnitude values were also significantly decreased in mild CMP (No LGE, LVEF > 55%) compared to a healthy control group (p < 0.001 for all). Surface area strain significantly correlated with LVEF and extracellular volume (ECV) respectively in the basal (rho = - 0.45, 0.40), mid (rho = - 0.46, 0.46), and apical (rho = - 0.42, 0.47) regions.

Conclusion: Strain analysis of 3D cine CMR images in DMD CMP patients generates localized kinematic parameters that strongly differentiate disease from control and correlate with LVEF and ECV.

Keywords: 3D; 4D; Cardiac biomechanics; Cardiac magnetic resonance; Cardiomyopathy; Duchenne muscular dystrophy; Strain.


Conflict of interest statement

The authors have no competing interests related to publication of this work.

Figures

Fig. 1
Fig. 1
3D + time CMR localized strain analysis A 3D + time cardiovascular magnetic resonance (CMR) image created from 2D cine short -axis image stack. B, C 48 point left ventricular (LV) feature-tracking schematic with example images in short-axis (D) and long axis (E) views from a MATLAB-based graphical user interface. Example circumferential (Ecc; F), longitudinal (Ell; G), radial (Err; H), surface area (Ea; I) colorized strain maps at peak systole derived from 3D + time CMR images of a Duchenne muscular dystrophy (DMD) patient from MATLAB feature-tracking analysis. FI also correspond to Additional files 1, 2, 3, 4. Scale bar = 1 cm
Fig. 2
Fig. 2
3D + time CMR- derived localized Ecc peak circumferential strain and systolic strain rate can discriminate between DMD (n = 43) and healthy control (n = 25) subjects. A, B Schematic representation of regional circumferential strain (Ecc). C Example CMR image slice depicting feature-tracked endocardium (blue) and epicardium (green) D Localized peak Ecc and E systolic strain rate (normalized to cardiac cycle) shows significant differences between healthy control subjects and DMD patients- particularly in the basal region for peak strain and in all regions for systolic strain rate. *p < 0.05, **p < 0.01, ****p < 0.001, error bars depict median and interquartile range
Fig. 3
Fig. 3
3D + time CMR-derived localized systolic strain rate can discriminate between DMD patients (n = 43) and healthy control (n = 25) subjects. A, B Schematic representation of localized longitudinal strain (Ell) and strain rate. C Example 4D CMR long-axis image slice depicting feature-tracked endocardium (blue) and epicardium (green), D Localized peak Ell between DMD patients and healthy control subjects less significant than peak Ell, however E Ell systolic strain rate (normalized to cardiac cycle) shows significant differences between healthy control subjects and DMD patients in all regions. **p < 0.01, ***p < 0.001, error bars depict median and interquartile range
Fig. 4
Fig. 4
3D + time CMR localized radial strain significantly different in DMD vs. Control patients. A Short-axis schematic representation of radial strain (Err). B Healthy control polar plot with overlaid slice-level polar map and 3D LV colorized endocardium representation of localized Err. C Localized and global peak Err significantly different between healthy control subjects and DMD patients. D Mild, E moderate, and F severe (as determined by LV ejection fraction) DMD patient examples of 17 segment polar and 3D colorized LV representations of peak Err. Scale bar = 1 cm. **p < 0.01, ****p < 0.001, error bars depict median and interquartile range
Fig. 5
Fig. 5
3D + time CMR localized surface area strain significantly different in DMD vs. healthy control subjects. A Short-axis schematic representation of surface area strain (Ea) B Healthy control polar plot with overlaid slice-level polar map and 3D LV colorized endocardium representation of local Ea. C Localized and global peak Ea significantly different between healthy control subjects and DMD patients. D Mild, E moderate, and F severe (as determined by LVEF) DMD patient examples of 17 segment polar and 3D colorized LV representations of peak Ea. Scalebar = 1 cm. *p < 0.05, **p < 0.01, ****p < 0.001, error bars depict median and interquartile range
Fig. 6
Fig. 6
3D + time CMR-derived localized strain and strain rate comparison for discriminating DMD cardiomyopathy (CMP) (n = 43) vs. healthy controls (n = 25) subjects using Wilson/Brown method for receiver operator characteristic curve analysis
Fig. 7
Fig. 7
Regional strain differentiates mild, moderate, and severe DMD CMP from healthy control subjects. A Stratification paradigm for healthy controls (n = 25) and DMD CMP (n = 43) patients between those without myocardial delayed enhancment (MDE) and an LVEF >55% (Group A, n = 15) those with MDE and LVEF > 55% (Group B, n = 15) and those with MDE and LVEF < 55% (Group C, n = 13). B–D) Basal region peak circumferential strain (Ecc; B), radial strain (Err; C), and surface area strain (Ea; D) shows differences between healthy controls and DMD CMP groups A, B, and C. Basal region systolic strain rates for Ecc (E), Err (F), and Ea (G), show significant differences between healthy controls and DMD CM groups A, B, and C. *p < 0.05, **p < 0.01,***p < 0.001 ****p < 0.001, error bars depict median and interquartile range

References

    1. Mcnally EM, Kaltman JR, Benson DW, Canter CE, Cripe LH, Duan D, et al. Contemporary Cardiac Issues in Duchenne Muscular Dystrophy. Circulation. 2015;131(18):1590–1598. doi: 10.1161/CIRCULATIONAHA.114.015151. - DOI - PMC - PubMed
    1. Ryder S, Leadley RM, Armstrong N, Westwood M, De Kock S, Butt T, et al. The burden, epidemiology, costs and treatment for Duchenne muscular dystrophy: an evidence review. Orphanet J Rare Dis. 2017;12(1):78. doi: 10.1186/s13023-017-0631-3. - DOI - PMC - PubMed
    1. Romitti PA, Zhu Y, Puzhankara S, James KA, Nabukera SK, Zamba GKD, et al. Prevalence of Duchenne and Becker Muscular Dystrophies in the United States. Pediatrics. 2015;135(3):513–521. doi: 10.1542/peds.2014-2044. - DOI - PMC - PubMed
    1. Hoffman EP, Brown RH, Kunkel LM. Dystrophin: The protein product of the duchenne muscular dystrophy locus. Cell. 1987;51(6):919–928. doi: 10.1016/0092-8674(87)90579-4. - DOI - PubMed
    1. Muntoni F, Torelli S, Ferlini A. Dystrophin and mutations: one gene, several proteins, multiple phenotypes. Lancet Neurol. 2003;2(12):731–740. doi: 10.1016/S1474-4422(03)00585-4. - DOI - PubMed

Publication types