

Waiting-List and early posttransplant prognosis among ethnoracial groups: Data from the organ procurement and transplantation network
- PMID: 36793312
- PMCID: PMC9923172
- DOI: 10.3389/fsurg.2023.1045363
Waiting-List and early posttransplant prognosis among ethnoracial groups: Data from the organ procurement and transplantation network
Abstract
Background: Racial/ethnic disparity in waiting-list mortality among candidates listed for kidney transplantation (KT) in the United States remains unclear. We aimed to assess racial/ethnic disparity in waiting-list prognosis among patients listed for KT in the United States in the current era.
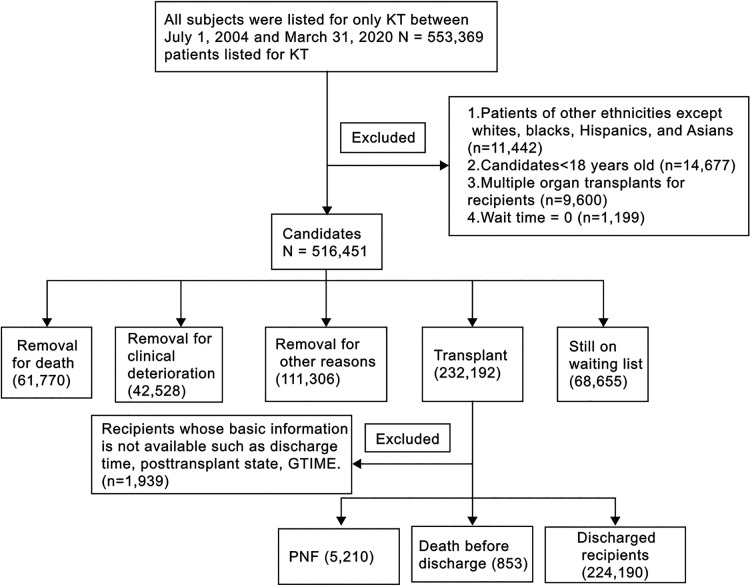
Methods: We compared waiting-list and early posttransplant in-hospital mortality or primary nonfunction (PNF) among adult (age ≥18 years) white, black, Hispanic, and Asian patients listed for only KT in the United States between July 1, 2004 and March 31, 2020.
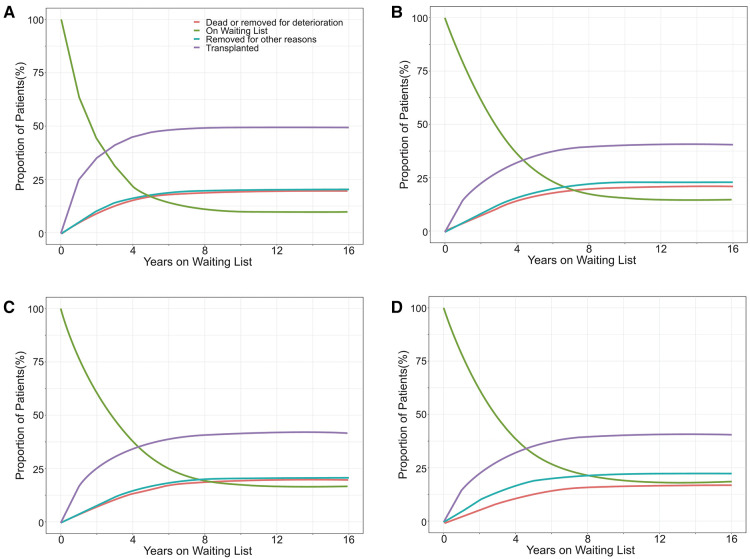
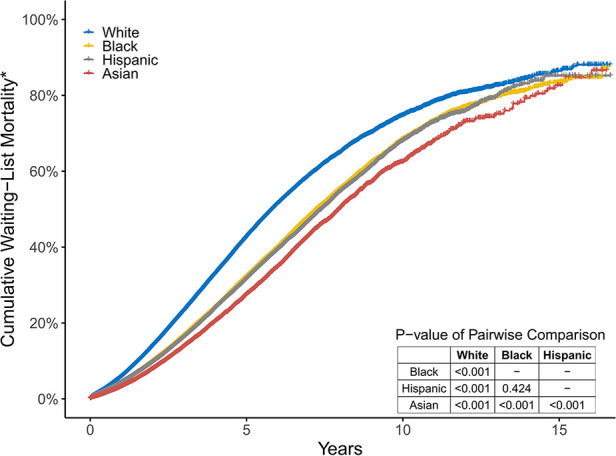
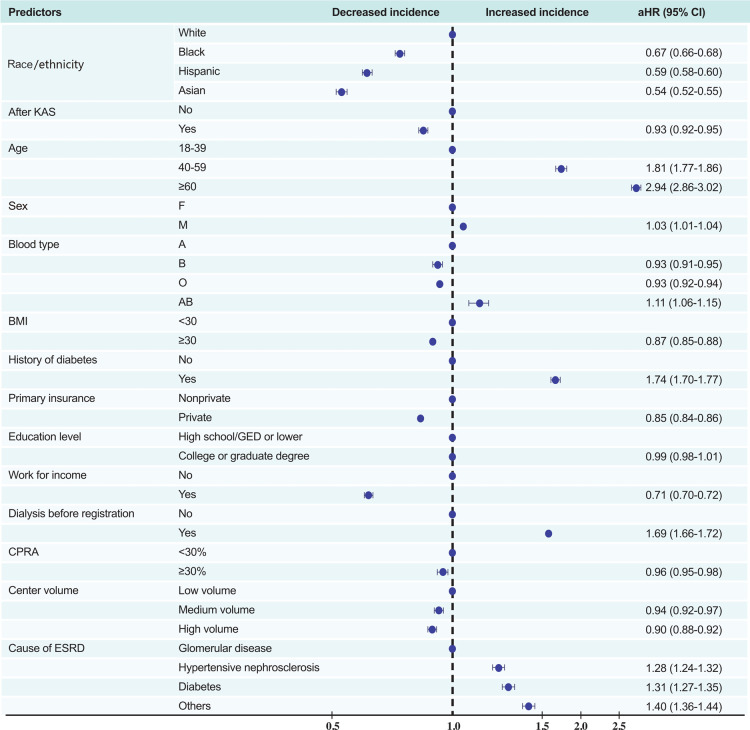
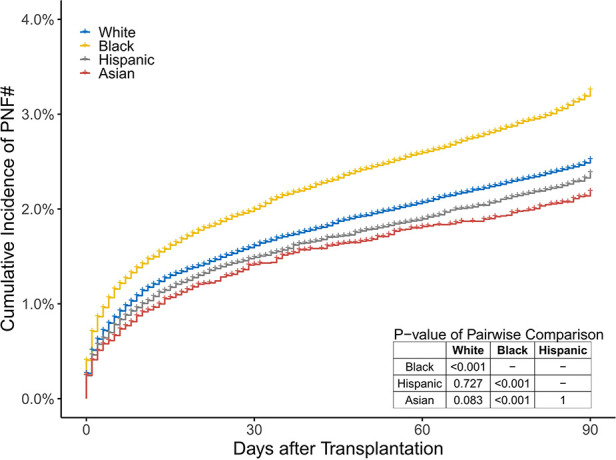
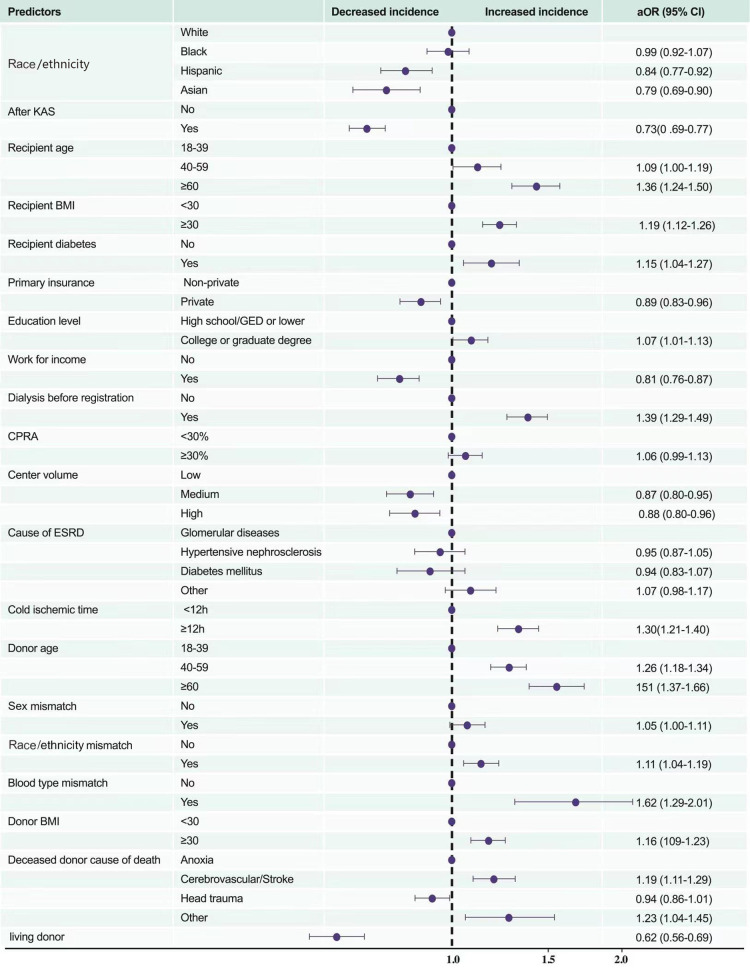
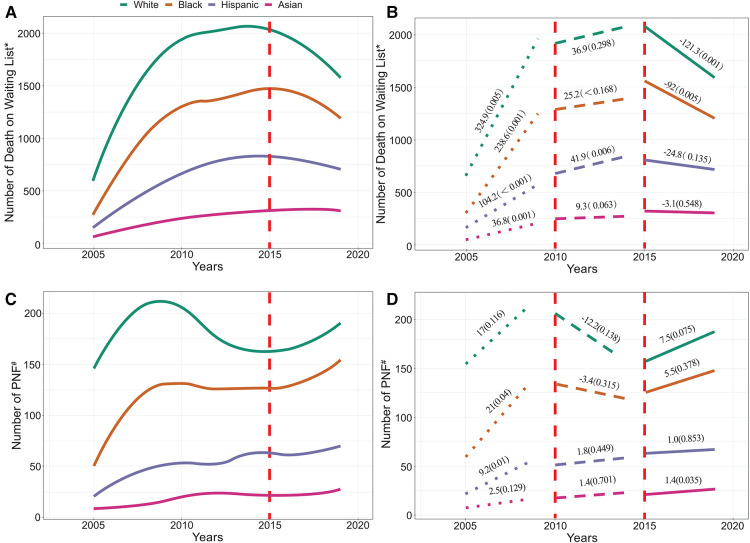
Results: Of the 516,451 participants, 45.6%, 29.8%, 17.5%, and 7.1% were white, black, Hispanic, and Asian, respectively. Mortality on the 3-year waiting list (including patients who were removed for deterioration) was 23.2%, 16.6%, 16.2%, and 13.8% in white, black, Hispanic, and Asian patients, respectively. The cumulative incidence of posttransplant in-hospital death or PNF after KT was 3.3%, 2.5%, 2.4%, and 2.2% in black, white, Hispanic, and Asian patients,respectively. White candidates had the highest mortality risk on the waiting list or of becoming too sick for a transplant, while black (adjusted hazard ratio, [95% confidence interval, CI], 0.67 [0.66-0.68]), Hispanic (0.59 [0.58-0.60]), and Asian (0.54 [0.52-0.55]) candidates had a lower risk. Black KT recipients (odds ratio, [95% CI] 1.29 [1.21-1.38]) had a higher risk of PNF or death before discharge than white patients. After controlling confounders, black recipients (0.99 [0.92-1.07]) had a similar higher risk of posttransplant in-hospital mortality or PNF as white patients than Hispanic and Asian counterparts.
Conclusions: Despite having a better socioeconomic status and being allocated better kidneys, white patients had the worst prognosis during the waiting periods. Black recipients and white recipients have higher posttransplant in-hospital mortality or PNF.
Keywords: early posttransplant in-hospital mortality; kidney allocation system; kidney transplantation; primary nonfunction; racial/ethnic disparities; waiting-list mortality.
© 2023 Wu, Lv, Hao, Lv, Lai, Xia, Pang, Yuan and Song.
Conflict of interest statement
The authors declare that the research was conducted in the absence of any commercial or financial relationships that could be construed as a potential conflict of interest.
Figures
Similar articles
-
Association of Race and Ethnicity With High Longevity Deceased Donor Kidney Transplantation Under the US Kidney Allocation System.Am J Kidney Dis. 2024 Oct;84(4):416-426. doi: 10.1053/j.ajkd.2024.02.017. Epub 2024 Apr 16. Am J Kidney Dis. 2024. PMID: 38636649
-
Racial and ethnic differences in wait-list outcomes in patients listed for heart transplantation in the United States.Circulation. 2012 Jun 19;125(24):3022-30. doi: 10.1161/CIRCULATIONAHA.112.092643. Epub 2012 May 15. Circulation. 2012. PMID: 22589383
-
Association of Race and Ethnicity With Live Donor Kidney Transplantation in the United States From 1995 to 2014.JAMA. 2018 Jan 2;319(1):49-61. doi: 10.1001/jama.2017.19152. JAMA. 2018. PMID: 29297077 Free PMC article.
-
Advance Care Planning and Palliative Care Consultation in Kidney Transplantation.Am J Kidney Dis. 2024 Mar;83(3):318-328. doi: 10.1053/j.ajkd.2023.07.018. Epub 2023 Sep 20. Am J Kidney Dis. 2024. PMID: 37734687 Free PMC article.
-
Mortality in Elderly Waiting-List Patients Versus Age-Matched Kidney Transplant Recipients: Where is the Risk?Kidney Blood Press Res. 2018;43(1):256-275. doi: 10.1159/000487684. Epub 2018 Feb 22. Kidney Blood Press Res. 2018. PMID: 29490298 Review.
References
-
- Abecassis M, Bartlett ST, Collins AJ, Davis CL, Delmonico FL, Friedewald JJ, et al. Kidney transplantation as primary therapy for end-stage renal disease: a national kidney foundation/kidney disease outcomes quality initiative (NKF/KDOQITM) conference. Clin J Am Soc Nephrol. (2008) 3:471–80. 10.2215/CJN.05021107 - DOI - PMC - PubMed
LinkOut - more resources
Full Text Sources