. 2023 Jan 27:14:1095812.
doi: 10.3389/fimmu.2023.1095812. eCollection 2023.

Physiological hypoxia improves growth and functional differentiation of human intestinal epithelial organoids

Affiliations

Physiological hypoxia improves growth and functional differentiation of human intestinal epithelial organoids

Gunnar Andreas Walaas et al. Front Immunol. .

Abstract

Background: The epithelium in the colonic mucosa is implicated in the pathophysiology of various diseases, including inflammatory bowel diseases and colorectal cancer. Intestinal epithelial organoids from the colon (colonoids) can be used for disease modeling and personalized drug screening. Colonoids are usually cultured at 18-21% oxygen without accounting for the physiological hypoxia in the colonic epithelium (3% to <1% oxygen). We hypothesize that recapitulating the in vivo physiological oxygen environment (i.e., physioxia) will enhance the translational value of colonoids as pre-clinical models. Here we evaluate whether human colonoids can be established and cultured in physioxia and compare growth, differentiation, and immunological responses at 2% and 20% oxygen.

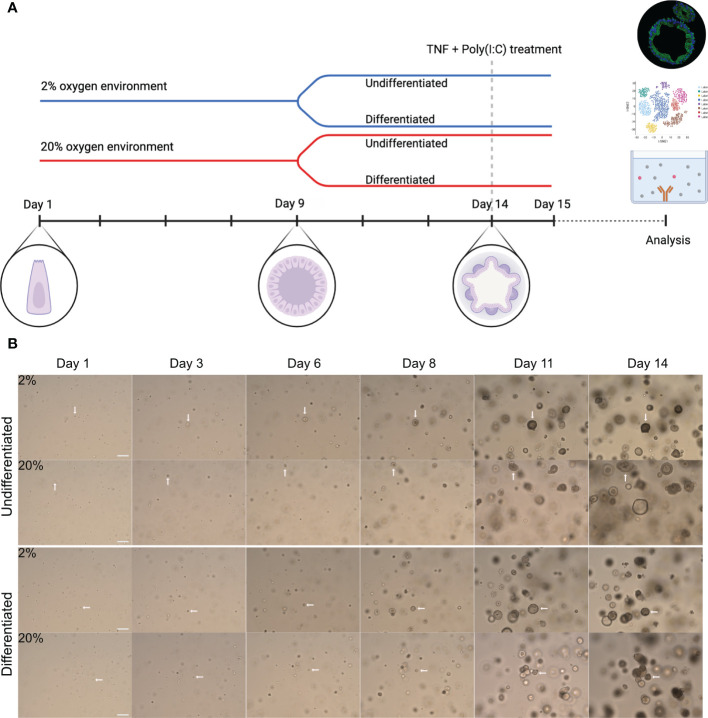
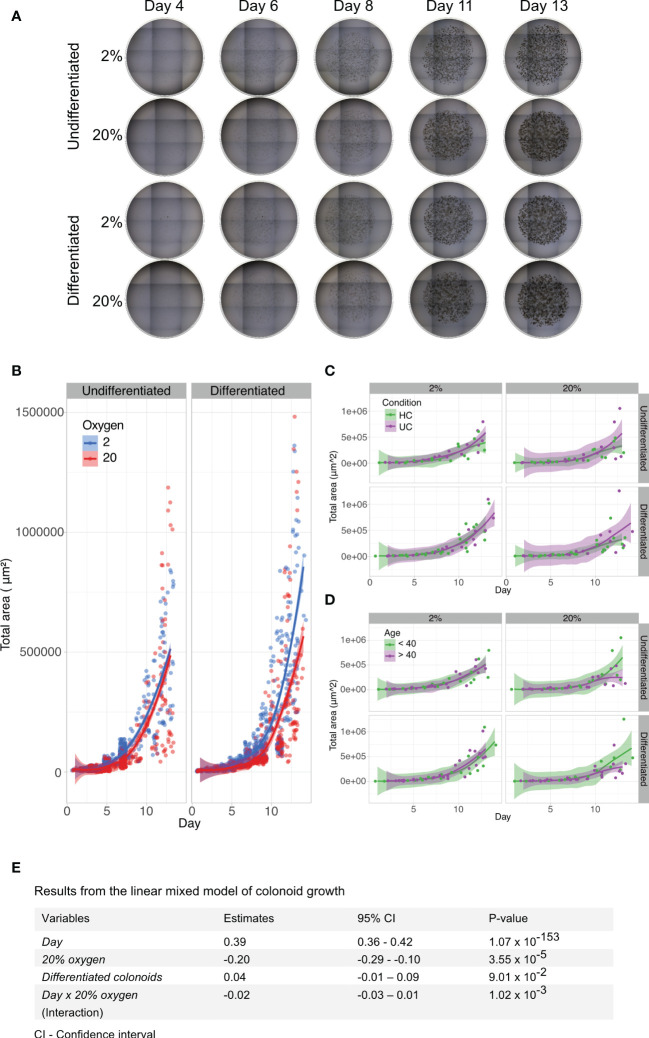
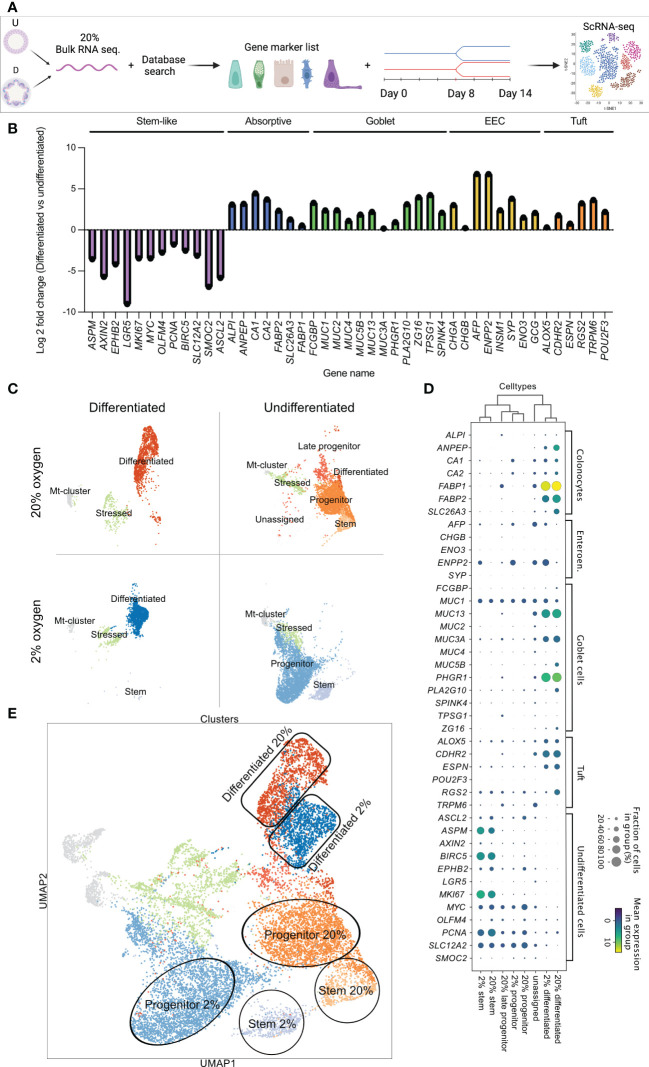
Methods: Growth from single cells to differentiated colonoids was monitored by brightfield images and evaluated with a linear mixed model. Cell composition was identified by immunofluorescence staining of cell markers and single-cell RNA-sequencing (scRNA-seq). Enrichment analysis was used to identify transcriptomic differences within cell populations. Pro-inflammatory stimuli induced chemokines and Neutrophil gelatinase-associated lipocalin (NGAL) release were analyzed by Multiplex profiling and ELISA. Direct response to a lower oxygen level was analyzed by enrichment analysis of bulk RNA sequencing data.

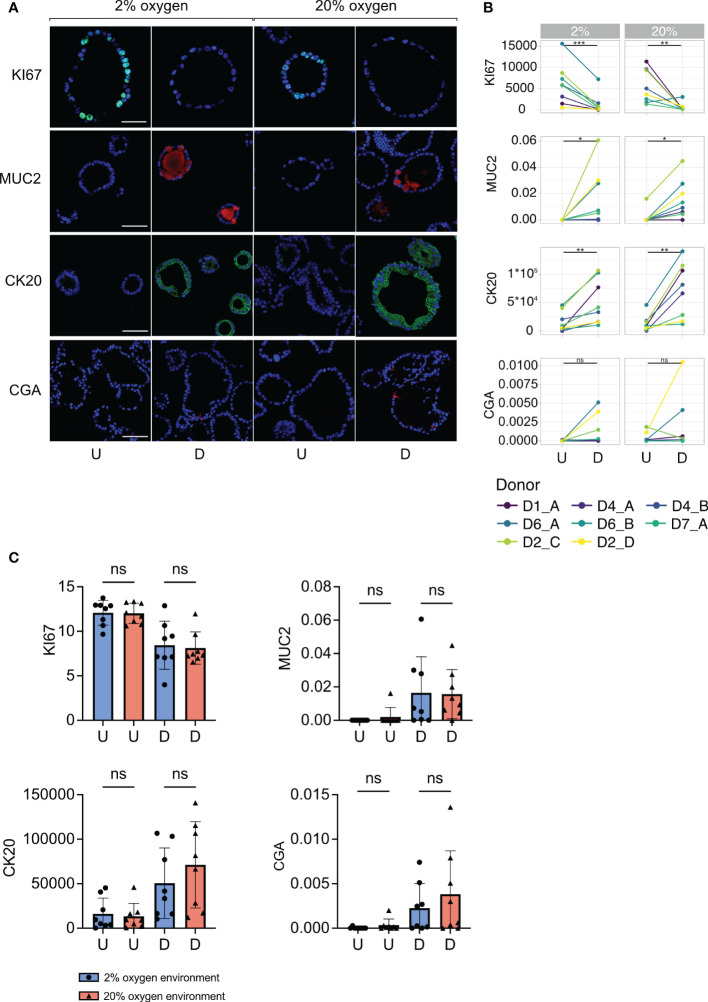
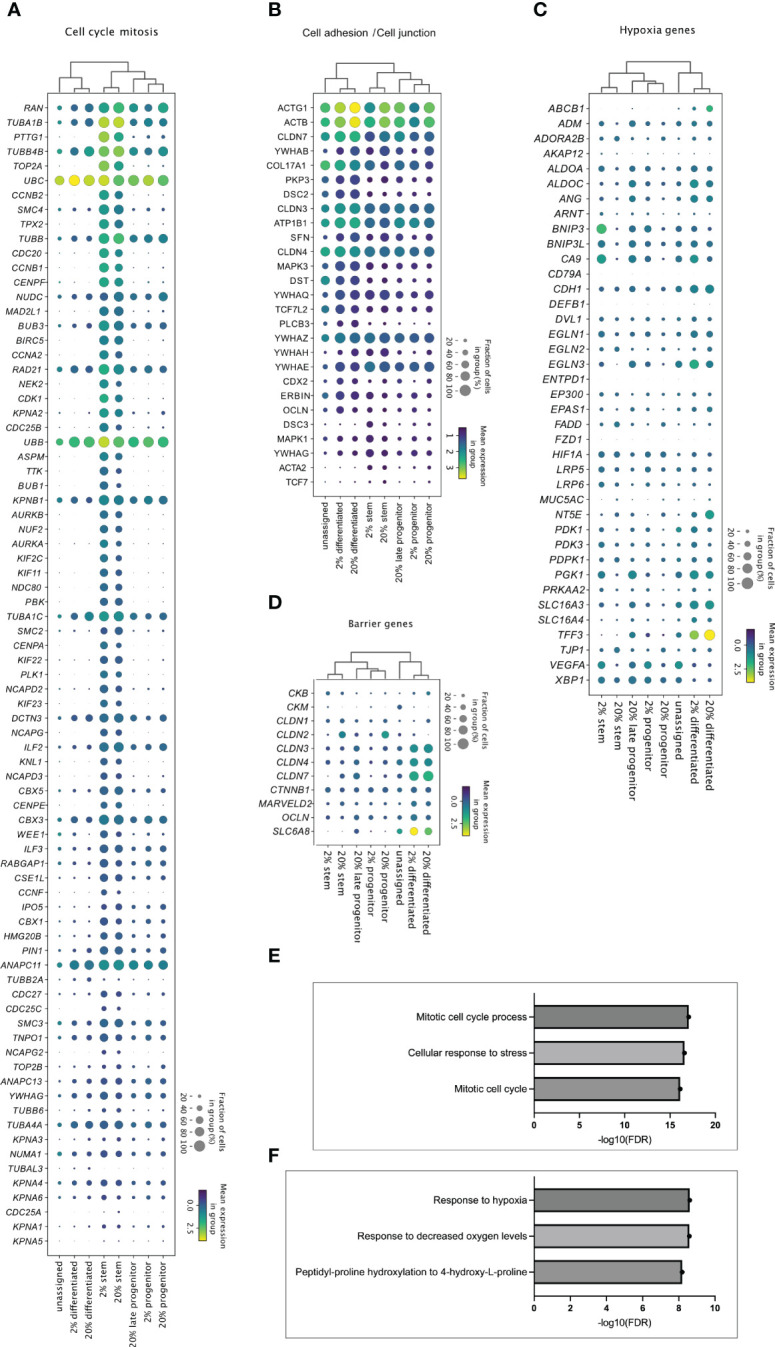
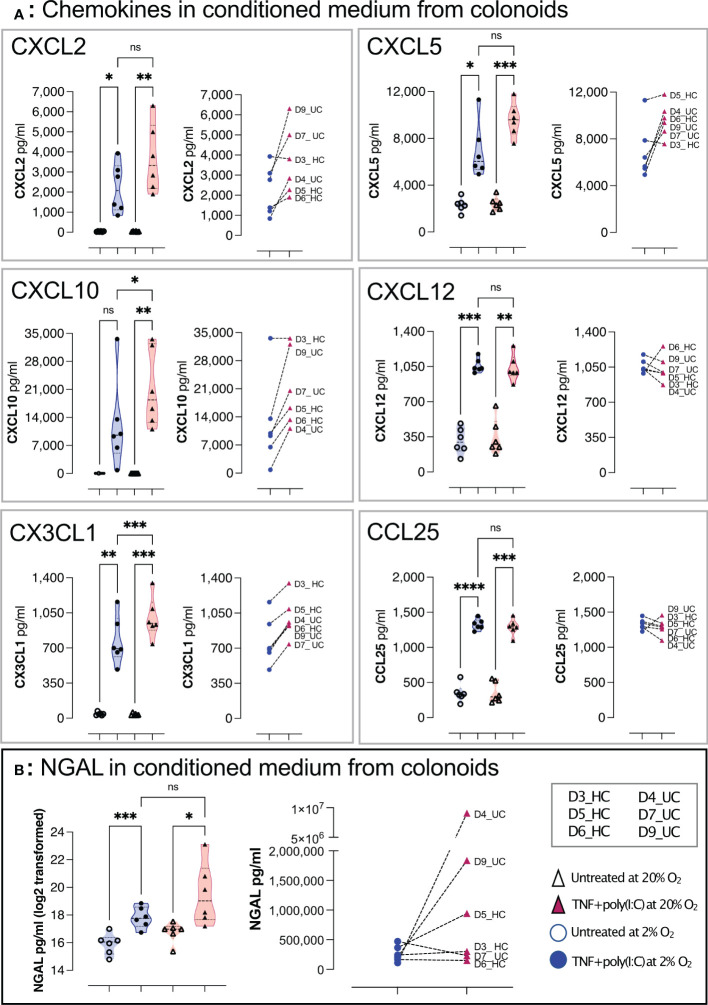
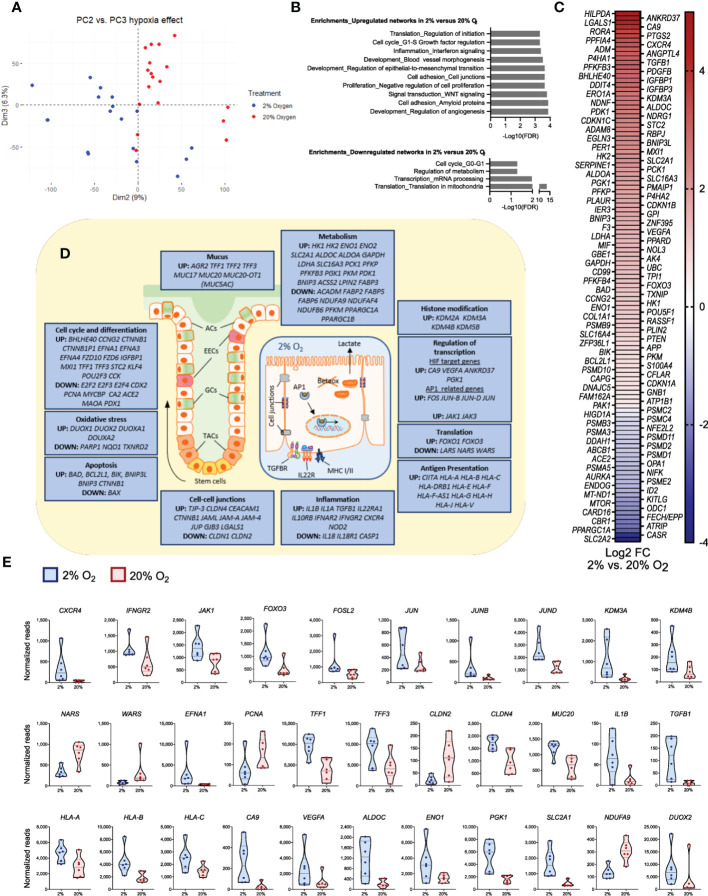
Results: Colonoids established in a 2% oxygen environment acquired a significantly larger cell mass compared to a 20% oxygen environment. No differences in expression of cell markers for cells with proliferation potential (KI67 positive), goblet cells (MUC2 positive), absorptive cells (MUC2 negative, CK20 positive) and enteroendocrine cells (CGA positive) were found between colonoids cultured in 2% and 20% oxygen. However, the scRNA-seq analysis identified differences in the transcriptome within stem-, progenitor- and differentiated cell clusters. Both colonoids grown at 2% and 20% oxygen secreted CXCL2, CXCL5, CXCL10, CXCL12, CX3CL1 and CCL25, and NGAL upon TNF + poly(I:C) treatment, but there appeared to be a tendency towards lower pro-inflammatory response in 2% oxygen. Reducing the oxygen environment from 20% to 2% in differentiated colonoids altered the expression of genes related to differentiation, metabolism, mucus lining, and immune networks.

Conclusions: Our results suggest that colonoids studies can and should be performed in physioxia when the resemblance to in vivo conditions is important.

Keywords: chemokines (cytokines); differentiation; inflammatory bowel disease; intestinal epithelial cells (IECs); oxygen; proliferation; single-cell RNA-sequencing (scRNAseq); transcriptome.


Conflict of interest statement

The authors declare that the research was conducted in the absence of any commercial or financial relationships that could be construed as a potential conflict of interest.

Figures

Figure 1
Figure 1
Experimental overview and growth of colonoids cultured in high and low oxygen. (A) General graphic representation of the experimental design. Colonoids were dissociated into single cells before plated at a density of 8000-10000 cells/50 ml matrigel and cultured in parallel in two incubators with 2% or 20% oxygen. Complete growth medium (CGM) was added every other day from establishment until 9 days, including ROCK inhibitor Y-27632 for the first two changes. On day nine (unless specified otherwise), cell differentiation was induced in half of the wells by replacing CGM with differentiation medium, while the other half continued with CGM. The colonoids were kept in culture until day 14 unless they were treated with pro-inflammatory TNF + poly(I:C). The blue line represents colonoids cultured in a 2% oxygen environment, while the red line represents cultivation in a 20% oxygen environment. As illustrated, stem cells began as single cells, proliferated into spheroids, and ultimately differentiated into 3D structured colonoids with crypts and a central lumen. For the stimulation assays, the colonoids were cultured as described until day 14. Subsequently, they were treated with TNF + poly(I:C) for 24 hours before the material (RNA and conditioned medium) was collected. (B) Representative brightfield images (10x magnification, EVOS microscope) of colonoid growth. The four image rows represent the four different conditions (undifferentiated or differentiated in 2% and 20%) cultured in parallel. The day the image was captured is indicated above the images. The white arrows follow a cell from a single cell to a 3D colonoid. Scale bar = 100 μm.
Figure 2
Figure 2
Brightfield image analyses and linear mixed model of colonoid growth. (A) Two dimensional (2D) brightfield images (4x magnification, EVOS microscope) of Matrigel domes containing undifferentiated or differentiated colonoids cultured in parallel at 2% and 20% oxygen. Nine tiled images captured every dome within one technical replicate (i.e., plate well) throughout the experiment. The day of image acquisition is indicated above the images; the oxygen environment and the differentiation status are shown on the left. (B) Computational growth analysis of colonoid cultures (n=11 independent experiments, with 6-12 technical replicates (i.e., plate wells) per condition. Table 1 and Supplementary Figure 2B ). Days are marked on the x-axis, while the y-axis shows the total colonoid mass in 2D. Timepoints with blue circles represent 2% oxygen cultivation, and red circles represent 20% oxygen cultivation in undifferentiated (left panel) and differentiated (right panel) colonoids. The blue (2% oxygen) and red (20% oxygen) lines were fitted with the Loess curve fitting model. (C) Colonoid growth curve of ulcerative colitis (n=2) and healthy control donors (n=5), with data from independent experiments with the same donor merged). The x-axis represents time, while the y-axis shows the total colonoid mass in 2D. Timepoints with purple circles represent ulcerative colitis donors, and green circles represent healthy control donors. Undifferentiated colonoids (left panel) and differentiated (right panel). The purple (ulcerative colitis) and green (healthy controls) lines were fitted with the Loess curve fitting model. (D) Colonoid growth patterns of donors < 40 years (n=3) and > 40 years (n=4)). The x-axis represents time, while the y-axis shows the total colonoid mass in 2D. Timepoints with purple circles represent old donors, and green circles represent young donors. Undifferentiated colonoids (left panel) and differentiated (right panel). The purple (> 40) and green (< 40) lines were fitted with the Loess curve fitting model. (E) A linear mixed model based on data from 1875 images was used to quantify which variables impacted colonoid growth. In the table, fixed variables are listed in the first column. The middle columns are absolute values of how much the variables affected growth, with an estimate of the impact in the left-middle column and 95% confidence intervals in the column to the right. P-values are listed in the last column.
Figure 3
Figure 3
Cell marker protein expression in undifferentiated and differentiated colonoids at low and high oxygen. (A) Immunofluorescent images of cell marker expression. Images in the two first columns show colonoids cultured in 2% oxygen, while the images in the last two columns show colonoids cultured in 20% oxygen. Within each oxygen concentration, U indicates the undifferentiated condition, while D indicates the differentiated condition. Each row represents a cell marker protein. DAPI was used as a counterstaining in all images. Scalebar = 50 μm. (B) Paired quantification of cell marker expression in undifferentiated (U) and differentiated (D) colonoids (n=8 independent experiments, Table 1 ). Statistical testing was carried out with the Wilcoxon test. The x-axis shows the differentiation condition of the colonoids while the y-axis shows calculated expression: CK20 and KI67 expressions were quantified with corrected total cell fluorescence (CTCF) adjusted for the number of cells present. The y-axis for MUC2 and CGA indicates the fraction of positive cells, manually counted, among all present cells. (C) Cell marker protein expression in colonoids cultured at 2% vs. 20% oxygen. The bars show the mean and standard deviation with each independent experiment plotted as individual values. Blue bars and dots illustrate colonoids cultured in 2% oxygen and red bars and triangles cultured in 20% oxygen. The x-axis shows the conditions undifferentiated (U) or differentiated (D), while the y-axis shows cell marker expression. P-values are determined by one-way ANOVA followed by Šidák’s multiple comparisons test. ns = non-significant.
Figure 4
Figure 4
Identification of cell marker genes in undifferentiated and differentiated colonoids by bulk RNAseq (B) and single-cell RNAseq. (C-E). (A) Schematic diagram of the experimental workflow. (B) Cell marker gene expression in differentiated vs. undifferentiated colonoids cultured in 20% oxygen. PangloaDB database (43) was used to identify cell marker genes, as described in the Method section. The x-axis shows gene names, and the y-axis shows the log2 foldchange for indicated genes in differentiated compared to undifferentiated colonoids (average of n=3). Cell marker genes are grouped and colored by cell type; purple for stem cells, blue for absorptive cells, green for goblet cells, yellow for enteroendocrine, and orange for tuft cells. (C) Visualization plot of scRNA-seq data from 13904 single cells. Four culture conditions (differentiated and undifferentiated in 2% and 20% oxygen) were analyzed in separate batches represented by their own UMAP-plot. The gene list confirmed in Bulk RNAseq (B) and SF1 , sheet 10 was used to identify and annotate each cluster. (D) Dot plot showing expression of cell marker genes in the different cell clusters. Cell clusters are listed along the x-axis, while cell marker genes are listed along the y-axis. The color intensity represents mean expression within a cluster, and the radius of the dot represents the fraction of cells in the cluster expressing a gene. (E) Combined UMAP-plot for all four conditions. Clusters with equal annotations are illustrated by the circles (Stem cells), rectangles (Differentiated cells), and oval shapes (Progenitor cells) and color-coded as in 4C.
Figure 5
Figure 5
Cell cluster specific transcriptome in 2% and 20% oxygen. Enrichment analysis of upregulated genes in the stem, progenitor, and differentiated cell clusters from 2% vs. 20% oxygen culture (adjusted P <0.05). were generated with MetaCore+MetaDrug™ version 21.3 build 70600 ( SF1 , sheets 12-15). The dot plots display how (A) genes related to cell cycle and mitosis (A), genes associated with cell adhesions and cell junctions (B), hypoxia-related genes (C) and barrier genes (D) were expressed in the different cell type clusters. Cell clusters are listed along the x-axis, while genes are listed along the y-axis. The color intensity represents mean expression within a cluster, and the radius of the dot represents the fraction of cells in the cluster expressing a gene. (E, F) Bars indicate –Log10 false discovery rate (FDR), while the y-axis lists top three GO processes upregulated in stem-like cell clusters (E) and differentiated cell cluster (F) in 2% compared to 20% oxygen culture ( Supplementary file SF1 , sheets 14 and 15, respectively).
Figure 6
Figure 6
TNF+ Poly(I:C) induced chemokines and NGAL release from colonoids grown at high and low oxygen concentrations. Chemokines (A) and NGAL (B) in conditioned medium from differentiated untreated colonoids and after 24 hours of treatment with TNF + Poly(I:C). The treatment groups are represented on the x-axis, while the concentration of the target molecule is represented on the y-axis. In (A), CXCL2, CXCL5, CXCL10, CXCL12, CX3CL1, and CCL25 concentrations (pg/mL) in conditioned medium were detected by Bio-plex Pro-Human Chemokine Panel analysis. In (B) NGAL was detected by ELISA. In each panel, the violin plots show the differences between untreated and TNF+Poly(I:C) treated colonoids cultivated at 2% oxygen (blue) and 20% oxygen (red). Each independent experimental replicate is plotted as individual values, and the graph to the right in each panel shows paired data for each donor treated with TNF+Poly(I:C) at 2% (blue circles) and 20% (red triangles). Statistical analyses were performed using RM one-way ANOVA followed by Šídák’s multiple comparisons test. In left panel (B), NGAL was plotted and analyzed on log2 transformed data. Right panel (B) shows paired NGAL concentrations as pg/ml for each donor. See Table 1 for colonoid donor characteristics * < 0.05, ** < 0.005, *** < 0.001, and **** < 0.0001. ns = non-significant.
Figure 7
Figure 7
Significant changes in epithelial gene expression after a short time reduction of oxygen. The panels show data from bulk RNA-seq analysis of differentiated colonoids grown continuously at 20% or at 2% for the last 40 hours. (A) PCA plot of PC2 vs. PC3 for the complete dataset from GSE172404 (38) captures the influence of oxygen levels. Dots represent individual samples. (B) Enrichment analysis of basal gene expression in colonoids grown at 2% compared to 20% oxygen. Networks (top ten) best associated with upregulated genes (n=1192) and networks (top four) best associated with downregulated genes (n=1192), analyzed using MetaCore™ version 6.34 build 69200. The strength of association is given as -Log10 false discovery rate (FDR). (C) Differential expression of curated hypoxia-related genes (n=119) in 2% oxygen compared to 20% oxygen (adjusted P-values < 0.05). The heatmaps are sorted from highest (red) to lowest (blue) log2 fold change (FC) values, with 89 upregulated and 30 downregulated genes in 2% compared to 20% O2. (D) Illustrations of a colonic crypt with mucus lining and a colonic epithelial cell. The blue boxes contain a selection of differentially regulated genes between colonoids at 2% or 20% oxygen (adjusted P-values < 0.05), grouped by intestinal epithelial cell functions. Upregulated or downregulated genes at 2% compared to 20% oxygen are mentioned in boxes according to the topic. ACs, absorptive cells; EECs, enteroendocrine cells; GCs, goblet cells; TACs, Transit-amplifying cells; TGFBR, transforming growth factor beta receptor; IL22R, Interleukin 22 receptor complex; Betaox, beta-oxidation of fatty acids; MHC, major histocompatibility complex; AP1, network of transcription factors involved in inflammation. (E) Expression of a subset of genes within the different groups of intestinal epithelial cell functions described in (D), given as normalized reads. The first 12 panels show genes related to signal transduction, transcription, and translation; the latter show effector genes important for intestinal epithelial cell homeostasis. See main text for details. All displayed genes in the figure panels were differentially regulated with an adjusted P-value <0.05.

Similar articles

Cited by

References

    1. Litvak Y, Byndloss MX, Bäumler AJ. Colonocyte metabolism shapes the gut microbiota. Science (2018) 362(6418):eaat9076. doi: 10.1126/science.aat9076 - DOI - PMC - PubMed
    1. Allaire JM, Crowley SM, Law HT, Chang S-Y, Ko H-J, Vallance BA. The intestinal epithelium: Central coordinator of mucosal immunity. Trends Immunol (2018) 39(9):677–96. doi: 10.1016/j.it.2018.04.002 - DOI - PubMed
    1. Crosnier C, Stamataki D, Lewis J. Organizing cell renewal in the intestine: stem cells, signals and combinatorial control. Nat Rev Genet (2006) 7(5):349–59. doi: 10.1038/nrg1840 - DOI - PubMed
    1. Gehart H, Clevers H. Tales from the crypt: new insights into intestinal stem cells. Nat Rev Gastroenterol Hepatology (2019) 16(1):19–34. doi: 10.1038/s41575-018-0081-y - DOI - PubMed
    1. Peterson LW, Artis D. Intestinal epithelial cells: regulators of barrier function and immune homeostasis. Nat Rev Immunol (2014) 14(3):nri3608. doi: 10.1038/nri3608 - DOI - PubMed

Publication types