

Colonization with two different Blastocystis subtypes in DSS-induced colitis mice is associated with strikingly different microbiome and pathological features
- PMID: 36793854
- PMCID: PMC9925320
- DOI: 10.7150/thno.81583
Colonization with two different Blastocystis subtypes in DSS-induced colitis mice is associated with strikingly different microbiome and pathological features
Abstract
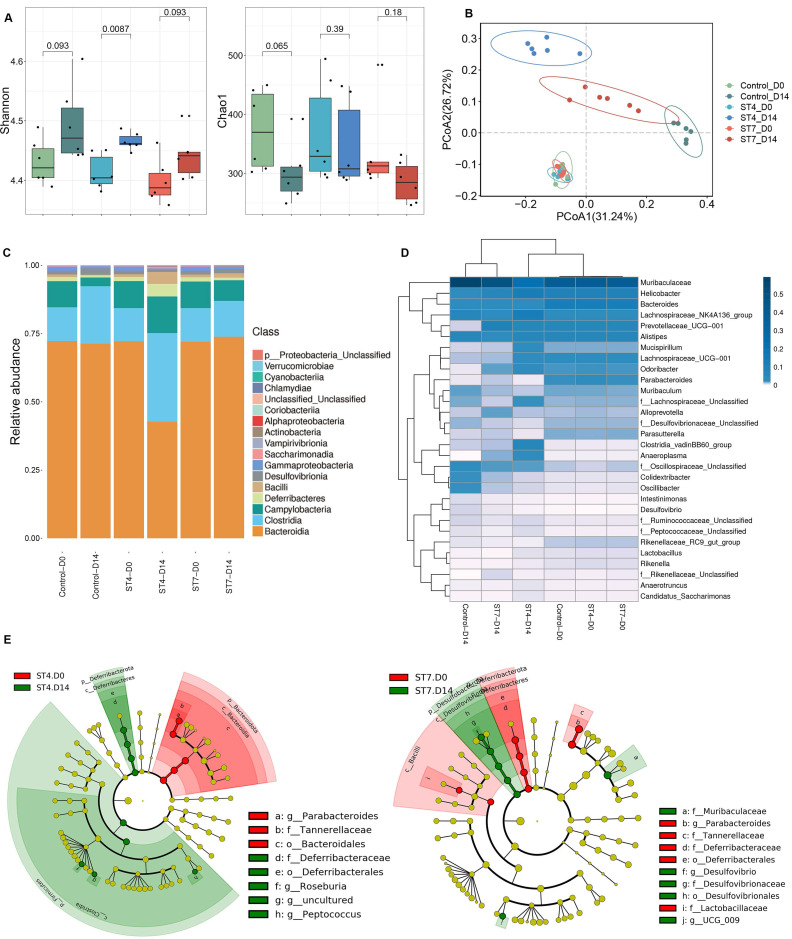
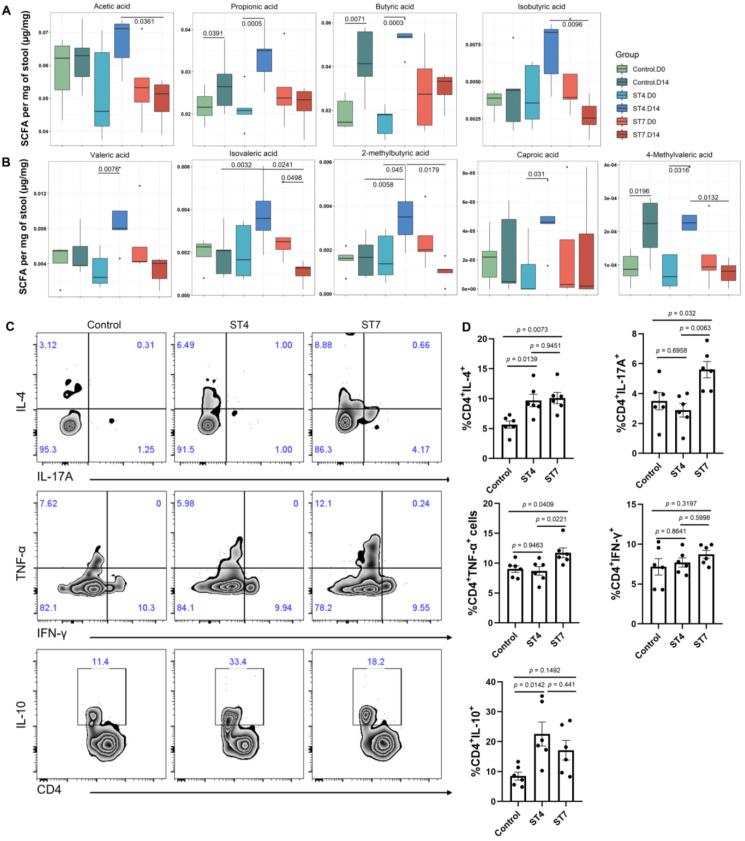
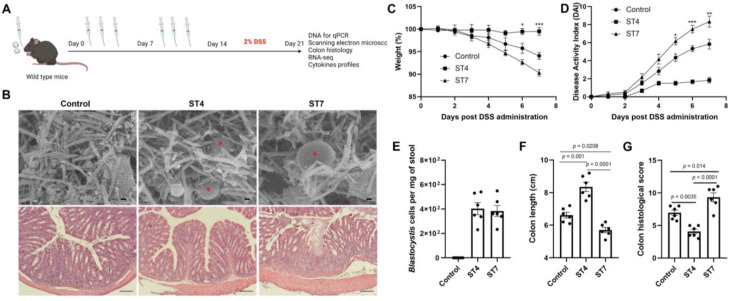
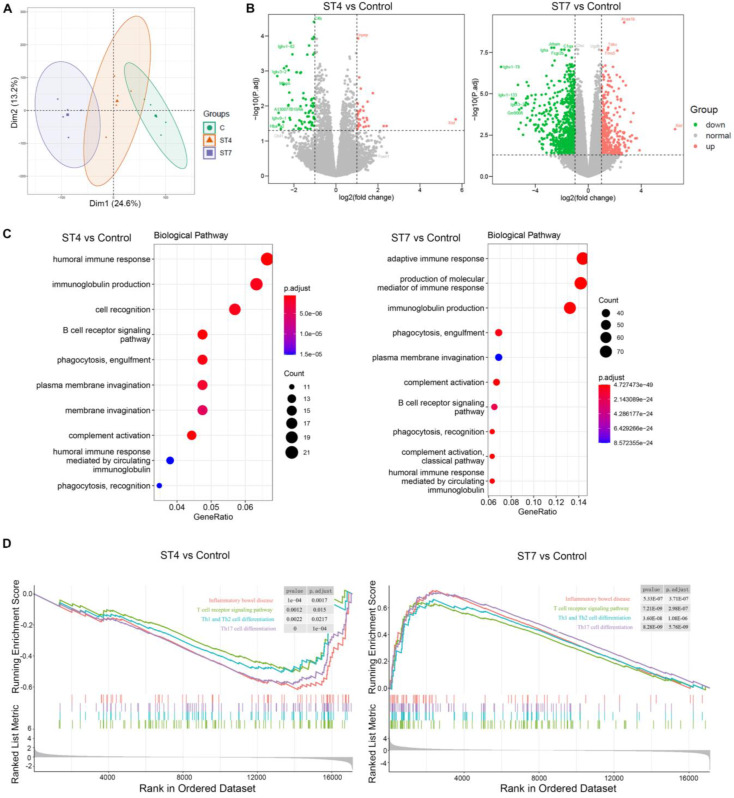
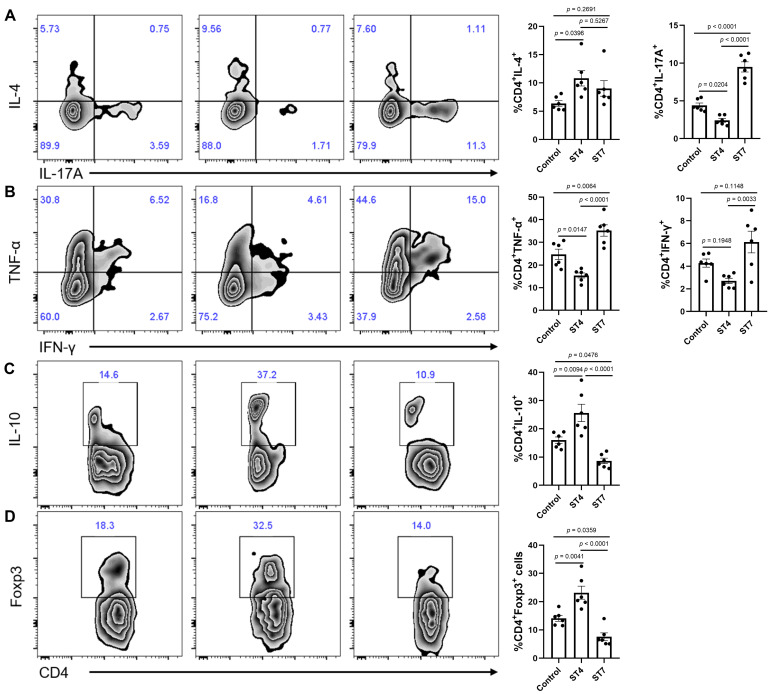
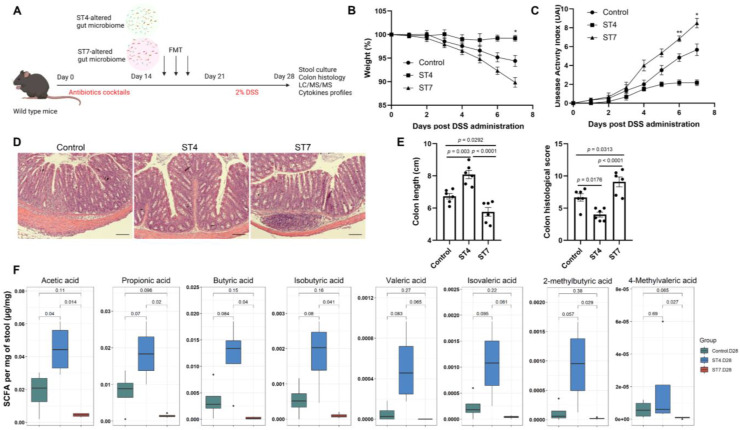
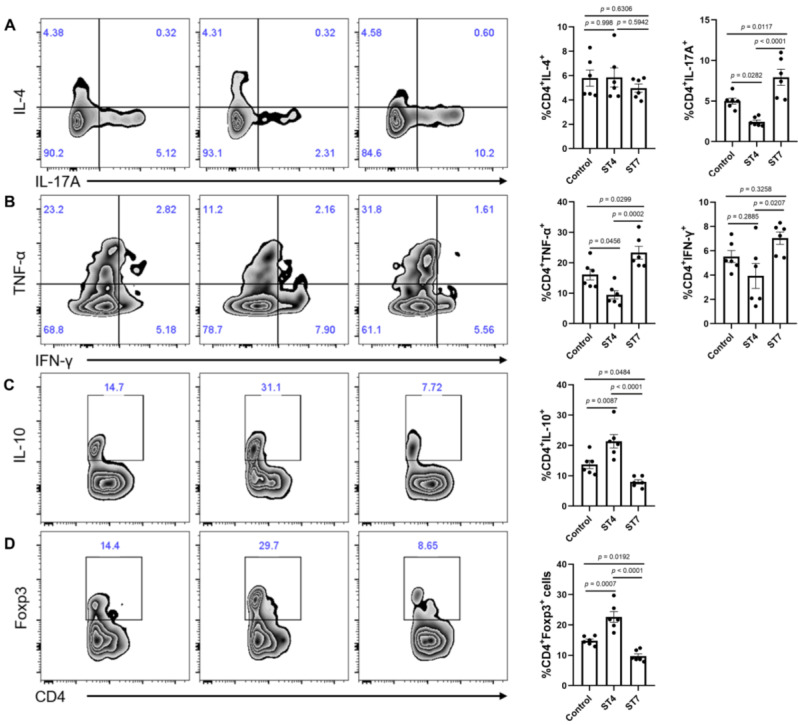
Rationale: The gut microbiota plays a significant role in the pathogenesis of inflammatory bowel disease (IBD). However, the role of Blastocystis infection and Blastocystis-altered gut microbiota in the development of inflammatory diseases and their underlying mechanisms are not well understood. Methods: We investigated the effect of Blastocystis ST4 and ST7 infection on the intestinal microbiota, metabolism, and host immune responses, and then explored the role of Blastocystis-altered gut microbiome in the development of dextran sulfate sodium (DSS)-induced colitis in mice. Results: This study showed that prior colonization with ST4 conferred protection from DSS-induced colitis through elevating the abundance of beneficial bacteria, short-chain fatty acid (SCFA) production and the proportion of Foxp3+ and IL-10-producing CD4+ T cells. Conversely, prior ST7 infection exacerbated the severity of colitis by increasing the proportion of pathogenic bacteria and inducing pro-inflammatory IL-17A and TNF-α-producing CD4+ T cells. Furthermore, transplantation of ST4- and ST7-altered microbiota resulted in similar phenotypes. Conclusions: Our data showed that ST4 and ST7 infection exert strikingly differential effects on the gut microbiota, and these could influence the susceptibility to colitis. ST4 colonization prevented DSS-induced colitis in mice and may be considered as a novel therapeutic strategy against immunological diseases in the future, while ST7 infection is a potential risk factor for the development of experimentally induced colitis that warrants attention.
Keywords: Blastocystis; DSS-induced colitis; Gut microbiota; IBD; Short-chain fatty acids.
© The author(s).
Conflict of interest statement
Competing Interests: The authors have declared that no competing interest exists.
Figures
Similar articles
-
Experimental colonization with Blastocystis ST4 is associated with protective immune responses and modulation of gut microbiome in a DSS-induced colitis mouse model.Cell Mol Life Sci. 2022 Apr 18;79(5):245. doi: 10.1007/s00018-022-04271-9. Cell Mol Life Sci. 2022. PMID: 35435504 Free PMC article.
-
Colonization with ubiquitous protist Blastocystis ST1 ameliorates DSS-induced colitis and promotes beneficial microbiota and immune outcomes.NPJ Biofilms Microbiomes. 2023 Apr 25;9(1):22. doi: 10.1038/s41522-023-00389-1. NPJ Biofilms Microbiomes. 2023. PMID: 37185924 Free PMC article.
-
Pediococcus pentosaceus CECT 8330 protects DSS-induced colitis and regulates the intestinal microbiota and immune responses in mice.J Transl Med. 2022 Jan 15;20(1):33. doi: 10.1186/s12967-022-03235-8. J Transl Med. 2022. PMID: 35033121 Free PMC article.
-
Unveiling Colitis: A Journey through the Dextran Sodium Sulfate-induced Model.Inflamm Bowel Dis. 2024 May 2;30(5):844-853. doi: 10.1093/ibd/izad312. Inflamm Bowel Dis. 2024. PMID: 38280217 Free PMC article. Review.
-
New insights into the interactions between Blastocystis, the gut microbiota, and host immunity.PLoS Pathog. 2021 Feb 25;17(2):e1009253. doi: 10.1371/journal.ppat.1009253. eCollection 2021 Feb. PLoS Pathog. 2021. PMID: 33630979 Free PMC article. Review.
Cited by
-
An Update on Blastocystis: Possible Mechanisms of Blastocystis-Mediated Colorectal Cancer.Microorganisms. 2024 Sep 22;12(9):1924. doi: 10.3390/microorganisms12091924. Microorganisms. 2024. PMID: 39338600 Free PMC article. Review.
-
First molecular subtyping and zoonotic significance of Blastocystis sp. in Dromedary (C. dromedarius) and Bactrian (C. bactrianus) camels in Iran: A molecular epidemiology and review of available literature.Vet Med Sci. 2024 May;10(3):e1442. doi: 10.1002/vms3.1442. Vet Med Sci. 2024. PMID: 38578271 Free PMC article.
-
Electroacupuncture Promotes the Generation of Intestinal Treg Cells After Ischemic Stroke by Foxp3 Acetylation Regulation.Mol Neurobiol. 2025 Mar;62(3):3697-3711. doi: 10.1007/s12035-024-04500-1. Epub 2024 Sep 25. Mol Neurobiol. 2025. PMID: 39322831
-
Near-infrared imaging for visualizing the synergistic relationship between autophagy and NFS1 protein during multidrug resistance using an ICT-TICT integrated platform.Chem Sci. 2024 Mar 25;15(16):6028-6035. doi: 10.1039/d3sc06459j. eCollection 2024 Apr 24. Chem Sci. 2024. PMID: 38665516 Free PMC article.
-
Blastocystis: A Mysterious Member of the Gut Microbiome.Microorganisms. 2024 Feb 24;12(3):461. doi: 10.3390/microorganisms12030461. Microorganisms. 2024. PMID: 38543512 Free PMC article. Review.
References
Publication types
MeSH terms
Substances
LinkOut - more resources
Full Text Sources
Research Materials
