. 2023 Jan 22;13(3):1042-1058.
doi: 10.7150/thno.78649. eCollection 2023.

Low-dose X-ray radiodynamic therapy solely based on gold nanoclusters for efficient treatment of deep hypoxic solid tumors combined with enhanced antitumor immune response

Affiliations

Low-dose X-ray radiodynamic therapy solely based on gold nanoclusters for efficient treatment of deep hypoxic solid tumors combined with enhanced antitumor immune response

Shengcang Zhu et al. Theranostics. .

Abstract

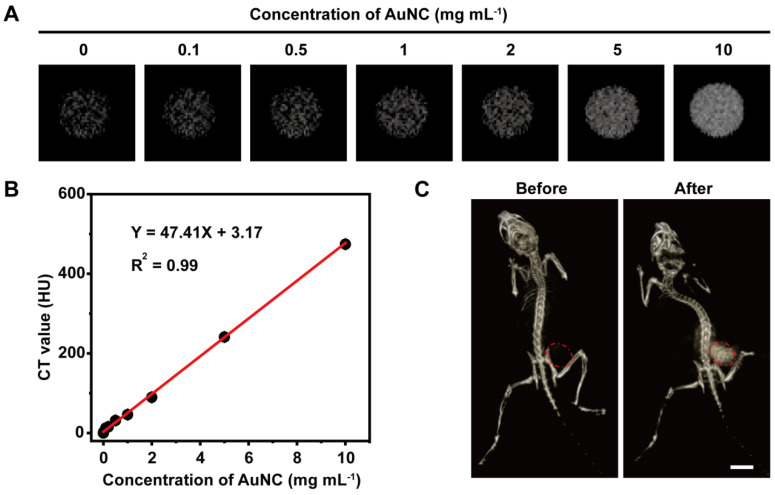
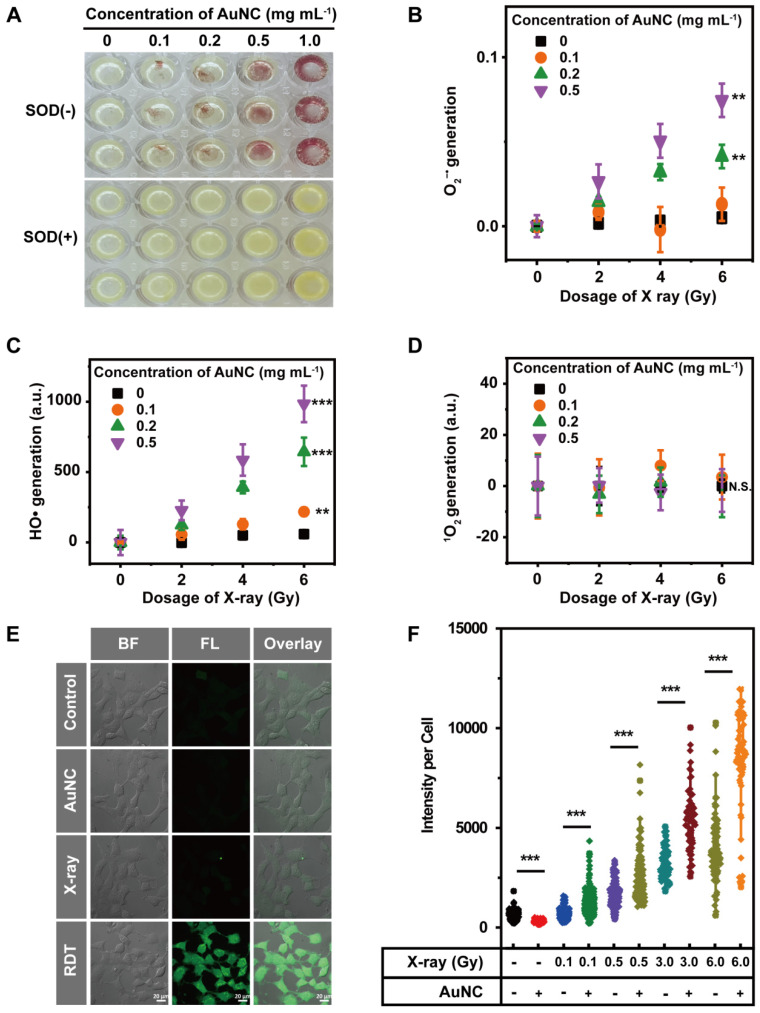
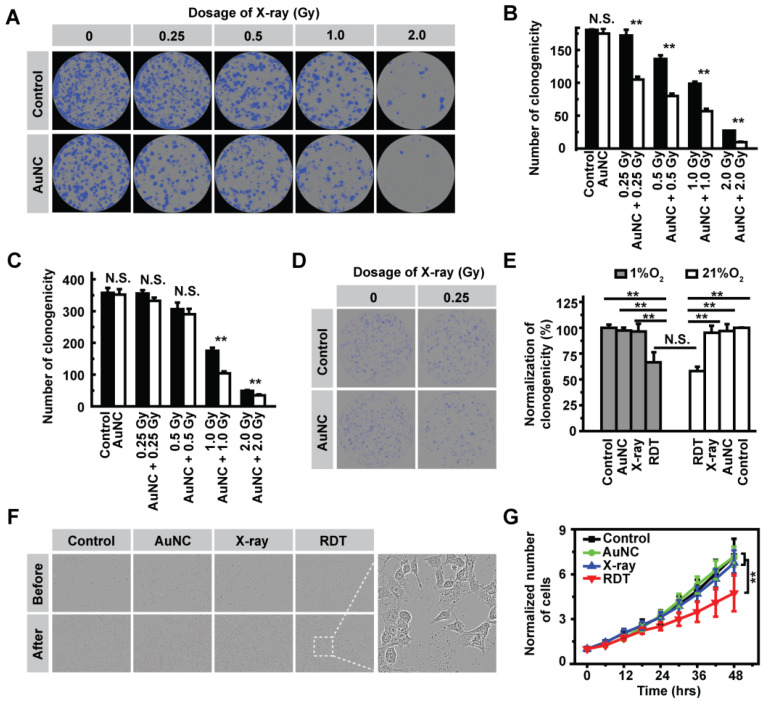
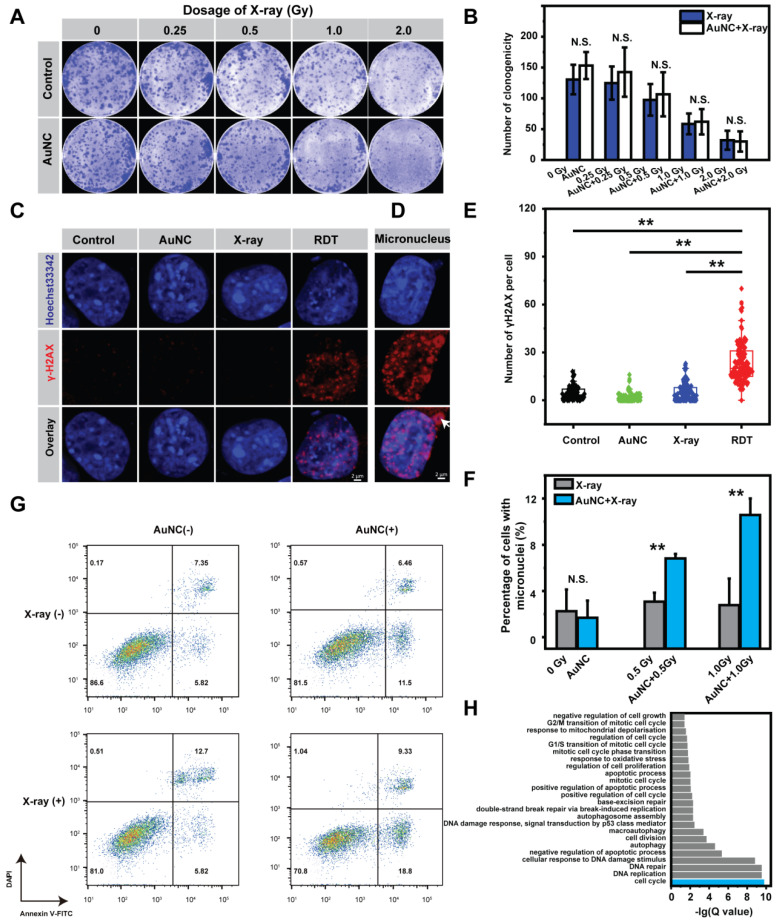
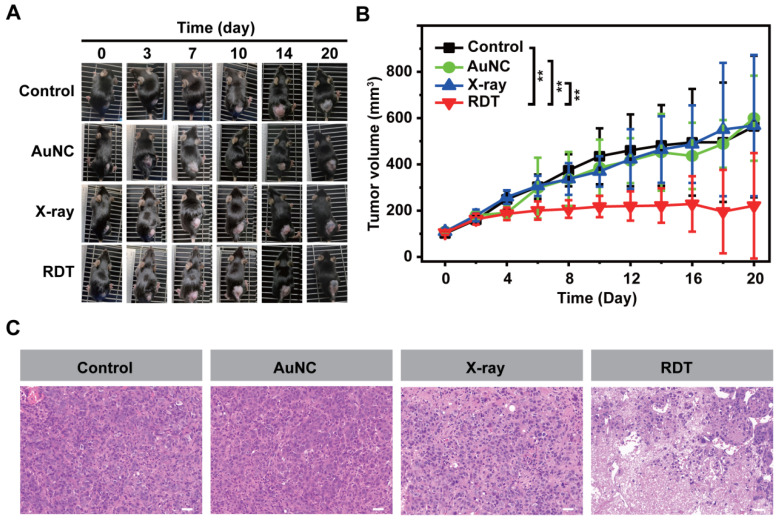
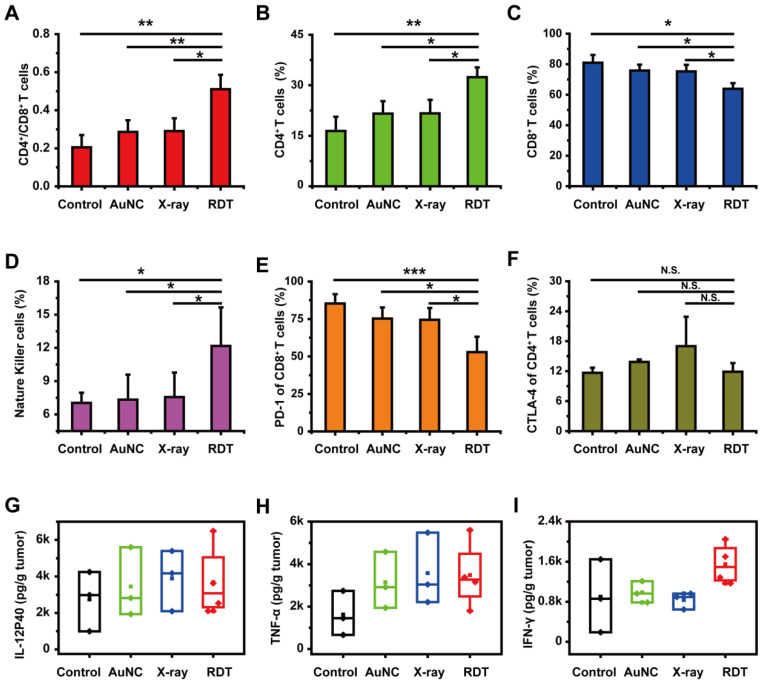
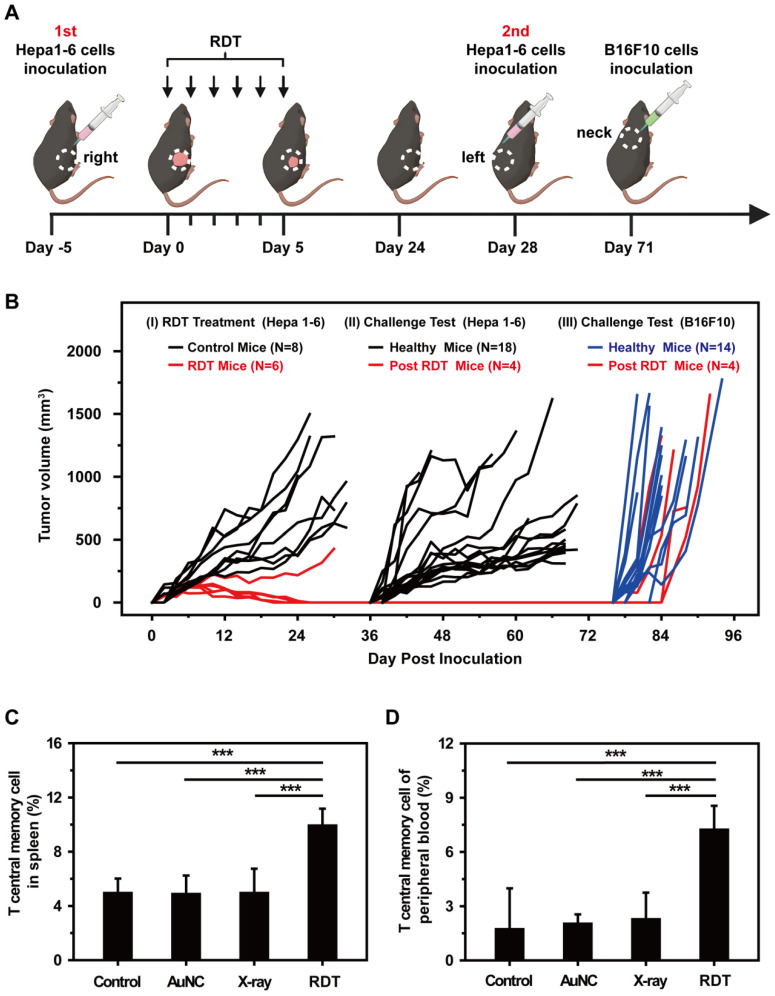
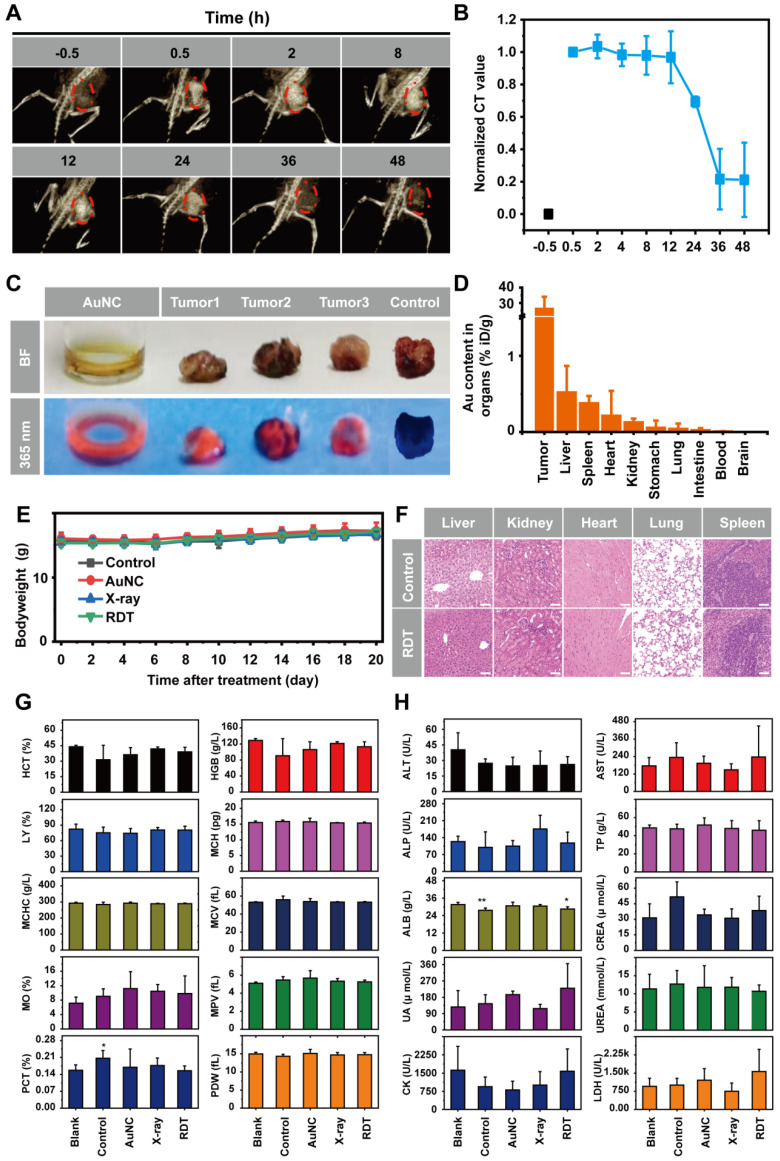
Background: Radiodynamic therapy (RDT) is an emerging novel anti-cancer treatment based on the generation of cytotoxic reactive oxygen species (ROS) at the lesion site following the interaction between low-dose X-ray and a photosensitizer (PS) drug. For a classical RDT, scintillator nanomaterials loaded with traditional PSs are generally involved to generate singlet oxygen (1O2). However, this scintillator-mediated strategy generally suffers from insufficient energy transfer efficiency and the hypoxic tumor microenvironment, and finally severely impedes the efficacy of RDT. Methods: Gold nanoclusters were irradiated by low dose of X-ray (called RDT) to investigate the production of ROS, killing efficiency of cell level and living body level, antitumor immune mechanism and biosafety. Results: A novel dihydrolipoic acid coated gold nanoclusters (AuNC@DHLA) RDT, without additional scintillator or photosensitizer assisted, has been developed. In contrast to scintillator-mediated strategy, AuNC@DHLA can directly absorb the X-ray and exhibit excellent radiodynamic performance. More importantly, the radiodynamic mechanism of AuNC@DHLA involves electron-transfer mode resulting in O2 -• and HO•, and excess ROS has been generated even under hypoxic conditions. Highly efficient in vivo treatment of solid tumors had been achieved via only single drug administration and low-dose X-ray radiation. Interestingly, enhanced antitumor immune response was involved, which could be effective against tumor recurrence or metastasis. Negligible systemic toxicity was also observed as a consequence of the ultra-small size of AuNC@DHLA and rapid clearance from body after effective treatment. Conclusions: Highly efficient in vivo treatment of solid tumors had been achieved, enhanced antitumor immune response and negligible systemic toxicity were observed. Our developed strategy will further promote the cancer therapeutic efficiency under low dose X-ray radiation and hypoxic conditions, and bring hope for clinical cancer treatment.

Keywords: antitumor immune; gold nanoclusters; radiodynamic therapy; solid tumor.


Conflict of interest statement

Competing Interests: The authors have declared that no competing interest exists.

Figures

Figure 1
Figure 1
(A) In vitro CT images of AuNC@DHLA with various concentrations. (B) CT values in Hounsfeild unit (HU) of AuNC@DHLA as a function of concentration. (C) CT images of a tumor bearing C57BL/6j mouse before and after intratumor injection with AuNC@DHLA (10.0 mg mL-1, 100 μL) at 8 h. The CT contrast was obviously enhanced in the mouse tumor (red dashed circle). Scale bar: 1 cm.
Figure 2
Figure 2
(A) The insoluble purple formazan product generated in the AuNC@DHLA aqueous solution when upon X-ray radiation (6.0 Gy). Moreover, more formazan could be observed with increasing the concentration of AuNC@DHLA. In the presence of superoxide dismutase (SOD), a scavenger of O2-•, these insoluble formazans could not be observed. (B) The amount of O2-• as a function of the dosage of X-ray. Increasing the dosage of X-ray generally results in more amount of O2-•. Besides that, under the same X-ray radiation conditions, more AuNC@DHLA generally produce more amount of O2-•. Statistical analysis was performed by two-tailed t-test (**p < 0.01). (C) Generation of HO• during X-ray radiation in the presence of AuNC@DHLA was analyzed using 3′-(p-aminophenyl) fluorescein (APF) as the HO• trap. The amount of generated HO• increased with increasing the dosage of X-ray. Statistical analysis was performed by two-tailed t-test (**p < 0.01, ***p < 0.001). (D) Generation of 1O2 from AuNC@DHLA upon X-ray radiation was analyzed with singlet oxygen sensor green (SOSG) assay. No apparent signal of 1O2 could be detected. Statistical analysis was performed by two-tailed t-test (N.S. p > 0.05). (E) Images of Hepa 1-6 cells stained with 2′,7′-dichlorodihydrofluorescein diacetate (DCFH-DA) after treatment with AuNC@DHLA and X-ray (0.5 Gy). For comparison, other controls, including treatment with AuNC@DHLA (200 μg mL-1) alone (without X-ray) and X-ray alone, are also demonstrated. The blank control group of cells received neither AuNC@DHLA nor X-ray. BF: bright field; FL: fluorescence after staining with 2′, 7′-dichlorodihydrofluorescein diacetate (DCFH-DA). (F) Corresponding intracellular fluorescence intensity of Hepa 1-6 cells (N ≥ 50). The concentration of AuNC was 200 μg mL-1. The box plot showed data points, and one point corresponded to the intensity per cell. Statistical analysis was performed by two-tailed t-test (***p < 0.001).
Figure 3
Figure 3
(A) Representative images of the colony formation assay and (B) Statistical results of the surviving fraction of Hepa 1-6 cells with different treatments in normoxic condition (21% O2). Statistical analysis was performed by two-tailed t-test (**p < 0.01). (C) Statistical results of the surviving fraction of 293T cells with different treatments in normoxic condition (21% O2). Statistical analysis was performed by two-tailed t-test (**p < 0.01). (D) Representative images of the colony formation assay of Hepa 1-6 cells in hypoxic condition (1% O2). (E) Statistical results of the surviving fraction of Hepa 1-6 cells under 1% O2 and 21% O2 condition. Statistical analysis was performed by two-tailed t-test (**p < 0.01). (F) Representative bright field imaging of Hepa 1-6 cells before and after RDT treatment at 48 h. Inset: A magnified region of the cancer cells after AuNC@DHLA + X-ray (1.0 Gy) treatment. Abnormal cell morphology could be obviously observed. (G) The relative number of cells at different time points after treatments. Statistical analysis was performed by two-tailed t-test (**p < 0.01). The AuNC group: 100 μg mL-1; The X-ray group: 1.0 Gy; The RDT group: 100 μg mL-1 AuNC@DHLA + 1.0 Gy X-ray.
Figure 4
Figure 4
(A) Representative images of the colony formation assay and (B) Statistical results of the surviving fraction of Hepa 1-6 cells with different treatments in the presence of ROS inhibitor vitamin C. The concentration of AuNC@DHLA was 200 μg mL-1. Statistical analysis was performed by two-tailed t-test (N.S. p > 0.05). (C) DNA damage as measured by Alexa Fluor® 555 second antibody (red), γ-H2AX monoclonal antibody and Hoechst 33342 (blue) for visualizing DNA fragmentation and nucleus respectively in Hepa 1-6 cells with and without AuNC@DHLA (200 μg mL-1) under X-ray radiation (1.0 Gy). (D) Representative images of micronucleus, indicated by white arrow. (E) The corresponding statistical result of γ-H2AX per cell (N ≥ 100) induced by different treatments as indicated. The concentration of AuNC@DHLA was 200 μg mL-1. Statistical analysis was performed by two-tailed t-test (**p < 0.01). (F) The percentage of Hepa 1-6 cells with micronucleus after receiving different treatments (control group, AuNC@DHLA group, X-ray group (0.5 Gy or 1.0 Gy), AuNC@DHLA + X-ray group (0.5 Gy or 1.0 Gy). The concentration of AuNC@DHLA was 200 μg mL-1. Statistical analysis was performed by two-tailed t-test (**p < 0.01). (G) Apoptosis results of Hepa 1-6 cells treated without (control) and with AuNC@DHLA (200 μg mL-1) before and after X-ray radiation (1.0 Gy). (H) Bar plot of biological function enriched at FDR < 5% for AuNC@DHLA based radiodynamic therapy. N = 3 independent samples per group. FDR, false discovery rate.
Figure 5
Figure 5
In vivo AuNC@DHLA-based radiodynamic therapy. The day of injection was designated as day 0. (A) Photo images of Hepa 1-6 tumors in mice after different treatment. These mice injected only with PBS were designated as the control group. These mice irradiated with X-ray at dose of 0.25 Gy (1.0 Gy min-1), without AuNC@DHLA, were designated as the X-ray group. These mice injected with AuNC@DHLA (6.1 mg kg-1), without X-ray radiation, were designated as the AuNC group. These mice injected with AuNC@DHLA (6.1 mg kg-1) and irradiated with X-ray at dose of 0.25 Gy (1.0 Gy min-1) were designated as the RDT group. (B) Tumor growth curve of Hepa 1-6 tumor-bearing C57BL/6j mice from different groups within 20 days. Data are represented as mean ± SD (4 mice per group). Data were analyzed by two-tailed t-test (**p < 0.01). (C) Slices of H&E staining of tumors with different treatment.
Figure 6
Figure 6
Antitumor immune response of AuNC@DHLA RDT. (A) Different groups of tumor-infiltrating CD4+/CD8+ T cells, (B) the percentage of tumor-infiltrating CD4+ T cells, (C) the percentage of tumor-infiltrating CD8+ T cells, (D) the percentage of tumor-infiltrating natural killer cells (NK), (E) the percentage of PD-1 expression on tumor-infiltrating CD8+ T cells and (F) CTLA-4 expression on tumor-infiltrating CD4+ T cells. Except that NK data analyzed by single-tailed t-test, all other data were analyzed by two-tailed t-test ((***p < 0.001, **p < 0.01, *p < 0.05, N.S. p > 0.05). (G) The secretion of interleukin-12p40 (IL-12P40), (H) tumor necrosis factor α (TNF-α) and (I) interferon γ (IFN-γ) in tumor sites in different groups. All data were analyzed by One-way ANOVA.
Figure 7
Figure 7
(A) Schematic illustration showing the design of animal experiments. (B) Tumor growth curves in the tumor challenge study. The tumor size of each mouse was plotted separately in control (black and blue curves) and RDT group (red curves), showing that five out of six mice in RDT group were tumor free after treatment. The black and blue curves showed the tumor growth curves of three control groups with Hepa 1-6 (black) or B16F10 (blue) tumor cells injected on the same days. (C) Spleen-infiltrating T central memory cells and (D) T central memory cells of peripheral blood in different groups on the 15th day after RDT treatment. Data were analyzed by two-tailed t-test (***p < 0.001).
Figure 8
Figure 8
In vivo toxicity studies of AuNC@DHLA RDT. (A) In vivo 3D CT images of tumor-bearing mice before and at 0.5, 2, 8, 12, 24, 36, and 48 h after intratumoral injection of AuNC@DHLA (10 mg mL-1, 100 μL). The tumor is indicated by red dotted lines. (B) Statistics of in vivo pharmacokinetic process of AuNC@DHLA. (C) AuNC@DHLA aquatos solution and tumor treated with and without AuNC@DHLA under natural light (BF: bright filed) and under 365 nm at 48 h post injection. (D) Biodistribution of AuNC@DHLA in the main organs at 48 h post injection, as determined by ICP-MS. Data are presented as mean ± SD. N = 3. (E) Body weight curves of mice that received different treatments. No obvious loss of body weight was observed in all the groups. (F) Slices of H&E staining containing liver, kidney, heart, lung, and spleen of tumor-bearing mice on the 20th day after treatment with PBS and RDT. Scale bar: 50 µm. (G) Hematology data of mice with different treatments on day 20. The results show mean and standard deviation of hematocrit (HCT%), hemoglobin (HGB), lymphocyte ratio (LY%), mean corpuscular hemoglobin (MCH), mean corpuscular hemoglobin concentration (MCHC), mean corpuscular volume (MCV), monocyte rate (MO%), mean platelet volume (MPV), plateletcrit (PCT%), platelet distribution width (PDW). Data were analyzed by two-tailed t-test (*p < 0.05). (H) Blood biochemistry analysis of mice with different treatments on day 20. The results show mean and standard deviation of alanine aminotransferase (ALT), aspartate aminotransferase (AST), alkaline phosphatase (ALP), total protein (TP), albumin (ALB), creatinine (CREA), uric acid (UA), urea (UREA), creatine kinase (CK), and lactic dehydrogenase (LDH). Data were analyzed by two-tailed t-test (**p < 0.01, *p < 0.05).

Similar articles

Cited by

References

    1. Dolmans DE, Fukumura D, Jain RK. Photodynamic therapy for cancer. Nat Rev Cancer. 2003;3:380–7. - PubMed
    1. Li X, Lovell JF, Yoon J, Chen X. Clinical development and potential of photothermal and photodynamic therapies for cancer. Nat Rev Clin Oncol. 2020;17:657–74. - PubMed
    1. Hu J, Tang Ya, Elmenoufy AH, Xu H, Cheng Z, Yang X. Nanocomposite-based photodynamic therapy strategies for deep tumor treatment. Small. 2015;11:5860–87. - PubMed
    1. Fan W, Huang P, Chen X. Overcoming the Achilles' heel of photodynamic therapy. Chem Soc Rev. 2016;45:6488–519. - PubMed
    1. Tew LS, Cai M-T, Lo L-W, Khung YL, Chen N-T. Pollen-structured gold nanoclusters for X-ray induced photodynamic therapy. Materials (Basel) 2018;11:1170. - PMC - PubMed

Publication types