. 2023 Jan 22;13(3):1059-1075.
doi: 10.7150/thno.81067. eCollection 2023.

Hyperactive neuronal autophagy depletes BDNF and impairs adult hippocampal neurogenesis in a corticosterone-induced mouse model of depression

Affiliations

Hyperactive neuronal autophagy depletes BDNF and impairs adult hippocampal neurogenesis in a corticosterone-induced mouse model of depression

Kuo Zhang et al. Theranostics. .

Abstract

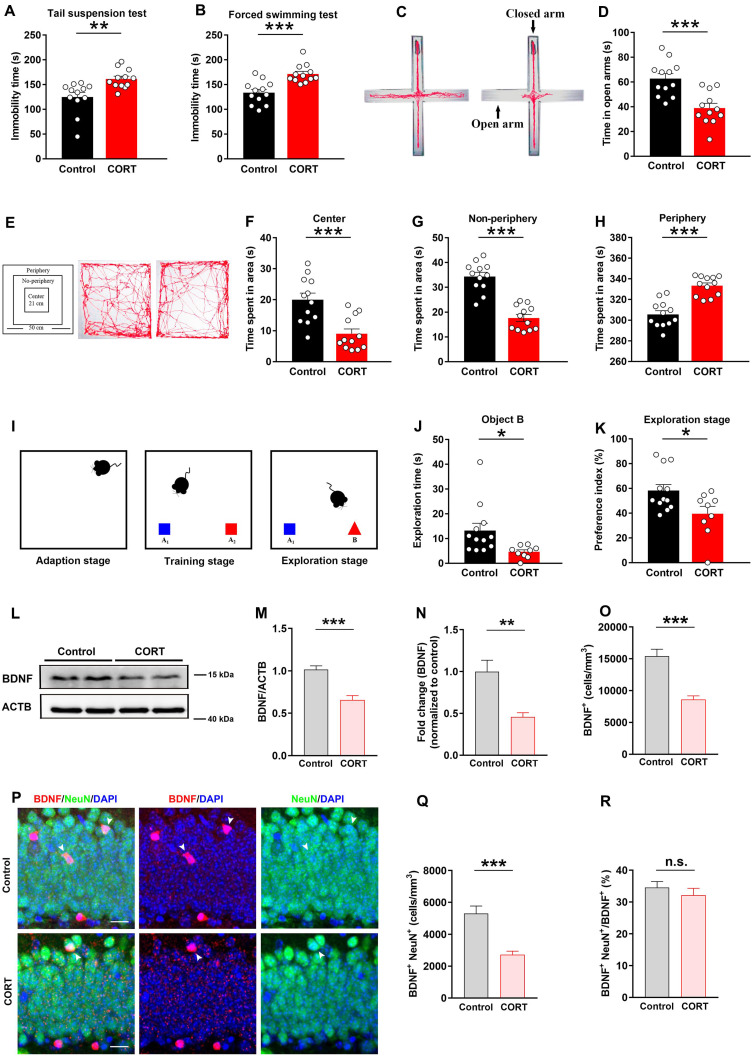
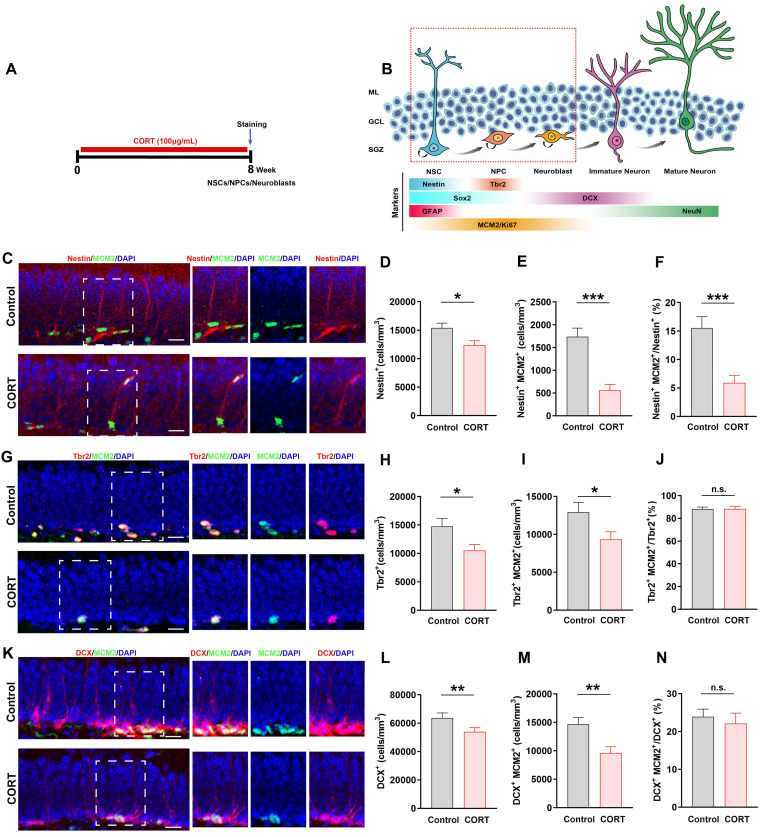
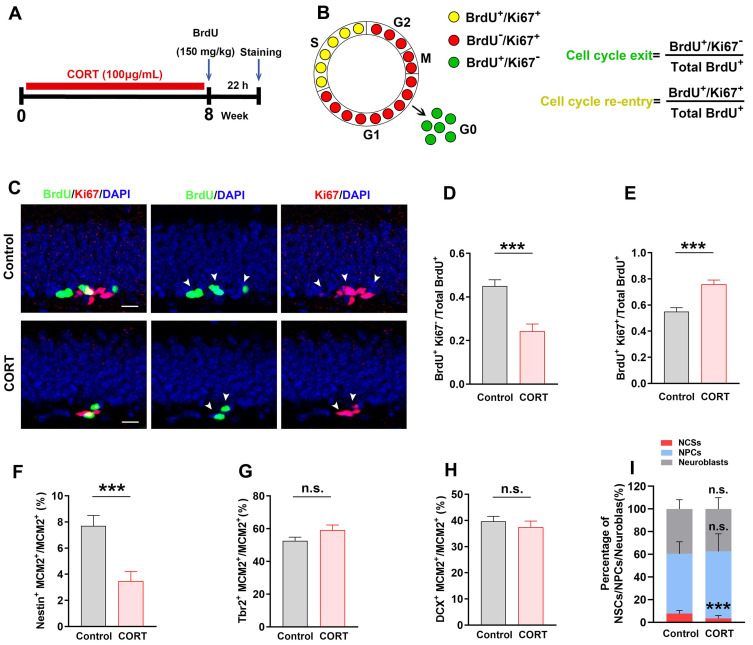
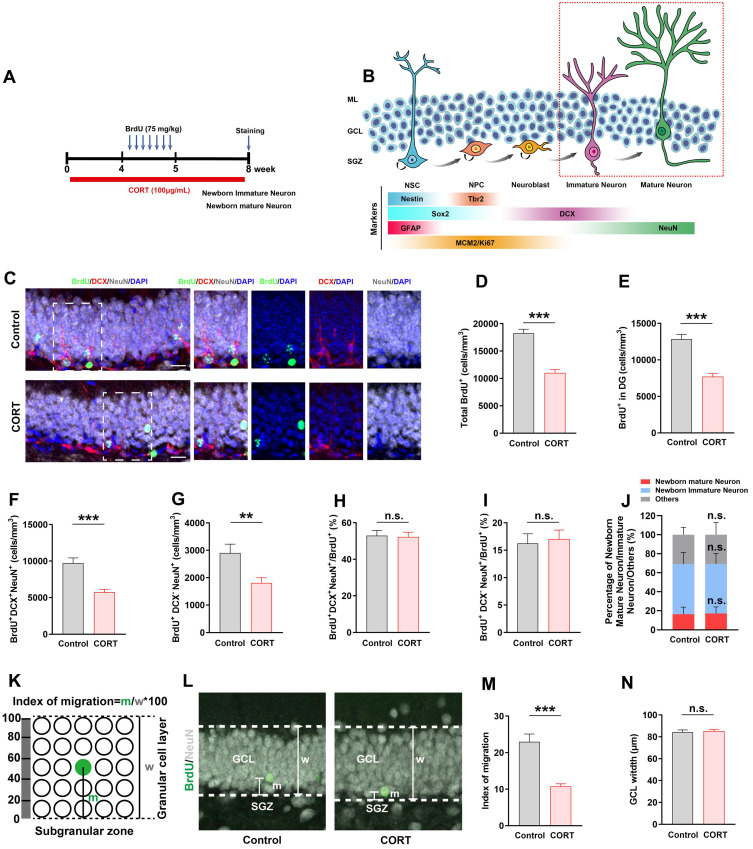
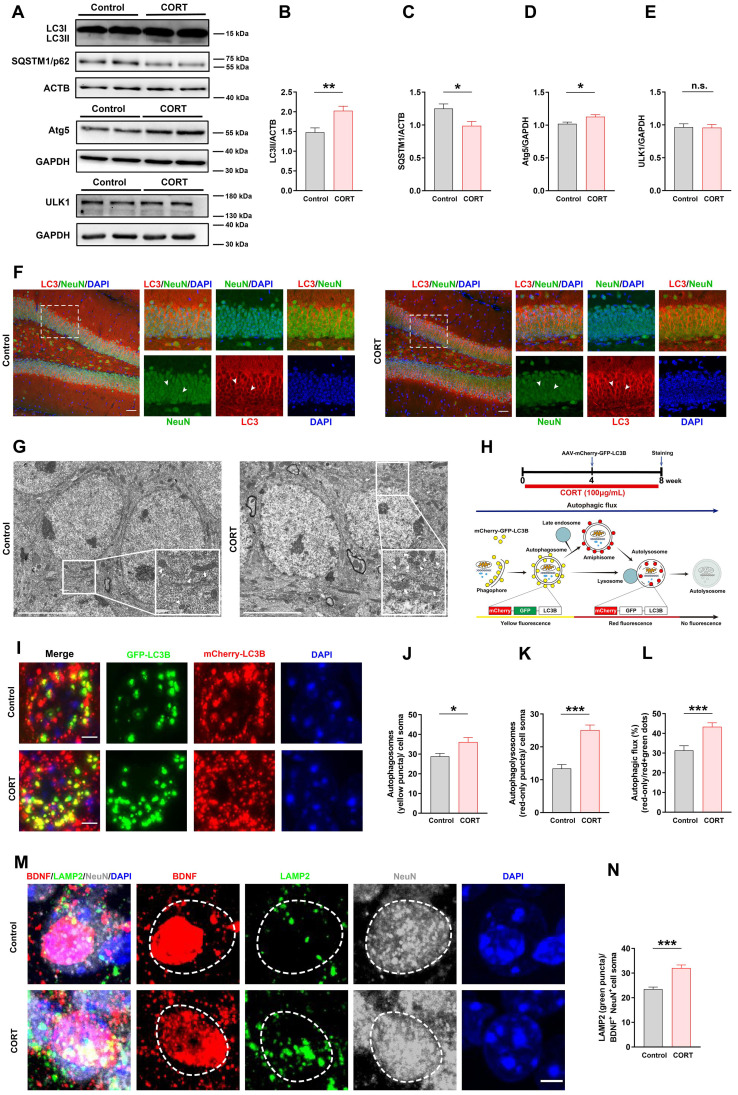
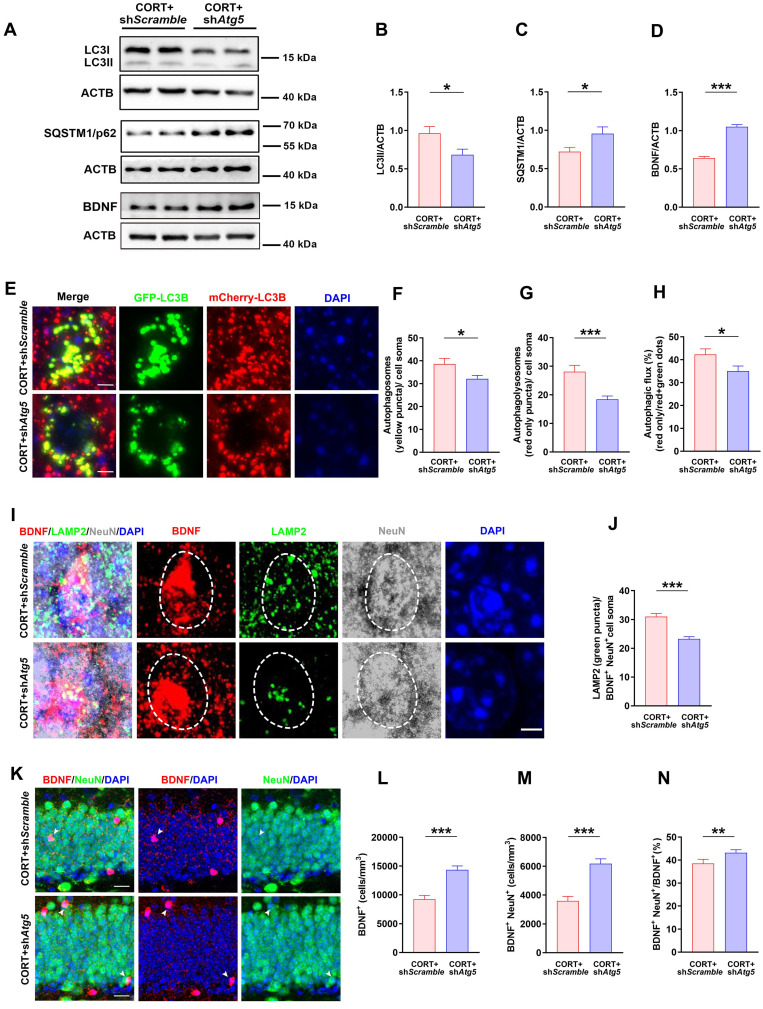
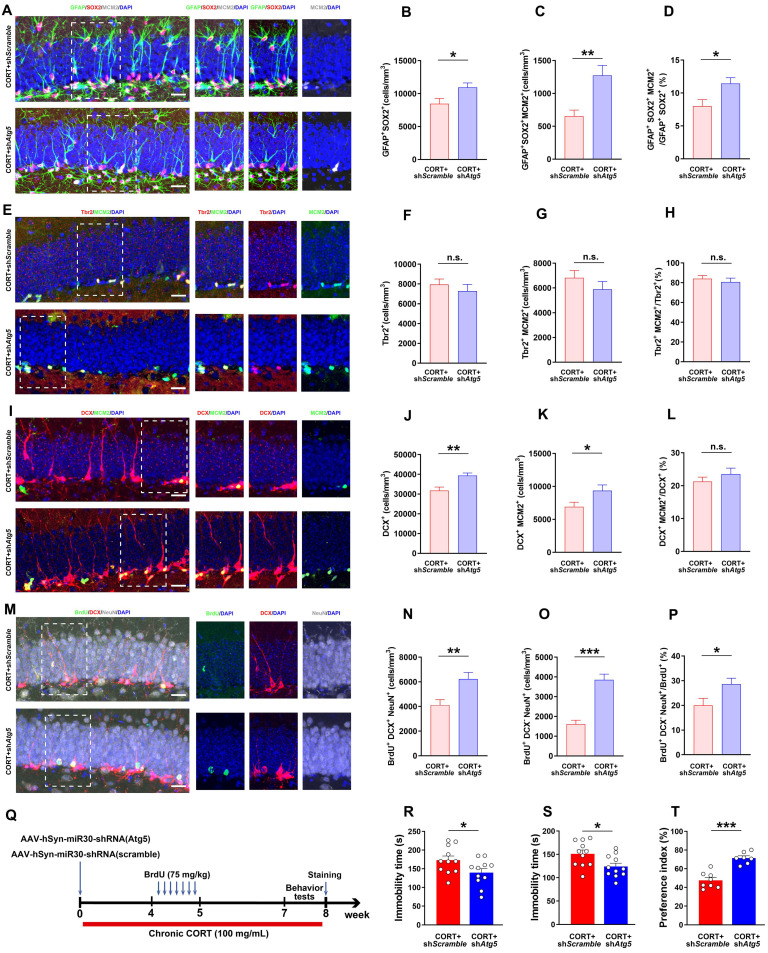
Background: Depression is a mental disorder that poses a serious threat to human health. Adult hippocampal neurogenesis (AHN) is closely associated with the efficacy of antidepressants. Chronic treatment with corticosterone (CORT), a well-validated pharmacological stressor, induces depressive-like behaviors and suppresses AHN in experimental animals. However, the possible mechanisms of chronic CORT action remain elusive. Methods: A chronic CORT treatment (0.1 mg/mL, drinking water for 4 weeks) was applied to prepare a mouse model of depression. Immunofluorescence was performed to analyze the hippocampal neurogenesis lineage, and immunoblotting, immunofluorescence, electron microscopy, and adeno-associated virus (AAV) expressing a pH-sensitive tandemly tagged light chain 3 (LC3) protein were used to analyze neuronal autophagy. AAV-hSyn-miR30-shRNA was used to knock down autophagy-related gene 5 (Atg5) expression in the neurons. Results: Chronic CORT induces depressive-like behaviors and decreases the expression of neuronal brain-derived neurotrophic factor (BDNF) in the dentate gyrus (DG) of the hippocampus in mice. Moreover, it markedly diminishes the proliferation of neural stem cells (NSCs), neural progenitor cells, and neuroblasts and impairs the survival and migration of newborn immature and mature neurons in the DG, which may be attributed to changes in the cell cycle kinetics and induction of NSCs apoptosis. Furthermore, chronic CORT induces hyperactive neuronal autophagy in the DG, possibly by increasing the expression of ATG5 and causing excess lysosomal degradation of BDNF in neurons. Notably, inhibiting hyperactive neuronal autophagy in the DG of mice by knocking down Atg5 in neurons using RNA interference reverses the decrease of neuronal BDNF expression, rescues AHN, and exerts antidepressant effects. Conclusion: Our findings reveal a neuronal autophagy-dependent mechanism that links chronic CORT to reduced neuronal BDNF levels, AHN suppression and depressive-like behavior in mice. In addition, our results provide insights for treating depression by targeting neuronal autophagy in the DG of the hippocampus.

Keywords: Adult hippocampal neurogenesis; BDNF; Corticosterone; Depression; Neuronal autophagy..


Conflict of interest statement

Competing Interests: The authors have declared that no competing interest exists.

Figures

Figure 1
Figure 1
CORT induces depressive-like behaviors, hippocampal-dependent cognitive deficits, reduced neuronal BDNF levels. (A) Immobility time in the TST. n = 12 per group, P = 0.0029. (B) Immobility time in the FST. n = 12 per group, P = 0.0002. (C) Representative tracking plots of the EPM. (D) Time spent in the open arms of the EPM. n = 12 per group, P = 0.0003. (E) Representative tracking plots of the OFT. (F) Average time spent in the central area of the OFT. n = 12 per group, P = 0.0004. (G) Time spent in the non-periphery area of the OFT. n = 12 per group, P < 0.0001. (H) Time spent in the periphery area of the OFT. n = 12 per group, P < 0.0001. (I) Diagram of the NOR test. (J) Exploration time for the novel object B in the exploration stage of the NOR test. Control (n = 12), CORT (n = 9), P = 0.0237. (K) Preference index in the exploration stage of the NOR test. Control (n = 12), CORT (n = 9), P = 0.0248. (L) Representative western blots analyzing BDNF protein expression in the control and CORT groups. (M) Quantification of BDNF expression. n = 3 mice per group, P < 0.0001. (N) Quantification of BDNF gene mRNA expression. n = 4 mice per group, P = 0.0024. (O) Quantification of BDNF+ cells. n = 3 mice per group, P < 0.0001. (P) Representative images of the control and CORT DG with double immunostaining of BDNF+ (red) and NeuN+ (green) cells. Arrowheads indicate BDNF+/NeuN+ cells. (Q) Quantification of BDNF+NeuN+ cells. n = 3 mice per group, P < 0.0001. (R) Quantification of BDNF+NeuN+ cells/total BDNF+ cells. n = 3 mice per group, P = 0.4026. Scale bar = 20 μm. Data are presented as the mean ± standard error of mean (SEM). Two-tailed unpaired t-test was used to identify statistically significant differences between datasets (*P < 0.05, **P < 0.01, ***P < 0.001 compared to the control group). n.s., non-significant difference.
Figure 2
Figure 2
Chronic CORT treatment depletes neural stem cells (NSCs), neural progenitor cells (NPCs), and neuroblasts, and impacts the proliferation of neural progenitor cells NSCs, NPCs, and neuroblasts. (A) Timeline of the experimental procedure for assessing adult hippocampal neurogenesis (AHN). (B) Diagram showing the AHN lineage and markers. (C) Representative images of the control and CORT DG with double immunostaining of Nestin+ (red) and MCM2+ (green) cells. (D) Quantification of Nestin+ cells. n = 4 mice per group, P = 0.0095. (E) Quantification of Nestin+MCM2+ cells. n = 4 mice per group, P < 0.0001. (F) Quantification of Nestin+MCM2+/Nestin+ cells. n = 3 mice per group, P = 0.0006. (G) Representative images of the control and CORT DG with double immunostaining of Tbr2+ (red) and MCM2+ (green) cells. (H) Quantification of Tbr2+ cells. n = 4 mice per group, P = 0.0200. (I) Quantification of Tbr2+MCM2+ cells. n = 4 mice per group, P = 0.0309. (J) Quantification of Tbr2+MCM2+/Tbr2+ cells. n = 4 mice per group, P = 0.9473. (K) Representative images of the control and CORT DG with double immunostaining of DCX+ (red) and MCM2+ (green) cells. (L) Quantification of DCX+ cells. n = 4 per group, P = 0.0436. (M) Quantification of DCX+MCM2+ cells. n = 4 per group, P = 0.0033. (N) Quantification of DCX+MCM2+/DCX+ cells. n = 3 mice per group, P = 0.6096. Scale bar = 20 μm. Data are presented as the mean ± SEM. Two-tailed unpaired t-test was used to identify statistically significant differences between datasets (*P < 0.05, **P < 0.01, ***P < 0.001 compared to the control group). n.s., non-significant difference.
Figure 3
Figure 3
Chronic CORT treatment impairs the cell cycle kinetics of NSCs. (A) Timeline of the experimental procedure, including BrdU administration. (B) Schematic diagram showing how BrdU and Ki67 co-labeling reflects the different stages of the cell cycle. The equations for calculating the index of cell cycle exit and re-entry are shown at the right. (C) Representative images of the control and CORT DG with double immunostaining of BrdU+ (green) and Ki67+ (red). White arrowheads indicate Ki67+/BrdU+ cells. (D) Quantification of BrdU+Ki67-/total BrdU+ cells. n = 7 mice per group, P < 0.0001. (E) Quantification of BrdU+Ki67+/total BrdU+ cells. n = 7 mice per group, P < 0.0001. (F) Quantification of Nestin+MCM2+/MCM2+ cells. n = 3 mice per group, P = 0.0006. (G) Quantification of Tbr2+MCM2+/MCM2+ cells. n = 4 mice per group, P = 0.9473. (H) Quantification of DCX+MCM2+/MCM2+ cells. n = 3 mice per group, P = 0.2207. (I) The proportion of NSCs, NPCs, and neuroblasts among all proliferating cells (NSCs + NPCs + neuroblasts) in the DG of CORT and control mice. n = 3 mice per group, P = 0.0007. Scale bar = 20 μm. Data are presented as the mean ± SEM. Two-tailed unpaired t-test was used to identify statistically significant differences between datasets (*P < 0.05, ***P < 0.001 compared to the control group). n.s., non-significant difference.
Figure 4
Figure 4
Chronic CORT treatment impairs the survival of newborn immature/mature neurons and suppresses the migration of newborn mature neurons. (A) Timeline of the experimental procedure. (B) Diagram of the AHN lineage and the markers used to identify the different cell types. (C) Representative images of the control and CORT DG with triple immunostaining of BrdU+ (green), DCX+ (red), and NeuN+ (gray) cells. (D) Quantification of total BrdU+ cells in the DG, hilus and molecular layer. n = 4 mice per group, P < 0.0001. (E) Quantification of BrdU+ cells in the DG. n = 4 mice per group, P < 0.0001. (F) Quantification of BrdU+DCX+NeuN+ cells. n = 4 mice per group, P < 0.0001. (G) Quantification of BrdU+DCX-NeuN+ cells. n = 4 mice per group, P < 0.0001. (H) Quantification of BrdU+DCX+NeuN+ cells/total BrdU+ cells. n = 4 mice per group, P = 0.8490. (I) Quantification of BrdU+DCX-NeuN+ cells/total BrdU+ cells. n = 4 mice per group, P = 0.7392. (J) Proportion of newborn mature neurons, newborn immature neurons, and other newborn cells among all newborn cells. n = 4 mice per group, P > 0.05. (K) Schematic representation of the calculation method used for assessing the migration of newborn neurons in GCL. (L) Representative images showing the migration of newborn mature neurons (BrdU+NeuN+) in GCL. (M) Quantification of the migration index in CORT and control mice. n = 4 mice per group, P < 0.0001. (N) Quantification of the GCL width. n = 4 mice per group, P = 0.7087. Scale bar = 20 μm. Data are presented as the mean ± SEM. Two-tailed unpaired t-test was used to identify statistically significant differences between datasets (**P < 0.01, ***P < 0.001 when compared to the control group). n.s., non-significant difference.
Figure 5
Figure 5
Chronic CORT treatment induces hyperactive neuronal autophagy and promotes lysosomal degradation of neuronal BDNF in mice. (A) Representative western blots analyzing protein expression in control and CORT groups. (B) Quantification of LC3II expression. n = 3 mice per group, P = 0.0015. (C) Quantification of SQSTM1/p62 expression. n = 3 mice per group, P = 0.0115. (D) Quantification of Atg5 expression. n = 3 mice per group, P = 0.0106. (E) Quantification of ULK1 expression. n = 3 mice per group, P = 0.9826. (F) Representative images of the control and CORT DG with double immunostaining of LC3+ (red) and NeuN+ (green) cells. Arrowheads indicate LC3+/NeuN+ cells. (G) Representative electron microscopic images of autophagosomes (white triangles) and autolysosomes (white arrows) in control and CORT mice. (H) Timeline of the procedure for the AAV-mCherry-GFP-LC3 experiment (top) and schematic diagram illustrating the detection of different autophagic structures by the mCherry-GFP-LC3 fusion protein (bottom). (I) Representative images of AAV-expressed mCherry-GFP-LC3 in control and CORT groups. (J) Quantification of autophagosomes (yellow puncta) in cell soma. n = 4 mice per group, P = 0.0111. (K) Quantification of autolysosomes (red-only puncta) in cell soma. n = 4 mice per group, P < 0.0001. (L) Quantification of autophagic flux. n = 4 mice per group, P = 0.0002. (M) Representative images of the control and CORT DG with triple immunostaining of BDNF+ (red), LAMP2+ (green), and NeuN+ (gray) cells. The dashed circles indicate BDNF+ neurons. (N) Quantification of the number of LAMP2 puncta (green) in BDNF+NeuN+ cell soma. n = 3 mice per group, P < 0.0001. Scale bar = 50 μm (Figure 5F). Scale bar = 5 μm (Figure 5G, 5I and 5M). Data are presented as the mean ± SEM. Two-tailed unpaired t-test was used to identify statistically significant differences between datasets (*P < 0.05, **P < 0.01, ***P < 0.001 compared to the control group). n.s., non-significant difference.
Figure 6
Figure 6
Inhibiting increases in neuronal autophagy reduces lysosomal degradation of neuronal BDNF and increases neuronal BDNF expression in mice. (A) Representative western blots analyzing protein expression in the CORT+shScramble and CORT+shAtg5 groups. (B) Quantification of LC3II expression. n = 3 mice per group, P = 0.0222. (C) Quantification of SQSTM1/p62 expression. n= 3 mice per group, P = 0.0327. (D) Quantification of BDNF expression. n= 3 mice per group, P < 0.0001. (E) Representative images of AAV-expressed mCherry-GFP-LC3 in the CORT+shScramble and CORT+shAtg5. (F) Quantification of autophagosomes (yellow puncta) in cell soma. n = 4 mice per group, P = 0.0482. (G) Quantification of autolysosomes (red-only puncta) in cell soma. n = 4 mice per group, P = 0.0007. (H) Quantification of autophagic flux. n = 4 mice per group, P = 0.0336. (I) Representative images of DG from CORT+shScramble and CORT+shAtg5 mice with triple immunostaining of BDNF+ (red), LAMP2+ (green), and NeuN+ (gray) cells. Dashed circles indicate BDNF+ neurons. (J) Quantification of the number of LAMP2 puncta (green) in BDNF+NeuN+ cell soma. n= 3 mice per group, P < 0.0001. (K) Representative images of DG in CORT+shScramble and CORT+shAtg5 mice with double immunostaining of BDNF+ (red) and NeuN+ (green) cells. Arrowheads indicate BDNF+NeuN+ cells. (L) Quantification of BDNF+ cells. n = 3 mice per group, P < 0.0001. (M) Quantification of BDNF+NeuN+ cells. n = 3 mice per group, P < 0.0001. (N) Quantification of BDNF+NeuN+ cells/total BDNF+ cells. n = 3 mice per group, P = 0.0453. Data are presented as the mean ± SEM. Scale bar = 5 μm (Figure 6E and 6I). Scale bar = 20 μm (Figure 6K). Two-tailed unpaired t-test was used to identify statistically significant differences between datasets (*P < 0.05, **P < 0.01, ***P < 0.001 compared to CORT+shScramble group).
Figure 7
Figure 7
Inhibiting increased neuronal autophagy rescues AHN and exerts an antidepressant effect. (A) Representative images of DG in CORT+shScramble and CORT+shAtg5 mice with triple immunostaining of GFAP+ (green), SOX2+ (red), and MCM2+ (gray) cells. (B) Quantification of GFAP+SOX2+ cells. n = 4 mice per group, P = 0.0237. (C) Quantification of GFAP+SOX2+MCM2+ cells. n = 4 mice per group, P = 0.0022. (D) Quantification of GFAP+SOX2+MCM2+/GFAP+SOX2+ cells. n = 4 mice per group, P = 0.0135. (E) Representative images of DG in CORT+shScramble and CORT+shAtg5 mice with double immunostaining of Tbr2+ (red) and MCM2+ (green) cells. (F) Quantification of Tbr2+ cells. n = 3 mice per group, P = 0.4581. (G) Quantification of Tbr2+MCM2+ cells. n = 3 mice per group, P = 0.2891. (H) Quantification of Tbr2+MCM2+/Tbr2+ cells. n = 3 mice per group, P = 0.9484. (I) Representative images of DG in CORT+shScramble and CORT+shAtg5 mice with double immunostaining of DCX+ (red) and MCM2+ (green) cells. (J) Quantification of DCX+ cells. n = 3 mice per group, P = 0.0015. (K) Quantification of DCX+MCM2+ cells. n = 3 mice per group, P = 0.0352. (L) Quantification of DCX+MCM2+/DCX+ cells. n = 3 mice per group, P = 0.3326. (M) Representative images of DG in CORT+shScramble and CORT+shAtg5 mice with triple immunostaining of BrdU+ (green), DCX+ (red), and NeuN+ (gray) cells. (N) Quantification of BrdU+DCX+NeuN+ cells. n = 3 mice per group, P = 0.0050. (O) Quantification of BrdU+DCX-NeuN+ cells. n = 3 mice per group, P < 0.0001. (P) Quantification of BrdU+DCX-NeuN+/BrdU+ cells. n = 3 mice per group, P = 0.0279. Scale bar = 20 μm. (Q) Timeline of the experimental procedure to knock down Atg5 via AAV-mediated shRNA expression. (R) Immobility time in the TST. n = 11 mice per group, P = 0.0414. (S) Immobility time in the FST. n = 11 mice per group, P = 0.0203. (T) Preference index in the exploration stage of the NOR test. CORT+shScramble (n=8 mice per group), CORT+shAtg5 (n=7 mice per group), P < 0.0001. Data are presented as the mean ± SEM. Two-tailed unpaired t-test was used to identify statistically significant differences between datasets (*P < 0.05, **P < 0.01, ***P < 0.001 compared to CORT+shScramble group). n.s., non-significant difference.

Similar articles

Cited by

References

    1. Dubovsky SL, Ghosh BM, Serotte JC, Cranwell V. Psychotic depression: diagnosis, differential diagnosis, and treatment. Psychother Psychosom. 2021;90:160–77. - PubMed
    1. Cruz-Pereira JS, Rea K, Nolan YM, O'Leary OF, Dinan TG, Cryan JF. Depression's unholy trinity: dysregulated stress, immunity, and the microbiome. Annu Rev Psychol. 2020;71:49–78. - PubMed
    1. de Kloet ER, Joels M, Holsboer F. Stress and the brain: from adaptation to disease. Nat Rev Neurosci. 2005;6:463–75. - PubMed
    1. Dean J, Keshavan M. The neurobiology of depression: an integrated view. Asian J Psychiatr. 2017;27:101–11. - PubMed
    1. Carrard A, Casse F, Carron C, Burlet-Godinot S, Toni N, Magistretti PJ. et al. Role of adult hippocampal neurogenesis in the antidepressant actions of lactate. Mol Psychiatry. 2021;26:6723–35. - PMC - PubMed

Publication types

Substances