

Investigating phenotypic relationships in persimmon accessions through integrated proteomic and metabolomic analysis of corresponding fruits
- PMID: 36794209
- PMCID: PMC9923171
- DOI: 10.3389/fpls.2023.1093074
Investigating phenotypic relationships in persimmon accessions through integrated proteomic and metabolomic analysis of corresponding fruits
Abstract
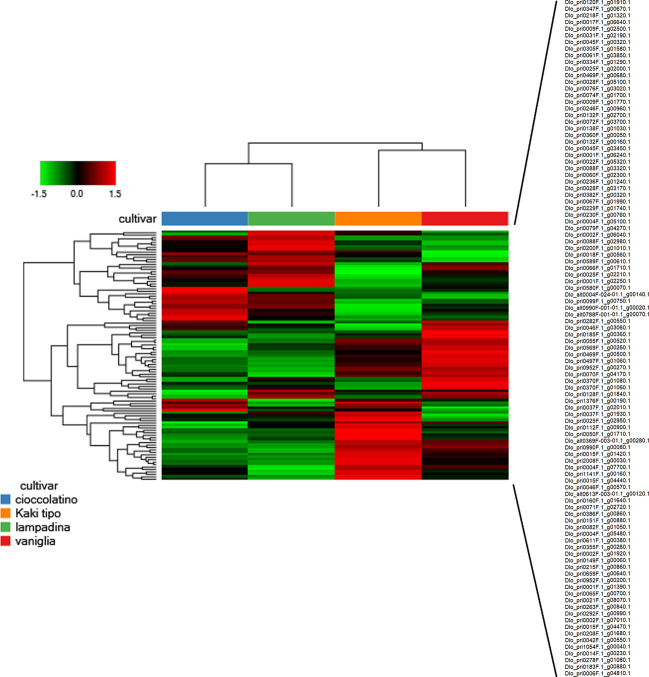
Together with phenological and genomic approaches, gel-based and label-free proteomic as well metabolomic procedures were separately applied to plants to highlight differences between ecotypes, to estimate genetic variability within/between organism populations, or to characterize specific mutants/genetically modified lines at metabolic level. To investigate the possible use of tandem mass tag (TMT)-based quantitative proteomics in the above-mentioned contexts and based on the absence of combined proteo-metabolomic studies on Diospyros kaki cultivars, we here applied integrated proteomic and metabolomic approaches to fruits from Italian persimmon ecotypes with the aim to characterize plant phenotypic diversity at molecular level. We identified 2255 proteins in fruits, assigning 102 differentially represented components between cultivars, including some related to pomological, nutritional and allergenic characteristics. Thirty-three polyphenols were also identified and quantified, which belong to hydroxybenzoic acid, flavanol, hydroxycinnamic acid, flavonol, flavanone and dihydrochalcone sub-classes. Heat-map representation of quantitative proteomic and metabolomic results highlighted compound representation differences in various accessions, whose elaboration through Euclidean distance functions and other linkage methods defined dendrograms establishing phenotypic relationships between cultivars. Principal component analysis of proteomic and metabolomic data provided clear information on phenotypic differences/similarities between persimmon accessions. Coherent cultivar association results were observed between proteomic and metabolomic data, emphasizing the utility of integrating combined omic approaches to identify and validate phenotypic relationships between ecotypes, and to estimate corresponding variability and distance. Accordingly, this study describes an original, combined approach to outline phenotypic signatures in persimmon cultivars, which may be used for a further characterization of other ecotypes of the same species and an improved description of nutritional characteristics of corresponding fruits.
Keywords: biodiversity; fruit; metabolomics; persimmon (Diospyros kaki Thunb.); phenotypic relationships; proteomics.
Copyright © 2023 De Pascale, Troise, Petriccione, Nunziata, Cice, Magri, Salzano and Scaloni.
Conflict of interest statement
The authors declare that the research was conducted in the absence of any commercial or financial relationships that could be construed as a potential conflict of interest.
Figures


Similar articles
-
Proteo-metabolomic analysis of fruits reveals molecular insights into variations among Italian Sweet Cherry (Prunus avium L.) accessions.Front Plant Sci. 2025 Jun 3;16:1591996. doi: 10.3389/fpls.2025.1591996. eCollection 2025. Front Plant Sci. 2025. PMID: 40530268 Free PMC article.
-
1H HR-MAS NMR-based metabolomics study of different persimmon cultivars (Diospyros kaki) during fruit development.Food Chem. 2018 Jan 15;239:511-519. doi: 10.1016/j.foodchem.2017.06.133. Epub 2017 Jun 23. Food Chem. 2018. PMID: 28873598
-
1H NMR and antioxidant profiles of polar and non-polar extracts of persimmon (Diospyros kaki L.) - Metabolomics study based on cultivars and origins.Talanta. 2018 Jul 1;184:277-286. doi: 10.1016/j.talanta.2018.02.084. Epub 2018 Feb 23. Talanta. 2018. PMID: 29674043
-
Persimmon (Diospyros kaki L.) leaves: a review on traditional uses, phytochemistry and pharmacological properties.J Ethnopharmacol. 2015 Apr 2;163:229-40. doi: 10.1016/j.jep.2015.01.007. Epub 2015 Jan 28. J Ethnopharmacol. 2015. PMID: 25637828 Review.
-
Persimmon (Diospyros kaki) fruit: hidden phytochemicals and health claims.EXCLI J. 2015 May 4;14:542-61. doi: 10.17179/excli2015-159. eCollection 2015. EXCLI J. 2015. PMID: 27047315 Free PMC article. Review.
Cited by
-
Proteo-metabolomic analysis of fruits reveals molecular insights into variations among Italian Sweet Cherry (Prunus avium L.) accessions.Front Plant Sci. 2025 Jun 3;16:1591996. doi: 10.3389/fpls.2025.1591996. eCollection 2025. Front Plant Sci. 2025. PMID: 40530268 Free PMC article.
References
-
- Akagi T., Ikegami A., Suzuki Y., Yoshida J., Yamada M., Sato A., et al. . (2009). Expression balances of structural genes in shikimate and flavonoid biosynthesis cause a difference in proanthocyanidin accumulation in persimmon (Diospyros kaki thunb.) fruit. Planta 230 (5), 899–915. doi: 10.1007/s00425-009-0991-6 - DOI - PubMed
-
- Ancillotti C., Orlandini S., Ciofi L., Pasquini B., Caprini C., Droandi C., et al. . (2018). Quality by design compliant strategy for the development of a liquid chromatography-tandem mass spectrometry method for the determination of selected polyphenols in Diospyros kaki . J. Chromatogr. A 1569, 79–90. doi: 10.1016/j.chroma.2018.07.046 - DOI - PubMed
LinkOut - more resources
Full Text Sources
Molecular Biology Databases