. 2023 Aug 1;108(8):2130-2145.
doi: 10.3324/haematol.2022.282049.

ANKRD26 is a new regulator of type I cytokine receptor signaling in normal and pathological hematopoiesis

Affiliations

ANKRD26 is a new regulator of type I cytokine receptor signaling in normal and pathological hematopoiesis

Francesca Basso-Valentina et al. Haematologica. .

Abstract

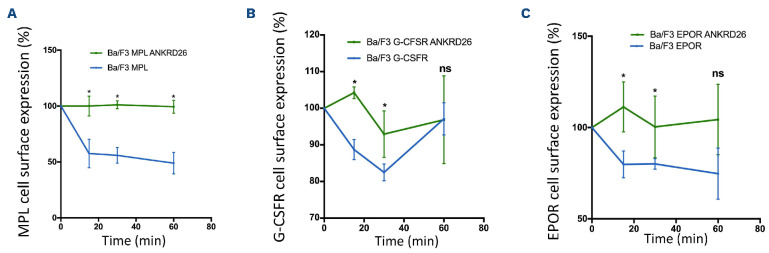
Sustained ANKRD26 expression associated with germline ANKRD26 mutations causes thrombocytopenia 2 (THC2), an inherited platelet disorder associated with a predisposition to leukemia. Some patients also present with erythrocytosis and/or leukocytosis. Using multiple human-relevant in vitro models (cell lines, primary patients' cells and patient-derived induced pluripotent stem cells) we demonstrate for the first time that ANKRD26 is expressed during the early steps of erythroid, megakaryocyte and granulocyte differentiation, and is necessary for progenitor cell proliferation. As differentiation progresses, ANKRD26 expression is progressively silenced, to complete the cellular maturation of the three myeloid lineages. In primary cells, abnormal ANKRD26 expression in committed progenitors directly affects the proliferation/differentiation balance for the three cell types. We show that ANKRD26 interacts with and crucially modulates the activity of MPL, EPOR and G-CSFR, three homodimeric type I cytokine receptors that regulate blood cell production. Higher than normal levels of ANKRD26 prevent the receptor internalization that leads to increased signaling and cytokine hypersensitivity. These findings afford evidence how ANKRD26 overexpression or the absence of its silencing during differentiation is responsible for myeloid blood cell abnormalities in patients with THC2.


Figures

Figure 1.
Figure 1.
ANKRD26 overexpression alters late but not early stages of megakaryopoiesis. (A, B) Primary CD34+ cells were transduced with empty lentivirus (EV) or lentivirus encoding ANKRD26_V5 (ANKRD26) and Cherry. CD34+-Cherry cells were sorted at day 2 after transduction and cultured in semi-solid medium (fibrin clot medium) in the presence of stem cell factor (SCF) and thrombopoietin (TPO). Colonies derived from megakaryocyte progenitors were assessed by anti-CD41 antibody labeling. (A) Plating efficiency of mega-karyocyte progenitors (CFU-MK) was only slightly increased after ANKRD26 overexpression in the presence of 10 ng/mL TPO. (B) The proliferative rate of CFU-MK was not affected by increased ANKRD26 level. Proliferation was assessed according to the size of the colonies (three types of colonies were scored: <20 cells/colony, <50 cells/colony and >50 cells/colony), each colony corresponding to one progenitor. The averages of three independent experiments are shown as the mean ± standard error of mean. **P<0.01; paired t test, ns: non-significant. (C, D) Primary CD34+ cells were transduced with EV or lentivirus encoding ANKRD26_V5 (ANKRD26) and a gene resistant to hygromycin B. ANKRD26 overexpression in primary CD34+ cells cultured in the presence of SCF and TPO and hygromycin B prevented proplatelet formation, evaluated by inverted light microscopy at day 14 of culture. (C) Representative pictures of one experiment are shown. (D) The histogram represents the averages of five independent experiments as mean ± standard deviation. ***P<0.005; paired t test. MK: megakaryocytes.
Figure 2.
Figure 2.
ANKRD26 is necessary for early but not late stages of megakaryopoiesis. (A-F) CD34+ cells were transduced with shSCR or shANK and GFP encoding lentiviruses, sorted 2 days after transduction and cultured in semi-solid medium (fibrin clot medium) in the presence of stem cell factor (SCF) and thrombopoietin (TPO) (A, B) or in liquid medium (C-F). (A, B) Colonies derived from megakaryocyte progenitors were assessed by anti-CD41 antibody. (A) Plating efficiency of megakaryocyte progenitors (CFU-MK) was decreased after inhibition of ANKRD26 (shANK), in the presence of different TPO doses. (B) The proliferation rate of megakaryocyte progenitors was decreased after ANKRD26 inhibition, as shown by the increase of colonies composed of less than 20 cells and the decrease of those with more than 50 cells. The averages of three independent experiments are shown as the mean ± standard error of mean. *P<0.05; **P<0.01; ns: non-significant; paired t test. (C) The inhibition of ANKRD26 led to a decreased frequency of megakaryocytes (CD41+CD42+ cells) at day 10 of culture. (D-F). In contrast, an increase in the ploidy level (D) and in the percentage of proplatelet-forming megakaryocytes was detected after ANKRD26 inhibition (E, F). (E) Representative pictures of one experiment are shown. (C, D, F) The histograms represent the averages of three (D), four (C) or six (F) independent experiments as the mean ± standard deviation, *P<0.05; ****P<0.001, paired t test. All the ANKRD26 inhibition experiments were performed at least twice with shANK_1 and once with shANK_2. MK: megakaryocytes.
Figure 3.
Figure 3.
ANKRD26 regulates early stages of granulopoiesis. Primary CD34+ cells obtained from peripheral blood of patients with thrombocytopenia 2 with different 5’ untranslated region mutations were induced to granulocytic differentiation in the presence of granulocyte colony-stimulating factor (G-CSF), interleukin-3 (IL-3) and stem cell factor (SCF). (A) ANKRD26 expression in patients’ CD34+ cells [P] was similar to that in control CD34+ cells [C] obtained from healthy individuals, but increased during in vitro granulocytic differentiation, with a peak at day 8 of culture. ANKRD26 transcript level was normalized to PPIA. Averages are shown for four (for CD34+ cells) and two (for granulocytic differentiation) independent experiments. (B) The number of patients’ myeloid progenitors (CFU-G) was significantly higher, compared to control progenitors, as assessed by a methylcellulose assay. The averages of five independent experiments are shown as mean ± standard error of mean. *P<0.05; t test with Mann-Whitney correction. (C) Proliferation assay performed in liquid culture supplemented with G-CSF, SCF and IL-3 showed a significant increase in cell number for patients’ samples at days 11 and 14 of culture. The cell count was normalized to day 0. Averages of three independent experiments are shown as mean ± standard error of mean, *P<0.05; **P<0.01; paired t test. (D) May-Grünwald Giemsa staining of samples from two patients and one control at day 15 of culture showed an increase in the proportion of immature cells (myeloblasts, promyelocytes and myelocytes) and a decrease in the proportion of more mature cells (metamyelocytes and polynuclear neutrophils). (E, F) Effect of ANKRD26 inhibition on the granulocytic lineage. CD34+ cells were transduced with lentiviruses encoding shSCR and shANK (shANK_1 or shANK_2, respectively). (E) CD34+-GFP cells were sorted 2 days after transduction and grown in semi-solid medium (methylcellulose) in the presence of 25 ng/mL SCF and different doses of G-CSF. Granulocytic progenitors (CFU-G) were enumerated at day 14 of culture. (F) CD34+-GFP cells were sorted 2 days after transduction and grown in liquid medium in the presence of 25 ng/mL SCF, 10 ng/mL IL-3 and 20 ng/mL G-CSF. Proliferation assays showed a significant decrease in shANK transduced cell number at days 7, 11, 14 and 18. The averages of three independent experiments are shown as mean ± standard error of mean, *P<0.05; **P<0.01; paired t test. PNN: polynuclear neutrophils.
Figure 4.
Figure 4.
Increased ANKRD26 expression level enhances proliferation of granulocyte progenitors in a model of induced pluripotent stem cells, through an enhanced JAK/STAT pathway. CD34+CD43+ progenitors derived from induced pluripotent stem cells (iPSC) from patients [ANK] and controls [C] were differentiated into granulocytes in the presence of granulocyte colony-stimulating factor (G-CSF), interleukin-3 (IL-3) and stem cell factor (SCF). (A) ANKRD26 expression in CD34+CD43+ progenitors (n=4) and in CD11b+CD15+CD14- cells (n=6) derived from patients’ iPSC was increased when compared to that in controls. ANKRD26 transcript was normalized to PPIA. Results are shown as mean ± standard deviation, *P<0.05; **P<0.01; paired t test. (B) The number of patients’ granulocytic progenitors (CFU-G) derived from iPSC was significantly higher than the control, as assessed by methylcellulose assay. The averages of seven independent experiments are shown as mean ± standard deviation. **P<0.01; paired t test. (C) The proliferation rate was significantly increased at days 17, 20 and 22 of culture for patients’ cells as compared to controls. The averages of four independent experiments are shown as the mean ± standard error of mean. *P<0.05; paired t test. (D) CD11b+CD15+CD14- cell frequency analyzed at days 21-23 reflected a delay in maturation for patients’ cells. Averages of 14 experiments for controls and ten for patients’ cells are shown as the mean ± standard error of mean. ***P<0.005, unpaired t test. (E) An RNA-sequencing assay was performed on CD43+CD11b+CD14- progenitors sorted at day 16 of culture. Seven downregulated and 24 upregulated genes in patients’ cells (n=3 for each, ANK1 and ANK2) (P<1x10⁻⁵) were identified compared to controls (n=1 for C1 and C3, n=3 for C2). (F) Gene set enrichment analysis for the KEGG_JAK_STAT_signaling pathway and for the receptor signaling pathway via STAT (GO:0007259, GOBP_RECEPTOR_SIGNAL-ING_PATHWAY_VIA_STAT) in ANK versus control iPSC. NES: normalized enrichment score; FDR: false discovery rate.
Figure 5.
Figure 5.
ANKRD26 regulates the early stage of erythropoiesis. (A, B) CD34+ cells were transduced with lentiviruses encoding shSCR or shANK and erythroid progenitors (BFU-E) were grown in semi-solid medium (methylcellulose) in the presence of 25 ng/mL stem cell factor (SCF) and different doses of erythropoietin (EPO) and enumerated at day 14 of culture. (A) ANKRD26 inhibition led to a significant decrease in BFU-E number. Averages of three independent experiments are shown as the mean ± standard deviation. *P<0.05; one-tailed t test with Mann-Whitney correction. (B) Representative pictures of BFU-E colonies showing that ANKRD26 inhibition led to a lack of hemoglobinization of BFU-E-derived colonies, both at 0.1 and 0.01 U/mL of EPO. (C-F) Transduced CD34+ cells (C-E) or primary patients’ CD34+ progenitors (F) were cultured in liquid medium in the presence of EPO (1 U/mL), SCF and interleukin-3 for 18 days. (C, D) Kinetics of erythroid differentiation assessed by fluorescence activated cell sorting (C) showed that ANKRD26 inhibition leads to a delay in differentiation (D). CD36-GPA- cells represent immature, CD36+GPA+ intermediate and CD36-GPA+ mature erythroid cells. Statistical analysis of different populations is shown as the average of three independent experiments (mean ± standard deviation, *P<0.05, ***P<0.005, 2-way analysis of variance with multiple comparisons). (E, F) ANKRD26 expression level affected proliferation of CD34+ cells grown in erythroid conditions. (E) Inhibition of ANKRD26 led to a significant decrease in the proliferation of transduced CD34+ cells cultured in erythroid conditions. The average of three independent experiments is shown as mean ± standard deviation, *P<0.05; paired t test. (F) Proliferation rate of primary CD34+ cells from patients with thrombocytopenia 2 cultured in erythroid conditions was significantly higher compared to controls. The average of three independent experiments is shown as mean ± standard deviation, *P<0.05; t test with Mann-Whitney correction. D: day; GPA: glycophorin A.
Figure 6.
Figure 6.
ANKRD26 regulates MPL-mediated signaling. UT7 or Ba/F3 cell lines expressing MPL were transduced with lentiviruses harboring control scramble shRNA (shSCR), shANKRD26 (shANK), ANKRD26 cDNA or empty vector (EV). (A, B) Downregulation (A) or upregulation (B) of ANKRD26 expression level did not affect the expression of MPL measured with anti-MPL antibody. The receptor levels are presented as median fluorescence intensity at the cell surface. The averages of three independent experiments are shown as mean ± standard deviation (2 with shANK1_1 and 1 with shANK_2). **P<0.01; ****P<0.001; ns: non-significant, t test with Mann-Whitney correction. (C, D) One of at least three independent western blot (WB) analyses on signaling proteins in Ba/F3 and UT7 cells, at different times after stimulation with 10 ng/mL of thrombopoietin (TPO) (C), and different TPO doses (D) at 10 min. The histograms show quantification of the WB representing averages of three or four independent experiments as mean ± standard deviation. *P<0.05; **P<0.01; ***P<0.005; paired t test. (E, F) Number of UT7/MPL (E) and Ba/F3_MPL (F) cells measured at day 4 of culture, with three different doses of TPO are shown as mean ± standard error of mean of three independent experiments, *P<0.05, **P<0.01; ns: non-significant, t test with Mann-Whitney correction. APC: allophycocyanin; MFI: median fluorescence intensity, PE: phycoerythrin; NS: not stimulated.
Figure 7.
Figure 7.
ANKRD26 interacts with homodimeric type I receptors. (A-C) Co-immunoprecipitation assay performed in HEK293 cells showing the presence of ANKRD26 and MPL (A), ANKRD26 and G-CSFR (B), and ANKRD26 and EPOR (C) in the same protein complex. For each receptor, one of three independent experiments with similar results are shown. Input represents western blot analysis of cells expressing empty vectors or cells co-expressing ANKRD26_V5 and HA_MPL (A), ANKRD26_V5 and HA_G-CSFR (B), or ANKRD26_V5 and HA_EPOR (C). The antibodies used were anti-V5 (for ANKRD26_V5), anti-MPL (for HA-MPL), and anti-HA (for HA-G-CSFR and HA-EPOR). (D-F) Proximity ligation assay for the ANKRD26 and MPL interaction. FLAG_ANKRD26 (ANK), HA_MPL (MPL) and JAK2 were overexpressed in γ2A cells (cells not expressing endogenous Jak2). Monoclonal anti-FLAG antibody was used for ANKRD26 and polyclonal anti-HA for MPL. (D) Representative pictures of the proximity ligation assay for the ANKRD26 and MPL interaction. The red staining represents the ANKRD26/MPL interaction, scale bar = 30 μM. (E) Data represent the mean of two independent experiments. (F) Data represent the number of dots per positive cell. At least 40 positive cells were analyzed for each condition. ***P<0.005, ****P<0.001, t test with Mann-Whitney correction. IP: immunoprecipitation, IB: immunoblot.
Figure 8.
Figure 8.
ANKRD26 regulates the internalization of homodimeric type I receptors. (A-C) Ba/F3 cells overexpressing the three receptors (MPL, G-CSFR, and EPOR) and transduced with either an empty vector or ANKRD26 cDNA encoding lentivirus were used for internalization assays. Internalization of MPL was measured with anti-MPL antibody (A), and that of G-CSFR (B) and EPOR (C) with anti-HA antibody. (A) In the absence of ANKRD26 overexpression, almost 50% of cell surface MPL was internalized as soon as 15 min after the addition of thrombopoietin, while in the presence of ANKRD26, MPL was not internalized. Mean fluorescence intensity (MFI) is normalized to that of Ba/F3/HA_MPL cells expressing empty vector. (B) ANKRD26 overexpression inhibited G-CSFR internalization at 15 and 30 min after stimulation of starved Ba/F3 cells with 20 ng/mL G-CSF. MFI is normalized to that of Ba/F3/HA_GCSFR cells expressing empty vector. (C) ANKRD26 overexpression significantly inhibited EPOR internalization at 15 and 30 min after starved Ba/F3 cell stimulation with 1 U/mL of EPO. MFI is normalized to that of Ba/F3/HA_EPOR cells expressing empty vector. The averages of three independent experiments are shown as mean ± standard deviation. *P<0.05; unpaired t test with Mann-Whitney correction.

References

    1. Lee Y, Ise T, Ha D, et al. . Evolution and expression of chimeric POTE-actin genes in the human genome. Proc Natl Acad Sci U S A. 2006;103(47):17885-17890. - PMC - PubMed
    1. Liu XF, Bera TK, Liu LJ, Pastan I. A primate-specific POTE-actin fusion protein plays a role in apoptosis. Apoptosis. 2009;14(10):1237-1244. - PMC - PubMed
    1. Djinovic-Carugo K, Gautel M, Ylänne J, Young P. The spectrin repeat: a structural platform for cytoskeletal protein assemblies. FEBS Lett. 2002;513(1):119-123. - PubMed
    1. Mosavi LK, Cammett TJ, Desrosiers DC, Peng ZY. The ankyrin repeat as molecular architecture for protein recognition. Protein Sci. 2004;13(6):1435-1448. - PMC - PubMed
    1. Hahn Y, Bera TK, Pastan IH, Lee B. Duplication and extensive remodeling shaped POTE family genes encoding proteins containing ankyrin repeat and coiled coil domains. Gene. 2006;366(2):238-245. - PubMed

Publication types

Substances

Supplementary concepts

LinkOut - more resources