. 2023 Aug 1;108(8):2178-2191.
doi: 10.3324/haematol.2022.281510.

Integrated genetic and clinical prognostic factors for aggressive adult T-cell leukemia/lymphoma

Affiliations

Integrated genetic and clinical prognostic factors for aggressive adult T-cell leukemia/lymphoma

Takuro Kameda et al. Haematologica. .

Abstract

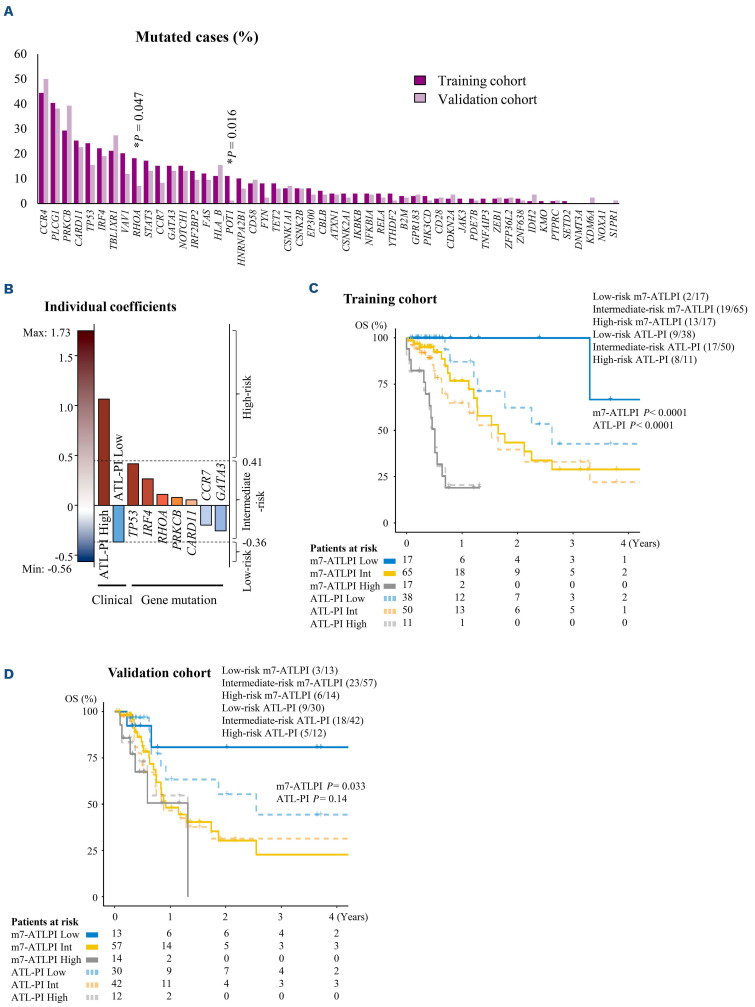
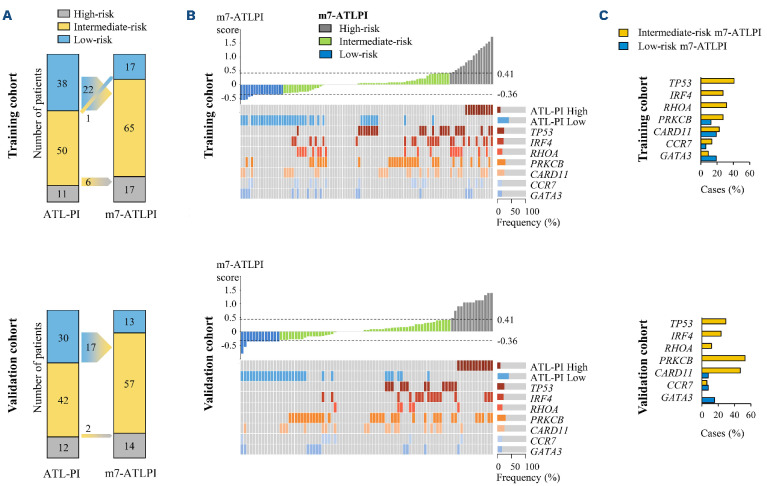
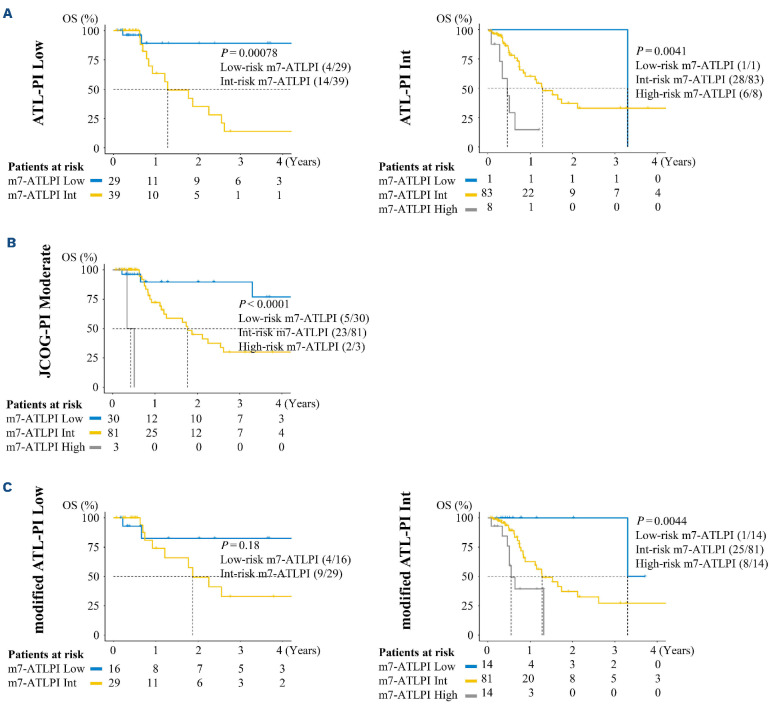
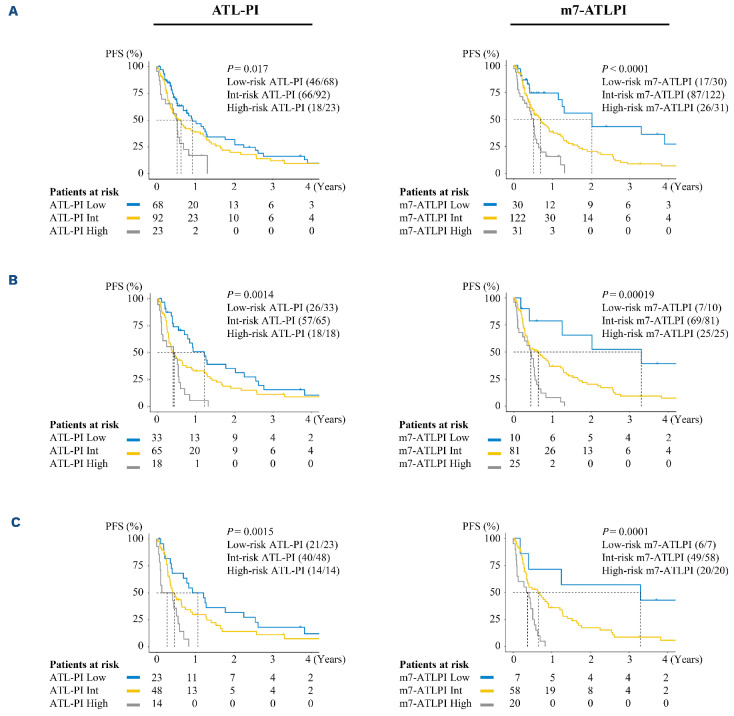
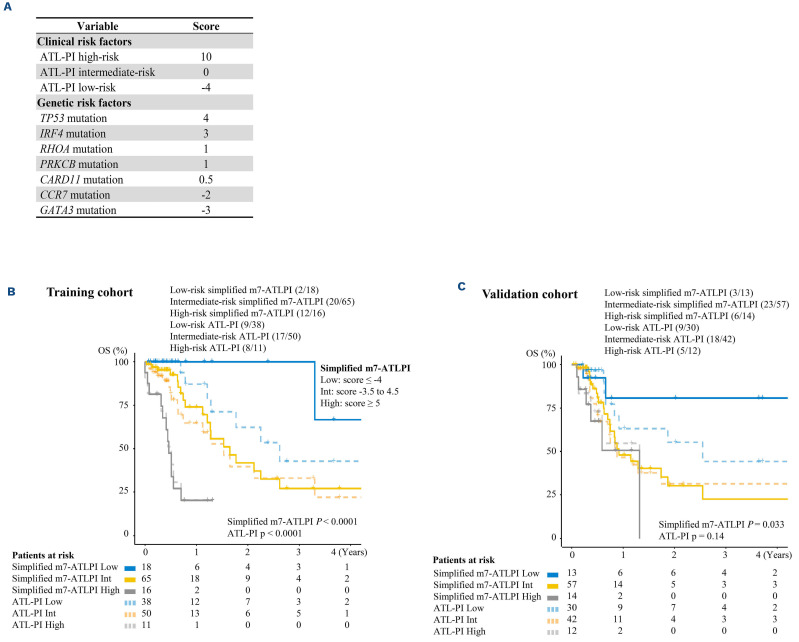
The prognosis of aggressive adult T-cell leukemia/lymphoma (ATL) is poor, and allogeneic hematopoietic stem cell transplantation (allo-HSCT) is a curative treatment. In order to identify favorable prognostic patients after intensive chemotherapy, and who therefore might not require upfront allo-HSCT, we aimed to improve risk stratification of aggressive ATL patients aged <70 years. The clinical risk factors and genetic mutations were incorporated into risk modeling for overall survival (OS). We generated the m7-ATLPI, a clinicogenetic risk model for OS, that included the ATL prognostic index (PI) (ATL-PI) risk category, and non-silent mutations in seven genes, namely TP53, IRF4, RHOA, PRKCB, CARD11, CCR7, and GATA3. In the training cohort of 99 patients, the m7-ATLPI identified a low-, intermediate-, and highrisk group with 2-year OS of 100%, 43%, and 19%, respectively (hazard ratio [HR] =5.46; P<0.0001). The m7-ATLPI achieved superior risk stratification compared to the current ATL-PI (C-index 0.92 vs. 0.85, respectively). In the validation cohort of 84 patients, the m7-ATLPI defined low-, intermediate-, and high-risk groups with a 2-year OS of 81%, 30%, and 0%, respectively (HR=2.33; P=0.0094), and the model again outperformed the ATL-PI (C-index 0.72 vs. 0.70, respectively). The simplified m7-ATLPI, which is easier to use in clinical practice, achieved superior risk stratification compared to the ATLPI, as did the original m7-ATLPI; the simplified version was calculated by summing the following: high-risk ATL-PI category (+10), low-risk ATL-PI category (-4), and non-silent mutations in TP53 (+4), IRF4 (+3), RHOA (+1), PRKCB (+1), CARD11 (+0.5), CCR7 (-2), and GATA3 (-3).


Figures

Figure 1.
Figure 1.
The m7-ATLPI clinicogenetic risk model. (A) Mutation frequencies of recurrent mutant genes in adult T-cell leukemia/lymphoma (ATL) in training and validation cohorts. P values were determined by Fisher’s exact test without correction for multiple testing. Detailed mutation plots for both cohorts are shown in the Online Supplementary Table S2 and the Online Supplementary Figure S6. (B) The m7-adult T-cell leukemia/lymphoma prognostic index (ATLPI) is calculated as the sum of individual clinical and gene mutation predictor values weighted by their individual coefficients. (C) Kaplan-Meier overall survival (OS) curves for the training cohort by ATL-PI and by m7-ATLPI. (D) Kaplan-Meier OS curves for the validation cohort by ATL-PI and by m7-ATLPI. Numbers in parentheses show number of patients with events/number of patients per cohort. ATL-PI low/int/high: low-, intermediate-, or high-risk ATLPI; m7-ATLPI low/int/high: low-, intermediate-, or high-risk m7-ATLPI.
Figure 2.
Figure 2.
Reclassification of risk categories by m7-ATLPI. (A) Transitions in the distribution of risk categories following the change from the adult T-cell leukemia/lymphoma prognostic index (ATL-PI) to the m7-ATLPI, for both the training and validation cohorts. (B) m7-ATLPI scores for patients in the training and validation cohorts, along with clinical predictors (ATL-PI categories) and molecular predictors. Boxes indicate high- or low-risk ATL-PI categories, or mutations in the indicated genes, and the color codes indicate the coefficients of the individual m7-ATLPI predictors. The corresponding Kaplan-Meier overall survival (OS) curves for patients classified as low-risk by the ATL-PI and then reclassified by the m7-ATLPI are shown in Figure 3A. (C) Relative frequencies of molecular predictors by m7-ATLPI category in low-risk ATL-PI patients in the training and validation cohorts.
Figure 3.
Figure 3.
m7-ATLPI segregates patients with favorable prognosis from among low- or intermediate-risk patients defined by ATL prognostic models based on clinical parameters. (A) Kaplan-Meier overall survival (OS) curves stratified by the m7-adult T-cell leukemia/lymphoma prognostic index (m7-ATLPI) for patients in the entire cohort (training and validation cohorts) who were classified as low risk or intermediate risk by the ATL-PI. (B) Kaplan-Meier OS curves stratified by the m7-ATLPI for patients in the entire cohort who were classified as moderate risk by the Japan Clinical Oncology Group prognostic index. (C) Kaplan-Meier OS curves stratified by the m7-ATLPI for patients in the entire cohort who were classified as low risk or intermediate risk by the modified ATL-PI. Numbers in parentheses show the number of patients with events/number of patients per cohort.
Figure 4.
Figure 4.
The m7-ATLPI provides beter risk stratification of progression-free survival than the ATL-PI. (A) Kaplan-Meier progression-free survival (PFS) curves by the adult T-cell leukemia/lymphoma prognostic index (ATL-PI) and m7-ATLPI for the entire cohort (n=183). (B) Kaplan-Meier PFS curves by the ATL-PI and m7-ATLPI for patients without allogenic hematopoietic stem cell transplantation (allo-HSCT) in the entire cohort (n=116). (C) Kaplan-Meier PFS curves by the ATL-PI and m7-ATLPI for patients with neither allo-HSCT nor mogamulizumab therapy in the entire cohort (n=85).
Figure 5.
Figure 5.
The simplified m7-ATLPI has comparable prognostic ability as the original m7-ATLPI. (A) Scoring of the simplified m7-adult T-ceLL leukemia/lymphoma prognostic index (m7-ATLPI). In order to create the simplified m7-ATLPI, the coefficients of the ATL-PI categories and mutation status of the 7 genes were converted to numbers reflecting their original values. After summing these values, scores <-4, -3.5 to 4.5, and >5 points were categorized as low-, intermediate-, and high-risk simplified m7-ATLPI, respectively. (B) Kaplan-Meier overall survival (OS) curves for the training cohort using the ATL-PI and simplified m7-ATLPI. (C) Kaplan-Meier OS curves for the validation cohort using the ATL-PI and simplified m7-ATLPI. Numbers in parentheses show the number of patients with events/number of patients per cohort. ATL-PI low/int/high: low-, intermediate-, or high-risk ATL-PI; Simplified m7-ATLPI low/int/high: low-, intermediate-, or high-risk simplified m7-ATLPI.

References

    1. Uchiyama T, Yodoi J, Sagawa K, et al. . Adult T-cell leukemia: clinical and hematologic features of 16 cases. Blood. 1977;50(3):481-492. - PubMed
    1. Shimoyama M. Diagnostic criteria and classification of clinical subtypes of adult T-cell leukaemia-lymphoma. A report from the Lymphoma Study Group (1984-87). Br J Haematol. 1991;79(3):428-437. - PubMed
    1. Shimoyama M. Chemotherapy of ATL. K Takatsuki (Ed), Adult T-Cell Leukemia, Oxford University Press. Oxford. 1994:221-227.
    1. Cook LB, Fuji S, Hermine O, et al. . Revised Adult T-cell Leukemia-Lymphoma International Consensus Meeting Report. J Clin Oncol. 2019;37(8):677-687. - PMC - PubMed
    1. Tsukasaki K, Utsunomiya A, Fukuda H, et al. . VCAP-AMP-VECP compared with biweekly CHOP for adult T-cell leukemia-lymphoma: Japan Clinical Oncology Group Study JCOG9801. J Clin Oncol. 2007;25(34):5458-5464. - PubMed

Publication types

Substances