

METTL14 modulates glycolysis to inhibit colorectal tumorigenesis in p53-wild-type cells
- PMID: 36794620
- PMCID: PMC10074077
- DOI: 10.15252/embr.202256325
METTL14 modulates glycolysis to inhibit colorectal tumorigenesis in p53-wild-type cells
Abstract
The frequency of p53 mutations in colorectal cancer (CRC) is approximately 40-50%. A variety of therapies are being developed to target tumors expressing mutant p53. However, potential therapeutic targets for CRC expressing wild-type p53 are rare. In this study, we show that METTL14 is transcriptionally activated by wild-type p53 and suppresses tumor growth only in p53-wild-type (p53-WT) CRC cells. METTL14 deletion promotes both AOM/DSS and AOM-induced CRC growth in mouse models with the intestinal epithelial cell-specific knockout of METTL14. Additionally, METTL14 restrains aerobic glycolysis in p53-WT CRC, by repressing SLC2A3 and PGAM1 expression via selectively promoting m6 A-YTHDF2-dependent pri-miR-6769b/pri-miR-499a processing. Biosynthetic mature miR-6769b-3p and miR-499a-3p decrease SLC2A3 and PGAM1 levels, respectively, and suppress malignant phenotypes. Clinically, METTL14 only acts as a beneficial prognosis factor for the overall survival of p53-WT CRC patients. These results uncover a new mechanism for METTL14 inactivation in tumors and, most importantly, reveal that the activation of METTL14 is a critical mechanism for p53-dependent cancer growth inhibition, which could be targeted for therapy in p53-WT CRC.
Keywords: METTL14; aerobic glycolysis; colorectal cancer; m6A; wild-type p53.
© 2023 The Authors. Published under the terms of the CC BY 4.0 license.
Conflict of interest statement
The authors declare that they have no conflict of interest.
Figures
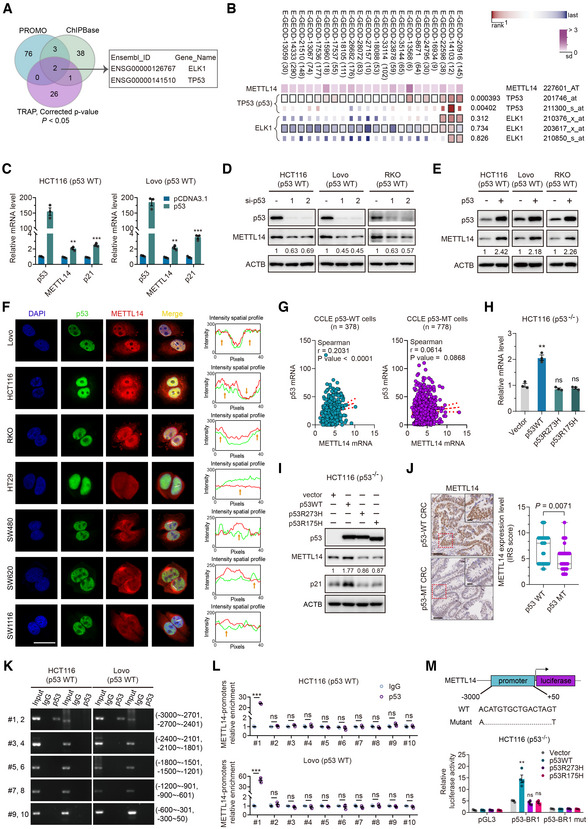
Schematic illustration of screening for transcription factors using ChIPBase (
http://rna.sysu.edu.cn/chipbase3/index.php ), PROMO alggen (http://alggen.lsi.upc.es/cgi‐bin/promo_v3/promo/promoinit.cgi?dirDB=TF_8.3/ ) and TRAP (http://trap.molgen.mpg.de/ ).MEM (
https://biit.cs.ut.ee/mem/ ) identified correlation between ELK1, p53 and METTL14.HCT116 and Lovo cells were transfected with empty vector and p53 plasmid. Forty‐eight hours after transfection, total RNA was then analyzed by qRT–PCR analysis. Data are presented as mean ± SD (biological replicates, n = 3; **P < 0.01, ***P < 0.001).
HCT116, Lovo, and RKO cells were transfected with control or p53 siRNAs. Forty‐eight hours after transfection, total protein was then analyzed by western blot analysis.
HCT116, Lovo, and RKO cells were transfected with empty vector and p53 plasmid. Forty‐eight hours after transfection, total protein was then analyzed by western blot analysis.
Representative immunofluorescence staining of the p53 (green) and METTL14 (red) proteins in p53‐WT HCT116, Lovo, and RKO cells and p53‐MT HT29 (p53R273H), SW480 (p53R273H/P309S), SW620 (p53R273H), and SW1116 (p53A159D) cells. Nuclei were stained with DAPI (blue). Scale bars = 10 μm. The relative mean fluorescence density was analyzed by ImageJ.
Correlation of METTL14 with p53 mRNA levels in p53‐WT and p53‐MT CRC cell lines from CCLE database (
https://sites.broadinstitute.org/ccle ). r is the Spearman's rank correlation coefficient.qRT–PCR analysis of METTL14 levels after transfection with empty vector, wild‐type, or mutant p53 plasmids in HCT116 (p53−/−) cells (biological replicates, n = 3; **P < 0.01, ns = no significance).
Western blot analysis of METTL14 levels after transfection with empty vector, wild‐type, or mutant p53 plasmids in HCT116 (p53−/−) cells.
Representative IHC images, and statistical analysis of immunoreactive score (IRS) of METTL14 expression in p53‐WT (n = 63) and p53‐MT (n = 41) CRC samples. The horizontal lines represent the median; the bottom and top of the boxes represent the 25 and 75% percentiles, respectively; and the vertical bars represent the range of the data. The insets show enlarged images of indicated p53‐WT and p53‐MT CRC tissues, respectively. Scale bars = 20 μm and 2 μm (inset).
ChIP assay verified the potential p53‐binding site in the METTL14 promoter region in HCT116 and Lovo cell lines. Input fractions and IgG were used as controls.
ChIP–qRT–PCR assay verified the potential p53‐binding site in the METTL14 promoter region in HCT116 and Lovo cell lines. IgG was used as a control. Data are presented as mean ± SD (biological replicates, n = 3; ***P < 0.001, ns = no significance).
Luciferase activities of luciferase reporter plasmid containing wild‐type or mutant METTL14 promoter in control, wild‐type p53 or mutant p53‐overexpressing HCT116 (p53−/−) cells. pGL3 and Vector were used as controls. Data are presented as mean ± SD (biological replicates, n = 4; **P < 0.01, ns = no significance).
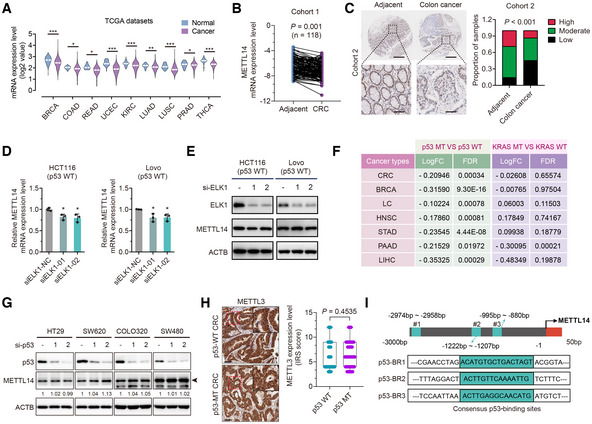
METTL14 mRNA levels between tumor and normal tissues in the TCGA database (*P < 0.05, **P < 0.01, ***P < 0.001). Breast cancer (BRCA—normal tissues n = 113, cancer tissues n = 1,104); colon cancer (COAD—normal tissues n = 41, cancer tissues n = 471); rectal cancer (READ—normal tissues n = 10, cancer tissues n = 167); endometrioid cancer (UCEC—normal tissues n = 35, cancer tissues n = 548); kidney clear cell carcinoma (KIRC—normal tissues n = 72, cancer tissues n = 535); lung adenocarcinoma (LUAD—normal tissues n = 59, cancer tissues n = 526); lung squamous cell carcinoma (LUSC—normal tissues n = 49, cancer tissues n = 501); prostate cancer (PRAD—normal tissues n = 52, cancer tissues n = 499); and thyroid cancer (THCA—normal tissues n = 58, cancer tissues n = 510).
qRT–PCR determination of the METTL14 level in CRC and adjacent normal tissues from Cohort 1 (n = 118).
Representative IHC staining images and statistical analysis of METTL14 in tumor and para‐tumor tissues from Cohort 2 (n = 90). Lower panels show enlarged images of indicated normal or CRC tissues. Scale bars = 200 μm (upper) and 40 μm (lower).
qRT–PCR analysis of the mRNA levels of METTL14 after transfection with control or ELK1 siRNAs with 48 h treatment in HCT116 and Lovo cells. Data are presented as mean ± SD (biological replicates, n = 3; *P < 0.05).
Western blot analysis of METTL14 and ELK1 protein levels after transfection with control or ELK1 siRNAs with 48 h treatment in HCT116 and Lovo cells.
Expression analysis of METTL14 in p53‐WT and p53‐MT or KRAS‐WT and KRAS‐MT tumor tissues from in TCGA. Lung Cancer (LC); Head and Neck Cancer (HNSC); Stomach Cancer (STAD); Liver Cancer (LIHC) and Pancreatic Cancer (PAAD).
HT29 (p53R273H), SW620 (p53R273H), COLO320 (p53R248W) and SW480 (p53R273H/P309S) cells were transfected with control or p53 siRNAs. Forty‐eight hours after transfection, total protein was then analyzed by western blot analysis. Arrows indicate METTL14 protein.
Representative IHC images, and statistical analysis of immunoreactive score (IRS) of METTL3 expression in p53‐WT (n = 63) and p53‐MT (n = 41) CRC samples from Cohort 3. The insets show enlarged images of indicated p53‐WT and p53‐MT CRC tissues, respectively. Scale bars = 20 μm and 2 μm (inset). The horizontal lines represent the median; the bottom and top of the boxes represent the 25 and 75% percentiles, respectively, and the vertical bars represent the range of the data.
Schematic illustration of putative p53‐binding site in METTL14 gene promoter.
- A
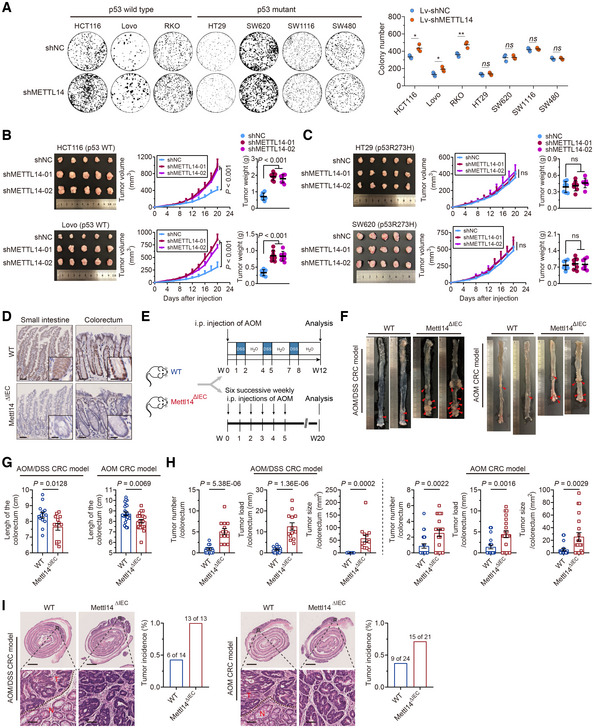
Colony formation assay of p53‐WT (HCT116, Lovo, and RKO) and p53‐MT (HT29, SW620, SW1116, and SW480) cells stably infected with shNC or shMETTL14. Data are presented as mean ± SD (biological replicates, n = 3; *P < 0.05, **P < 0.01, ns = no significance).
- B, C
Representative images and analysis of tumors in nude mice bearing stably transfected shNC or shMETTL14 p53‐WT (HCT116 and Lovo) and p53‐MT (HT29 and SW620) cells. Data are presented as mean ± SD (biological replicates, n = 7, ns = no significance).
- D
Representative IHC staining images of METTL14 in Mettl14WT and Mettl14ΔIEC mice. The insets show enlarged images of small intestine tissues and colorectal tissues, respectively. Scale bars = 50 μm and 5 μm (inset).
- E
Schematic diagrams of AOM/DSS‐induced and AOM‐induced CRC models. i.p., intraperitoneal.
- F
Colorectum was opened longitudinally, and two representative colorectal images derived from METTL14WT and METTL14ΔIEC mice from AOM/DSS‐induced and AOM‐induced CRC models, respectively.
- G
Comparison of colorectum length between METTL14WT (n = 14, n = 24) and METTL14ΔIEC (n = 13, n = 21) mice from AOM/DSS‐induced and AOM‐induced CRC models, respectively. Data are expressed as mean ± SD.
- H
Comparison of tumor number, tumor load, and tumor size between METTL14WT (n = 14, n = 24) and METTL14ΔIEC (n = 14, n = 24) mice from AOM/DSS‐induced and AOM‐induced CRC models, respectively. Data are expressed as mean ± SD.
- I
Representative HE staining images of colorectum in METTL14WT (n = 14, n = 24) and METTL14ΔIEC (n = 13, n = 21) mice from AOM/DSS‐induced and AOM‐induced CRC models. Lower panels show enlarged images of indicated normal or CRC tissues. Scale bars = 2 mm (upper) and 40 μm (lower). Black dashed line refers to the border of tumor (T) and normal (N) tissues. Tumors are classified as adenomas with low to focal high‐grade dysplasia. The percentages of mice with dysplasia are shown (right).
- A, B
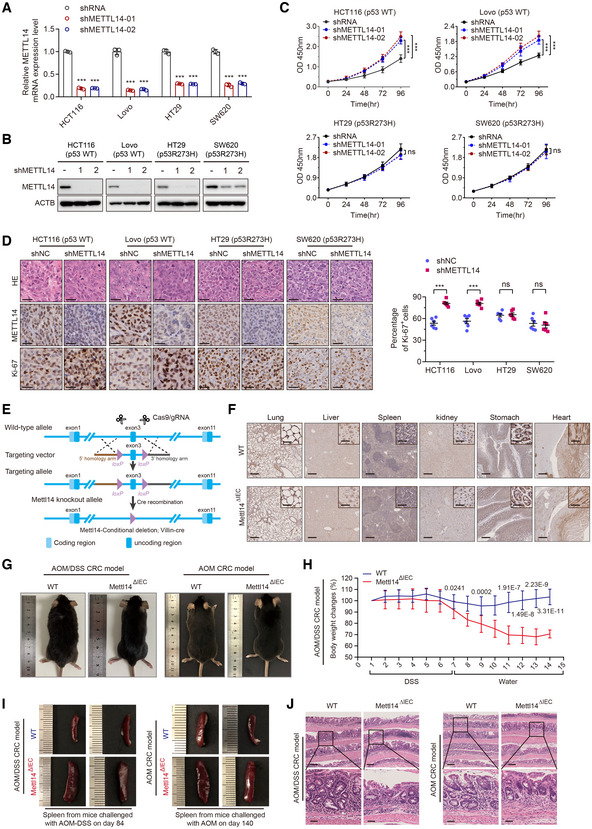
qRT–PCR and Western blot validation of the METTL14 knockdown efficiency by stable transfection with shNC or shMETTL14 in p53‐WT (HCT116 and Lovo) and p53‐MT (HT29 and SW620) cells. Data are presented as mean ± SD (biological replicates n = 3; ***P < 0.001).
- C
Cell viability assay of CRC cells stably transfected with lentivirus carrying control shRNA (shNC) or METTL14 shRNA (shMETTL14) for indicated time (0, 24, 48, and 96 h). Data are presented as mean ± SD (biological replicates, n = 6; ***P < 0.001, ns, no significance).
- D
Representative HE and IHC staining images and quantitative analysis of Ki‐67 in subcutaneous tumors from nude mice in Fig 2B and C. Scale bars = 10 μm. Data are presented as mean ± SD (biological replicates, n = 6; ns = no significance, ***P < 0.001).
- E
Schematic diagrams of generation of Villin‐Cre+/Mettl14FL/FL conditional knockout mice.
- F
Representative IHC staining images of METTL14 in organs other than colorectum, including lung, liver, spleen, kidney, stomach, and heart, from Mettl14ΔIEC (n = 34) and Mettl14WT (n = 38) mice. The insets show enlarged images of indicated tissues. Scale bars = 400 μm and 10 μm (inset).
- G
Gross appearance of Mettl14ΔIEC (n = 13, n = 21) and Mettl14WT (n = 14, n = 24) C57BL/6 mice from AOM/DSS‐induced (Left) and AOM‐induced (Right) CRC model.
- H
The body weight changes during the course of acute colitis with DSS in Mettl14ΔIEC (n = 13) and Mettl14WT (n = 14) mice were recorded and expressed as the ratio relative to the initial weight before DSS treatment. Data are expressed as mean ± SD.
- I
Representative morphology of spleens in Mettl14ΔIEC (n = 13, n = 21) and Mettl14WT (n = 14, n = 24) mice extracted from AOM/DSS‐induced (Left) and AOM‐induced (Right) CRC models.
- J
Representative HE staining images of colorectum of Mettl14ΔIEC (n = 21) and Mettl14WT (n = 24) mice from AOM/DSS‐induced (Left) and AOM‐induced (Right) CRC model, showing representative inflammation. Lower panels show the magnified images of the indicated regions. Scale bars = 400 μm (upper) and 100 μm (lower).
- A
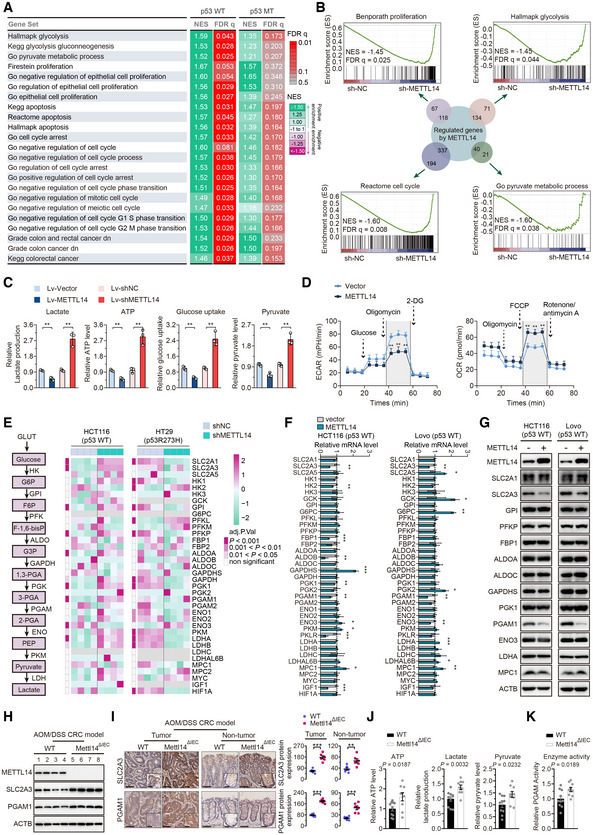
GSEA comparison between patients with METTL14 high expression and METTL14 low expression in p53‐WT and p53‐MT CRC from TCGA CRC dataset, respectively. Positive or negative normalized enrichment scores (NES) correspond to the enrichment of a given set in genes that are up‐ or down‐regulated, respectively, in response to high METTL14 expression. Data are presented as pseudo‐heatmap with NES magnitude color‐coded as indicated in the legend; all light red or nongray comparisons have False Discovery Rate q‐value (FDR q) < 0.05.
- B
Overview of GSEA identified the differential gene profiles between stably transfected shNC (n = 4), shMETTL14‐01 (n = 2), and shMETTL14‐02 (n = 2) HCT116 (p53‐WT) cells, respectively. The sum of the numbers in the small circles of different colors is the total number of genes in each gene sets related to cell proliferation, cell‐cycle, glycolysis, and metabolic process. The number where the two circles intersect is the total number of genes that are both regulated by METTL14 and belong to the gene set related to different signatures.
- C
Lactate production, ATP level, glucose uptake, and pyruvate level in stably transfected Lv‐vector and Lv‐METTL14 or shNC and shMETTL14 HCT116 (p53‐WT) cells. Data are presented as mean ± SD (biological replicates, n = 3; **P < 0.01).
- D
ECAR and OCR in stably transfected Lv‐vector and Lv‐METTL14 HCT116 (p53‐WT) cells. Data are presented as mean ± SD (biological replicates, n = 3; **P < 0.01).
- E
Schematic diagram of aerobic glycolysis pathway (left) and heatmap of crucial glycolytic genes involved in aerobic glycolysis pathway (right). Significantly differentially expressed genes were identified by DESeq2 under the requirement of Adjusted P‐value (adj.P.Val) < 0.05, 0.001 < adj.P.Val < 0.01, or adj.P.Val < 0.001.
- F, G
Glycolytic gene expression in CRC cells transfected with empty vector or METTL14 plasmid for 48 h by qRT–PCR and western blot. Data are presented as mean ± SD (biological replicates, n = 3; *P < 0.05, **P < 0.01, ***P < 0.001).
- H
Western blot analysis of METTL14, SLC2A3, and PGAM1 protein levels of intestinal epithelial cells from AOM/DSS‐induced Mettl14WT (n = 4) and Mettl14ΔIEC (n = 4) and mice.
- I
Representative IHC staining images and quantitative analysis of SLC2A3 and PGAM1 in tumor tissues and nontumor tissues from AOM/DSS‐induced Mettl14ΔIEC and Mettl14WT mice CRC models. The insets show enlarged images of tumor tissues and nontumor tissues, respectively. Scale bars = 40 μm and 4 μm (inset). Data are presented as mean ± SD (biological replicates, n = 6; **P < 0.01, ***P < 0.001).
- J, K
ATP level, lactate production, pyruvate level, and PGAM1 activity in intestinal epithelial cells isolated from AOM/DSS‐induced Mettl14WT (n = 9) and Mettl14ΔIEC (n = 10) mice. Data are presented as mean ± SD.
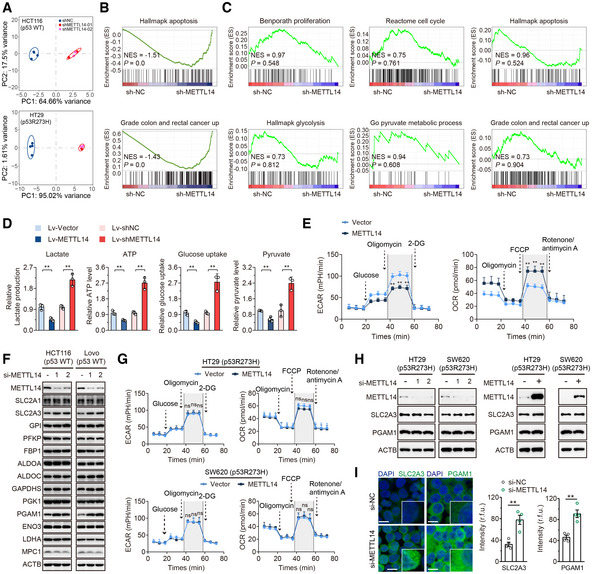
- A
Principal component analysis of gene expression profiles of shNC (n = 4), shMETTL14‐01 (n = 2), and shMETTL14‐02 (n = 2) shRNA‐expressing p53‐WT HCT116 and p53‐MT HT29 cells.
- B, C
Overview of GSEA used to identify the differential gene profiles in HCT116 (p53‐WT) and HT29 (p53‐MT) cells stably transfected with shNC and shMETTL14, respectively.
- D
Lactate production, ATP level, glucose uptake, and pyruvate level were determined in Lovo (p53‐WT) cells stably transfected with Lv‐vector or Lv‐METTL14, or with shNC or shMETTL14. Data are presented as mean ± SD (biological replicates, n = 3; **P < 0.01).
- E
ECAR and OCR were measured in Lovo (p53‐WT) cells stably transfected Lv‐vector or Lv‐METTL14. Data are presented as mean ± SD (biological replicates, n = 3; **P < 0.01).
- F
Western blot analysis of glycolytic gene expression in HCT116 and Lovo (p53‐WT) cells transfected with control siRNA or METTL14 siRNAs for 48 h.
- G
ECAR and OCR were measured in p53‐MT (HT29 and SW620) cells stably transfected with vector or METTL14. Data are presented as mean ± SD (biological replicates, n = 3; ns, no significance).
- H
Western blot analysis of METTL14, SLC2A3, and PGAM1 protein levels in p53‐MT (HT29 and SW620) cells transfected with control siRNA or METTL14 siRNAs, and empty vector or METTL14 plasmid.
- I
Representative immunofluorescence (IF) staining and quantitative analysis of SLC2A3 (green) and PGAM1 (green) proteins in HCT116 (p53‐WT) cells transfected with control or METTL14 siRNA. Nuclei were stained with DAPI (blue). The insets show enlarged images of CRC cells. Scale bars = 10 μm. Data are presented as mean ± SD (biological replicates, n = 4; **P < 0.01).
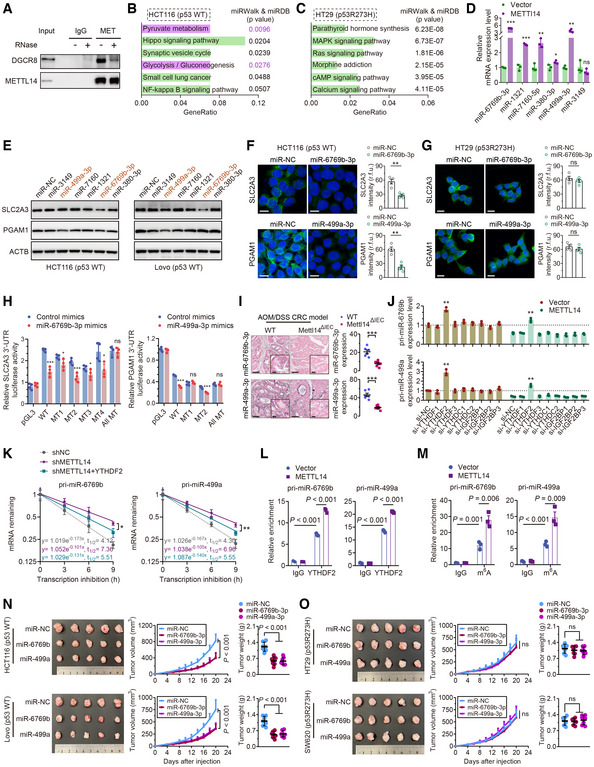
Co‐IP of METTL14 and DGCR8 in HCT116 cells in the presence or absence of ribonuclease.
KEGG enrichment analysis of differential expression of miRNA target genes by miRWalk (
http://mirwalk.umm.uni‐heidelberg.de/ ) and miRDB database (http://mirdb.org/ ) in p53‐WT HCT116 cells.KEGG enrichment analysis of differential expression of miRNA target genes by miRWalk and miRDB database in p53‐MT HT29 cells.
qRT–PCR analysis of the miRNA levels in stably transfected vector and METTL14 HCT116 (p53‐WT) cells. Data are presented as mean ± SD (biological replicates, n = 3; ns = no significance, *P < 0.05, **P < 0.01, ***P < 0.001).
Western blot analysis of SLC2A3 and PGAM1 protein levels in HCT116 and Lovo (p53‐WT) cells transfected with control or miRNA mimics.
Representative IF staining and quantitative analysis of the SLC2A3 (green) and PGAM1 (green) proteins in HCT116 (p53‐WT) cells transfected with control or miRNA mimics. Nuclei were stained with DAPI (blue). Scale bars = 20 μm. Data are presented as mean ± SD (biological replicates, n = 4; **P < 0.01).
Representative IF staining and quantitative analysis of the SLC2A3 (green) and PGAM1 (green) proteins in HT29 (p53‐MT) cells transfected with control or miRNA mimics. Nuclei were stained with DAPI (blue). Scale bars = 20 μm. Data are presented as mean ± SD (biological replicates, n = 4; ns = no significance).
Luciferase activity of reporters expressing wild‐type or mutant SLC2A3 and PGAM1 3′UTRs in HCT116 (p53‐WT) cells transfected with control or miRNA (miR‐6769b‐3p and miR‐499a‐3p) mimics. Data are presented as mean ± SD (biological replicates n = 4; ns = no significance, *P < 0.05, ***P < 0.001).
Representative ISH images and quantitative analysis of miR‐6769b‐3p and miR‐499a‐3p in tumor tissues from AOM/DSS‐induced Mettl14ΔIEC and Mettl14WT mice CRC models. The insets show enlarged images of tumor tissues. Scale bars = 20 μm and 2 μm (inset). Data are presented as mean ± SD (biological replicates, n = 6; ***P < 0.001).
qRT–PCR analysis of the pri‐miR‐6769b and pri‐miR‐499a levels in stably transfected Lv‐vector and Lv‐METTL14 HCT116 cells with control, YTHDF1‐3, YTHDC1‐2 or IGF2BP1‐3 siRNAs. Data are presented as mean ± SD (biological replicates, n = 3; **P < 0.01). The dotted line represents basal mRNA expression of pri‐miR‐6769b and pri‐miR‐499a in HCT116 cells, acting as a control.
RNA stability of pri‐miR‐6769b and pri‐miR‐499a in stably transfected shNC and shMETTL14 HCT116 (p53‐WT) cells with or without YTHDF2 overexpression. The data are presented as mean ± SD (biological replicates, n = 3, *P < 0.05, **P < 0.01).
RIP and qRT–PCR assays detected the enrichment of pri‐miR‐6769b and pri‐miR‐499a to YTHDF2 in stably transfected Lv‐vector and Lv‐METTL14 HCT116 cells. Data are presented as mean ± SD (biological replicates, n = 3).
MeRIP–qPCR assay detected m6A modification on pri‐miR‐6769b and pri‐miR‐499a in stably transfected vector and METTL14 HCT116 cells. Data are presented as mean ± SD (biological replicates, n = 3).
Representative images of tumors and analysis in nude mice intervened with control, miR‐6769b‐3p or miR‐499a‐3p expression p53‐WT (HCT116 and Lovo) cells. Data are presented as mean ± SD (biological replicates, n = 7).
Representative images of tumors and analysis in nude mice intervened with control, miR‐6769b‐3p or miR‐499a‐3p expression p53‐MT (HT29 and SW620) cells. Data are presented as mean ± SD (biological replicates, n = 7, ns, no significance).
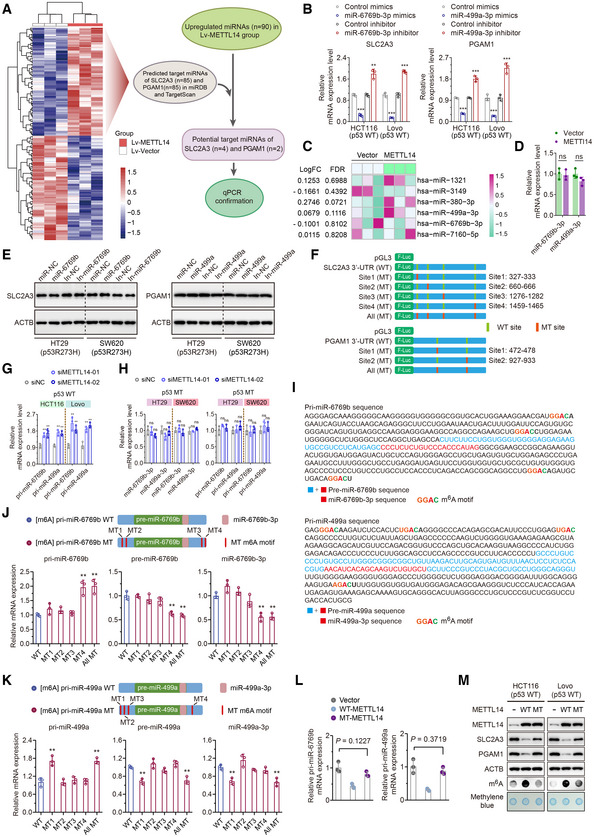
Schematic illustration of the protocol for screening miRNAs that are regulated by METT14 and simultaneously target SLC2A3 and PGAM1 using miRNA Microarray, TargetScan (
http://www.targetscan.org/vert_71/ ) and miRDB (http://mirdb.org/miRDB/ ) database.qRT–PCR analysis of the SLC2A3 and PGAM1 levels in HCT116 and Lovo (p53‐WT) cells transfected with miR‐6769b‐3p and miR‐499a‐3p mimics and corresponding inhibitors. Data are presented as mean ± SD (biological replicates, n = 3; **P < 0.01, ***P < 0.001).
Heatmap of known METTL14 target miRNAs in p53‐WT cells identified by miRNA microarrays using HT29 cells stably infected with lentivirus carrying METTL14 overexpression or control vector.
qRT–PCR analysis of the miR‐6769b‐3p and miR‐499a‐3p levels in stably transfected vector and METTL14 HT29 (p53‐MT) cells. Data are presented as mean ± SD (biological replicates, n = 3; ns = no significance).
Western blot analysis of SLC2A3 and PGAM1 in HT29 and SW620 (p53‐MT) cells transfected with control or miRNA mimics and corresponding inhibitors.
Schematic diagram of luciferase reporters expressing wild‐type or mutant SLC2A3 3′UTRs and wild‐type or mutant PGAM1 3′UTRs predicted by TargetScan and miRDB database.
qRT–PCR was performed to determine the pri‐miR‐6769b and pri‐miR‐499a levels in HCT116 and Lovo (p53‐WT) cells transfected with control siRNA or METTL14 siRNAs for 48 h. Data are presented as mean ± SD (biological replicates, n = 3; **P < 0.01).
qRT–PCR was performed to determine the miR‐6769b‐3p/miR‐499a‐3p and pri‐miR‐6769b/pri‐miR‐499a levels in p53‐MT (HT29 and SW620) cells transfected with control or METTL14 siRNAs for 48 h. Data are presented as mean ± SD (biological replicates, n = 3; ns = no significance).
The sequences of pri‐miR‐6769b/pre‐miR‐6769b/miR‐6769b‐3p and pri‐miR‐499a/pre‐miR‐499a/miR‐499a‐3p are presented and highlighted by different colors. The m6A sites were predicted by SRAMP.
qRT–PCR analysis of the pri‐miR‐6769b/pre‐miR‐6769b/miR‐6769b‐3p levels in HCT116 cells transfected with wild‐type or mutant pri‐miR‐6769b plasmids. Data are presented as mean ± SD (biological replicates, n = 3, **P < 0.01).
qRT–PCR analysis of the pri‐miR‐499a/pre‐miR‐499a/miR‐499a‐3p levels in HCT116 cells transfected with wild‐type or mutant pri‐miR‐499a plasmids. Data are presented as mean ± SD (biological replicates, n = 3, **P < 0.01).
qRT–PCR analysis of the pri‐miR‐6769b/pri‐miR‐499a levels in HCT116 cells transfected with empty vector, mutant METTL14 (MT‐METTL14) or wild‐type METTL14 (WT‐METTL14) plasmids for 48 h. Data are presented as mean ± SD (biological replicates, n = 3).
Western blot and m6A dot blot analyses of METTL14, SLC2A3, PGAM1, and global m6A levels in HCT116 cells transfected with empty vector, MT‐METTL14 or WT‐METTL14 plasmids for 48 h.
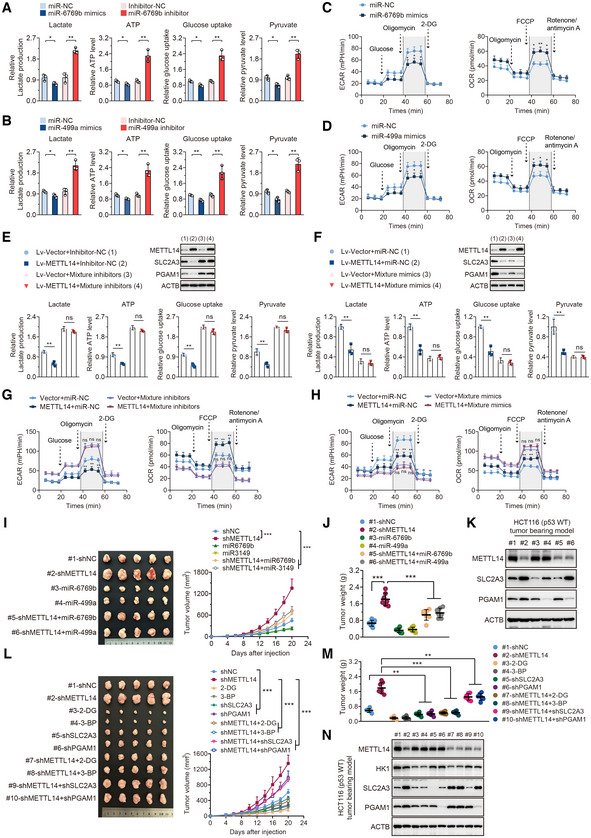
- A
Glucose uptake, lactate, ATP, and pyruvate levels were determined in HCT116 (p53‐WT) cells treated with control, miR‐6769b‐3p mimics, or inhibitor for 48 h. Data are presented as mean ± SD (biological replicates, n = 3, *P < 0.05, **P < 0.01).
- B
Glucose uptake, lactate, ATP, and pyruvate levels were determined in HCT116 (p53‐WT) cells treated with control, miR‐499a‐3p mimics, or inhibitor for 48 h. Data are presented as mean ± SD (biological replicates, n = 3, *P < 0.05, **P < 0.01).
- C
ECAR and OCR were determined in HCT116 (p53‐WT) cells treated with control, miR‐6769b‐3p mimics, or inhibitor for 48 h. Data are presented as mean ± SD (biological replicates, n = 3, *P < 0.05, **P < 0.01).
- D
ECAR and OCR were determined in HCT116 (p53‐WT) cells treated with control, miR‐499a‐3p mimics, or inhibitor for 48 h. Data are presented as mean ± SD (biological replicates, n = 3, *P < 0.05).
- E
Glucose uptake, Lactate, ATP, and pyruvate levels were determined in stably transfected Lv‐vector and Lv‐METTL14 HCT116 (p53‐WT) cells treated with control or mixture inhibitors for 48 h. Western blot analysis of the corresponding METTL14, SLC2A3, and PGAM1 protein levels in indicated treatment. Data are presented as mean ± SD (biological replicates n = 3, ns = no significance, **P < 0.01).
- F
Glucose uptake, Lactate, ATP, and pyruvate levels were determined in stably transfected Lv‐vector and Lv‐METTL14 HCT116 (p53‐WT) cells treated with control or mixture mimics for 48 h. Western blot analysis of the corresponding METTL14, SLC2A3, and PGAM1 protein levels in indicated treatment. Data are presented as mean ± SD (biological replicates, n = 3, ns = no significance, **P < 0.01).
- G
ECAR and OCR were determined in stably transfected Lv‐vector and Lv‐METTL14 HCT116 (p53‐WT) cells treated with control or mixture inhibitors for 48 h. Data are presented as mean ± SD (biological replicates, n = 3, ns = no significance, **P < 0.01).
- H
ECAR and OCR were determined in stably transfected Lv‐vector and Lv‐METTL14 HCT116 (p53‐WT) cells treated with control or mixture mimics for 48 h. Data are presented as mean ± SD (biological replicates n = 3, ns = no significance, **P < 0.01).
- I, J
Representative images and analysis of tumors in nude mice generated by stably transfected shNC and shMETTL14 or miR‐6769b‐3p and miR‐499a‐3p overexpressing HCT116 (p53‐WT) cells with or without METTL14 knockdown. Data are presented as mean ± SD (biological replicates, n = 7, ***P < 0.001).
- K
Western blot analysis of the expression of METTL14, SLC2A3, and PGAM1 in indicated tumor tissues.
- L, M
Representative images and analysis of tumors in nude mice generated by stably transfected shSLC2A3 and shPGAM1 HCT116 (p53‐WT) cells with or without METTL14 knockdown, and tumors intervened with 2‐DG and 3‐BP with or without METTL14 knockdown. Data are presented as mean ± SD (biological replicates, n = 7, **P < 0.01, ***P < 0.001).
- N
Western blot analysis of the expression of METTL14, HK1, SLC2A3, and PGAM1 in indicated tumor tissues.
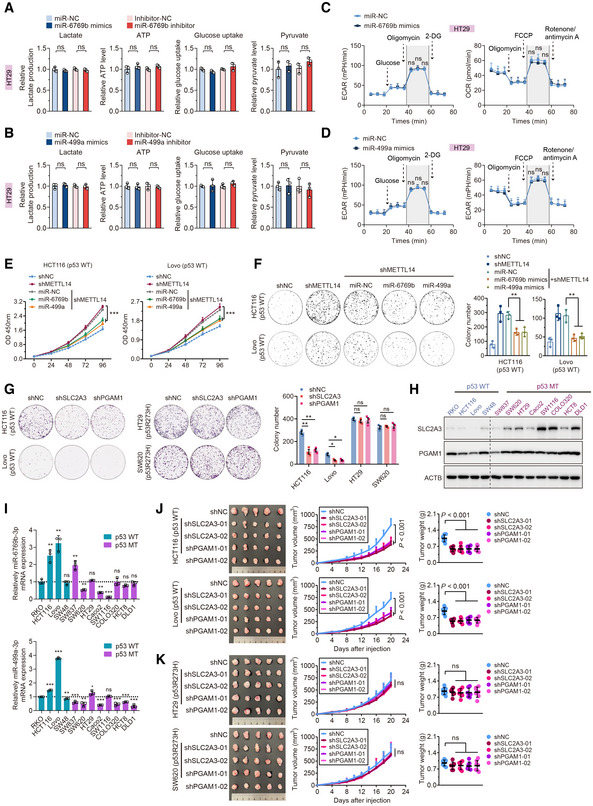
Lactate production, ATP level, glucose uptake, and pyruvate level were determined in HT29 (p53‐MT) cells treated with control, miR‐6769b‐3p mimics, or inhibitor for 48 h. Data are presented as mean ± SD (biological replicates, n = 3; ns = no significance).
Lactate production, ATP level, glucose uptake, and pyruvate level were determined in HT29 (p53‐MT) cells treated with control, miR‐499a‐3p mimics, or inhibitor for 48 h. Data are presented as mean ± SD (biological replicates, n = 3; ns = no significance).
ECAR and OCR were measured in HT29 (p53‐MT) cells transfected with control or miR‐6769b‐3p mimics for 48 h. Data are presented as mean ± SD (biological replicates, n = 3; ns = no significance).
ECAR and OCR were measured in HT29 (p53‐MT) cells transfected with control or miR‐499a‐3p mimics for 48 h. Data are presented as mean ± SD (biological replicates, n = 3; ns = no significance).
Cell viability assay was performed in HCT116 and Lovo (p53‐WT) cells stably transfected with shNC or shMETTL14, or in the stable transfectants with shMETTL14 transfected with control, miR‐6769b‐3p or miR‐499a‐3p mimics. Data are presented as mean ± SD (biological replicates, n = 5, ***P < 0.001).
Colony formation assay was performed in HCT116 and Lovo (p53‐WT) cells stably transfected with shNC or shMETTL14, or in the stable transfectants with shMETTL14 transfected with control, miR‐6769b‐3p or miR‐499a‐3p mimics. Data are presented as mean ± SD (biological replicates, n = 3, **P < 0.01).
Colony formation assay was performed in p53‐WT (HCT116 and Lovo) and p53‐MT (HT29 and SW620) cells stably transfected with control, shSLC2A3 or shPGAM1. Data are presented as mean ± SD (biological replicates, n = 3, ns = no significance, *P < 0.05, **P < 0.01).
Western blot analysis of SLC2A3 and PGAM1 in p53‐WT and p53‐MT CRC cell lines.
qRT–PCR analysis of miR‐6769b‐3p and miR‐499a‐3p mRNA level in p53‐WT and p53‐MT CRC cell lines. Data are presented as mean ± SD (biological replicates, n = 3, ns = no significance, *P < 0.05, **P < 0.01, ***P < 0.001). The dotted line represents basal mRNA expression of miR‐6769b‐3p and miR‐499a‐3p in RKO cells, acting as a control.
Representative images of tumors and analysis in nude mice intervened with control, shSLC2A3 or shPGAM1 expression p53‐WT (HCT116 and Lovo) cells. Data are presented as mean ± SD (biological replicates, n = 7).
Representative images of tumors and analysis in nude mice intervened with control, shSLC2A3 or shPGAM1 expression p53‐MT (HT29 and SW620) cells. Data are presented as mean ± SD (biological replicates, n = 7).
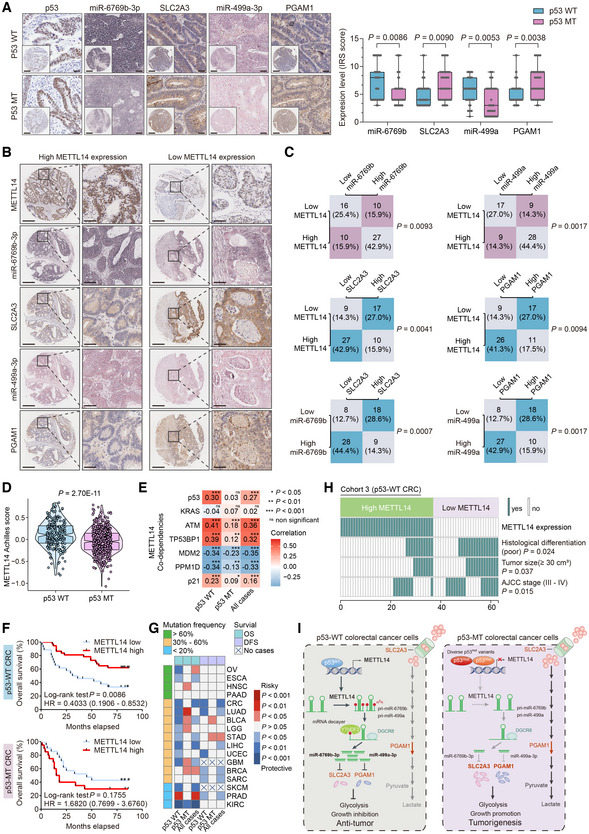
Representative IHC and ISH staining images and corresponding quantitative analysis of miR‐6769b‐3p/SLC2A3 IRS and miR‐499a‐3p/PGAM1 IRS in p53‐WT (n = 63) and p53‐MT (n = 41) samples from Cohort 3. The insets show enlarged images of indicated p53‐WT and p53‐MT CRC tissues, respectively. Scale bars = 200 μm and 20 μm (inset). The horizontal lines represent the median; the bottom and top of the boxes represent the 25 and 75% percentiles, respectively, and the vertical bars represent the range of the data.
Representative IHC and ISH images of METTL14, SLC2A3, PGAM1, miR‐6769b‐3p, and miR‐499a‐3p in CRC tissues with higher or lower METTL14 expression in p53‐WT (n = 63) samples from Cohort 3. Right panels show enlarged images of indicated p53‐WT CRC tissues. Scale bars = 200 μm (left) and 20 μm (right).
Statistical analysis of METTL14, SLC2A3, PGAM1, miR‐6769b‐3p, and miR‐499a‐3p in p53‐WT CRC tissues (n = 63) from Cohort 3.
Achilles scores for METTL14 in p53‐WT cancer cells (n = 217) and p53‐MT cancer cells (n = 527).
Association between METTL14 and p53, KRAS, ATM, TP53BP1, MDM2, PPM1D, and p21WAF1/Cip1 was analyzed by Pearson's correlation analysis in the CCLE dataset.
Kaplan–Meier survival curves of OS in CRC patients with wild‐type p53 (n = 63) and mutant p53 (n = 41) from Cohort 3 database based on expression levels of METTL14.
The survival analysis of OS and DFS in various tumors in TCGA database based on expression levels of METTL14. First, we have divided tumor patients diagnosed with the same tumor into patients with wild‐type p53, patients with mutant p53, and patients regardless of p53 status. Second, according to optimal cutoff values, patients in three groups were divided into a high‐expression METTL14 group and a low‐expression METTL14 group, respectively. Finally, Survival differences between the low‐expression METTL14 group and the high‐expression METTL14 group in each set were assessed by the Kaplan–Meier estimate and compared using the log‐rank test. Esophageal Cancer (ESCA); Bladder Cancer (BLCA); Lower Grade Glioma (LGG); Glioblastoma (GBM); Sarcoma (SARC); Skin Cutaneous Melanoma (SKCM).
Comparison of clinicopathological characteristics between METTL14 high‐ and low‐expression tumors in p53‐WT patients from Cohort 3 (n = 63).
Schematic diagram of the relationship among METTL14, glycolysis metabolism, and CRC progression.
References
-
- Apicella M, Giannoni E, Fiore S, Ferrari KJ, Fernández‐Pérez D, Isella C, Granchi C, Minutolo F, Sottile A, Comoglio PM et al (2018) Increased lactate secretion by cancer cells sustains non‐cell‐autonomous adaptive resistance to MET and EGFR targeted therapies. Cell Metab 28: 848–865 - PubMed
-
- Baker SJ, Fearon ER, Nigro JM, Hamilton SR, Preisinger AC, Jessup JM, vanTuinen P, Ledbetter DH, Barker DF, Nakamura Y et al (1989) Chromosome 17 deletions and p53 gene mutations in colorectal carcinomas. Science 244: 217–221 - PubMed
Publication types
MeSH terms
Substances
Associated data
- Actions
- Actions
- Actions
Grants and funding
LinkOut - more resources
Full Text Sources
Medical
Molecular Biology Databases
Research Materials
Miscellaneous
