Measurement of 24-h continuous human CH4 release in a whole room indirect calorimeter
- PMID: 36794690
- PMCID: PMC10027086
- DOI: 10.1152/japplphysiol.00705.2022
Measurement of 24-h continuous human CH4 release in a whole room indirect calorimeter
Abstract
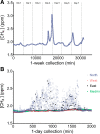
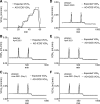
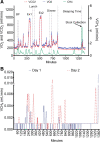
We describe the technology and validation of a new whole room indirect calorimeter (WRIC) methodology to quantify volume of methane (VCH4) released from the human body over 24 h concurrently with the assessment of energy expenditure and substrate utilization. The new system extends the assessment of energy metabolism by adding CH4, a downstream product of microbiome fermentation that could contribute to energy balance. Our new system consists of an established WRIC combined with the addition of off-axis integrated-cavity output spectroscopy (OA-ICOS) to measure CH4 concentration ([CH4]). Development, validation, and reliability of the system included environmental experiments to measure the stability of the atmospheric [CH4], infusing CH4 into the WRIC and human cross-validation studies comparing [CH4] quantified by OA-ICOS and mid-infrared dual-comb spectroscopy (MIR DCS).Our infusion data indicated that the system measured 24-h [CH4] and VCH4 with high sensitivity, reliability, and validity. Cross-validation studies showed good agreement between OA-ICOS and MIR DCS technologies (r = 0.979, P < 0.0001). Human data revealed 24-h VCH4 was highly variable between subjects and within/between days. Finally, our method to quantify VCH4 released by breath or colon suggested that over 50% of the CH4 was eliminated through the breath. The method allows, for the first time, measurement of 24-h VCH4 (in kcal) and therefore the measurement of the proportion of human energy intake fermented to CH4 by the gut microbiome and released via breath or from the intestine; also, it allows us to track the effects of dietary, probiotic, bacterial, and fecal microbiota transplantation on VCH4.NEW & NOTEWORTHY This is the first time that continuous assessment of CH4 is reported in parallel with measurements of O2 consumption and CO2 production inside a whole room indirect calorimeter in humans and over 24 h. We provide a detailed description of the whole system and its parts. We carried out studies of reliability and validity of the whole system and its parts. CH4 is released in humans during daily activities.
Keywords: gas infusion; reliability; spectroscopy; validation; whole room indirect calorimeter.
Conflict of interest statement
No conflicts of interest, financial or otherwise, are declared by the authors.
Figures


Similar articles
-
Circadian patterns of total 24-h hydrogen and methane excretion in humans ingesting nonstarch polysaccharide (NSP) diets and the implications for indirect calorimetric and D2 18O methodologies.Eur J Clin Nutr. 1996 Aug;50(8):524-34. Eur J Clin Nutr. 1996. PMID: 8863013
-
Validity and reliability of a new whole room indirect calorimeter to assess metabolic response to small calorie loads.PLoS One. 2024 Jun 20;19(6):e0304030. doi: 10.1371/journal.pone.0304030. eCollection 2024. PLoS One. 2024. PMID: 38900814 Free PMC article.
-
Integrative and quantitative bioenergetics: Design of a study to assess the impact of the gut microbiome on host energy balance.Contemp Clin Trials Commun. 2020 Aug 19;19:100646. doi: 10.1016/j.conctc.2020.100646. eCollection 2020 Sep. Contemp Clin Trials Commun. 2020. PMID: 32875141 Free PMC article.
-
Techniques for the study of energy balance in man.Proc Nutr Soc. 2003 May;62(2):529-37. doi: 10.1079/pns2003255. Proc Nutr Soc. 2003. PMID: 14506901 Review.
-
Review: Comparative methane production in mammalian herbivores.Animal. 2020 Mar;14(S1):s113-s123. doi: 10.1017/S1751731119003161. Animal. 2020. PMID: 32024568 Review.
Cited by
-
Reprogramming the Human Gut Microbiome Reduces Dietary Energy Harvest.Res Sq [Preprint]. 2023 Jan 25:rs.3.rs-2382790. doi: 10.21203/rs.3.rs-2382790/v1. Res Sq. 2023. Update in: Nat Commun. 2023 May 31;14(1):3161. doi: 10.1038/s41467-023-38778-x. PMID: 36747835 Free PMC article. Updated. Preprint.
-
Methanogenesis associated with altered microbial production of short-chain fatty acids and human-host metabolizable energy.ISME J. 2025 Jan 2;19(1):wraf103. doi: 10.1093/ismejo/wraf103. ISME J. 2025. PMID: 40403748 Free PMC article. Clinical Trial.
References
-
- Chen KY, Smith S, Ravussin E, Krakoff J, Plasqui G, Tanaka S, Murgatroyd P, Brychta R, Bock C, Carnero E, Schoffelen P, Hatamoto Y, Rynders C, Melanson EL. Room Indirect Calorimetry Operating and Reporting Standards (RICORS 1.0): a guide to conducting and reporting human whole-room calorimeter studies. Obesity (Silver Spring) 28: 1613–1625, 2020. doi:10.1002/oby.22928. - DOI - PMC - PubMed
-
- Carnero EA, Bock CP, Distefano G, Corbin KD, Stephens NA, Pratley RE, Smith SR, Goodpaster BH, Sparks LM. Twenty-four hour assessments of substrate oxidation reveal differences in metabolic flexibility in type 2 diabetes that are improved with aerobic training. Diabetologia 64: 2322–2333, 2021. doi:10.1007/s00125-021-05535-y. - DOI - PubMed
-
- Corbin KD, Krajmalnik-Brown R, Carnero EA, Bock C, Emerson R, Rittmann BE, Marcus AK, Davis T, Dirks B, Ilhan ZE, Champagne C, Smith SR. Integrative and quantitative bioenergetics: design of a study to assess the impact of the gut microbiome on host energy balance. Contemp Clin Trials Commun 19: 100646, 2020. doi:10.1016/j.conctc.2020.100646. - DOI - PMC - PubMed
Publication types
MeSH terms
Grants and funding
LinkOut - more resources
Full Text Sources

