

Hollow-fibre system model of tuberculosis reproducibility and performance specifications for best practice in drug and combination therapy development
- PMID: 36794692
- PMCID: PMC10068422
- DOI: 10.1093/jac/dkad029
Hollow-fibre system model of tuberculosis reproducibility and performance specifications for best practice in drug and combination therapy development
Abstract
Background: The hollow-fibre system model of tuberculosis (HFS-TB) has been endorsed by regulators; however, application of HFS-TB requires a thorough understanding of intra- and inter-team variability, statistical power and quality controls.
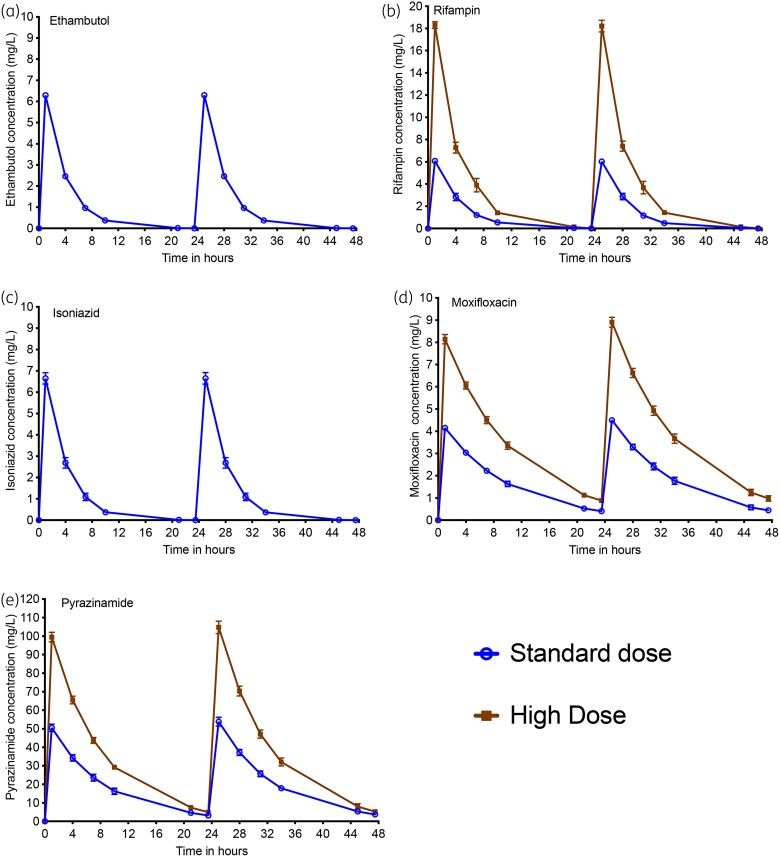
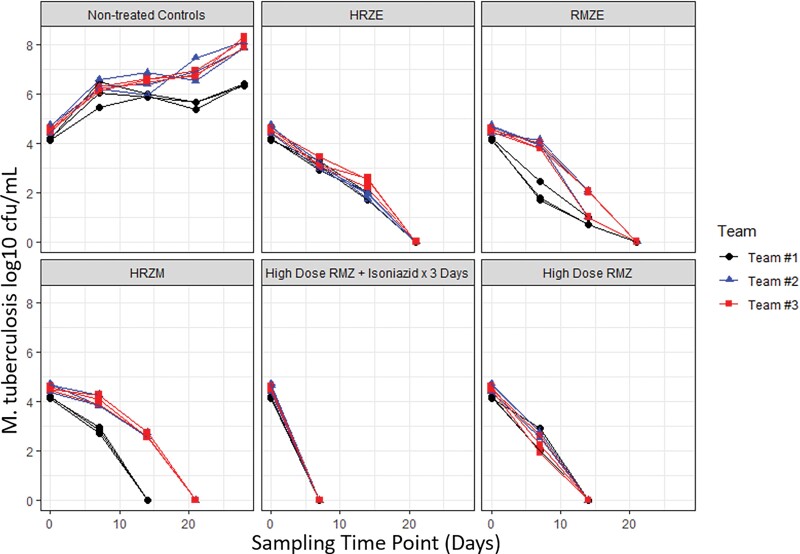
Methods: Three teams evaluated regimens matching those in the Rapid Evaluation of Moxifloxacin in Tuberculosis (REMoxTB) study, plus two high-dose rifampicin/pyrazinamide/moxifloxacin regimens, administered daily for up to 28 or 56 days against Mycobacterium tuberculosis (Mtb) under log-phase growth, intracellular growth or semidormant growth under acidic conditions. Target inoculum and pharmacokinetic parameters were pre-specified, and the accuracy and bias at achieving these calculated using percent coefficient of variation (%CV) at each sampling point and two-way analysis of variance (ANOVA).
Results: A total of 10 530 individual drug concentrations, and 1026 individual cfu counts were measured. The accuracy in achieving intended inoculum was >98%, and >88% for pharmacokinetic exposures. The 95% CI for the bias crossed zero in all cases. ANOVA revealed that the team effect accounted for <1% of variation in log10 cfu/mL at each timepoint. The %CV in kill slopes for each regimen and different Mtb metabolic populations was 5.10% (95% CI: 3.36%-6.85%). All REMoxTB arms exhibited nearly identical kill slopes whereas high dose regimens were 33% faster. Sample size analysis revealed that at least three replicate HFS-TB units are needed to identify >20% difference in slope, with a power of >99%.
Conclusions: HFS-TB is a highly tractable tool for choosing combination regimens with little variability between teams, and between replicates.
© The Author(s) 2023. Published by Oxford University Press on behalf of British Society for Antimicrobial Chemotherapy.
Figures


Similar articles
-
Efficacy Versus Hepatotoxicity of High-dose Rifampin, Pyrazinamide, and Moxifloxacin to Shorten Tuberculosis Therapy Duration: There Is Still Fight in the Old Warriors Yet!Clin Infect Dis. 2018 Nov 28;67(suppl_3):S359-S364. doi: 10.1093/cid/ciy627. Clin Infect Dis. 2018. PMID: 30496465 Free PMC article.
-
Mycobacterium tuberculosis sterilizing activity of faropenem, pyrazinamide and linezolid combination and failure to shorten the therapy duration.Int J Infect Dis. 2021 Mar;104:680-684. doi: 10.1016/j.ijid.2021.01.062. Epub 2021 Feb 5. Int J Infect Dis. 2021. PMID: 33556616 Free PMC article.
-
Tedizolid, Faropenem, and Moxifloxacin Combination With Potential Activity Against Nonreplicating Mycobacterium tuberculosis.Front Pharmacol. 2021 Jan 19;11:616294. doi: 10.3389/fphar.2020.616294. eCollection 2020. Front Pharmacol. 2021. PMID: 33542690 Free PMC article.
-
Shortened treatment regimens versus the standard regimen for drug-sensitive pulmonary tuberculosis.Cochrane Database Syst Rev. 2019 Dec 12;12(12):CD012918. doi: 10.1002/14651858.CD012918.pub2. Cochrane Database Syst Rev. 2019. PMID: 31828771 Free PMC article.
-
[Development of antituberculous drugs: current status and future prospects].Kekkaku. 2006 Dec;81(12):753-74. Kekkaku. 2006. PMID: 17240921 Review. Japanese.
Cited by
-
Omadacycline pharmacokinetics/pharmacodynamics and efficacy against multidrug-resistant Mycobacterium tuberculosis in the hollow fiber system model.Antimicrob Agents Chemother. 2024 Feb 7;68(2):e0108023. doi: 10.1128/aac.01080-23. Epub 2023 Dec 22. Antimicrob Agents Chemother. 2024. PMID: 38131673 Free PMC article.
-
Eradication of Drug-Tolerant Mycobacterium tuberculosis 2022: Where We Stand.Microorganisms. 2023 Jun 6;11(6):1511. doi: 10.3390/microorganisms11061511. Microorganisms. 2023. PMID: 37375013 Free PMC article. Review.
-
Effect of host microenvironment and bacterial lifestyles on antimicrobial sensitivity and implications for susceptibility testing.NPJ Antimicrob Resist. 2025 May 21;3(1):42. doi: 10.1038/s44259-025-00113-3. NPJ Antimicrob Resist. 2025. PMID: 40399473 Free PMC article. Review.
-
Modernizing Preclinical Drug Development: The Role of New Approach Methodologies.ACS Pharmacol Transl Sci. 2025 May 29;8(6):1513-1525. doi: 10.1021/acsptsci.5c00162. eCollection 2025 Jun 13. ACS Pharmacol Transl Sci. 2025. PMID: 40567279 Review.
-
Application of the Hollow-Fiber Infection Model to Personalized Precision Dosing of Isoniazid in a Clinical Setting.J Korean Med Sci. 2024 Apr 8;39(13):e104. doi: 10.3346/jkms.2024.39.e104. J Korean Med Sci. 2024. PMID: 38599596 Free PMC article.
References
Publication types
MeSH terms
Substances
LinkOut - more resources
Full Text Sources
Medical
Molecular Biology Databases
