. 2023 Apr 1;324(4):F423-F430.
doi: 10.1152/ajprenal.00295.2022. Epub 2023 Feb 16.

Accuracy and processing time of kidney volume measurement methods in rodents polycystic kidney disease models: superiority of semiautomated kidney segmentation

Affiliations

Accuracy and processing time of kidney volume measurement methods in rodents polycystic kidney disease models: superiority of semiautomated kidney segmentation

Mary Claire Doss et al. Am J Physiol Renal Physiol. .

Abstract

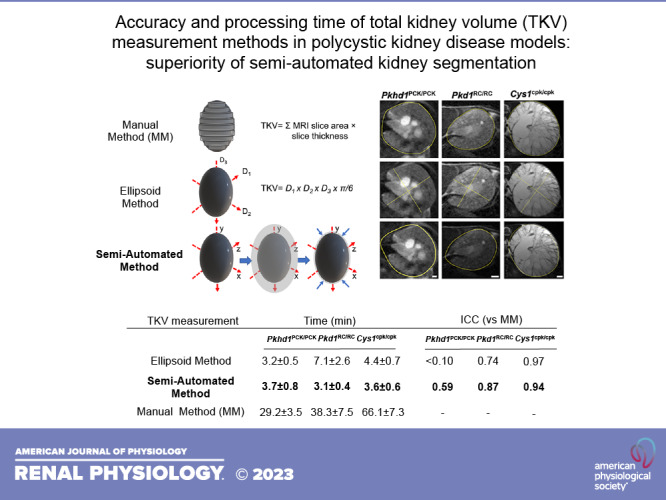
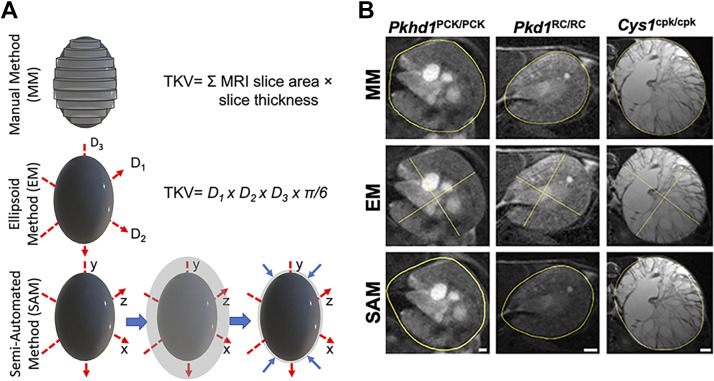
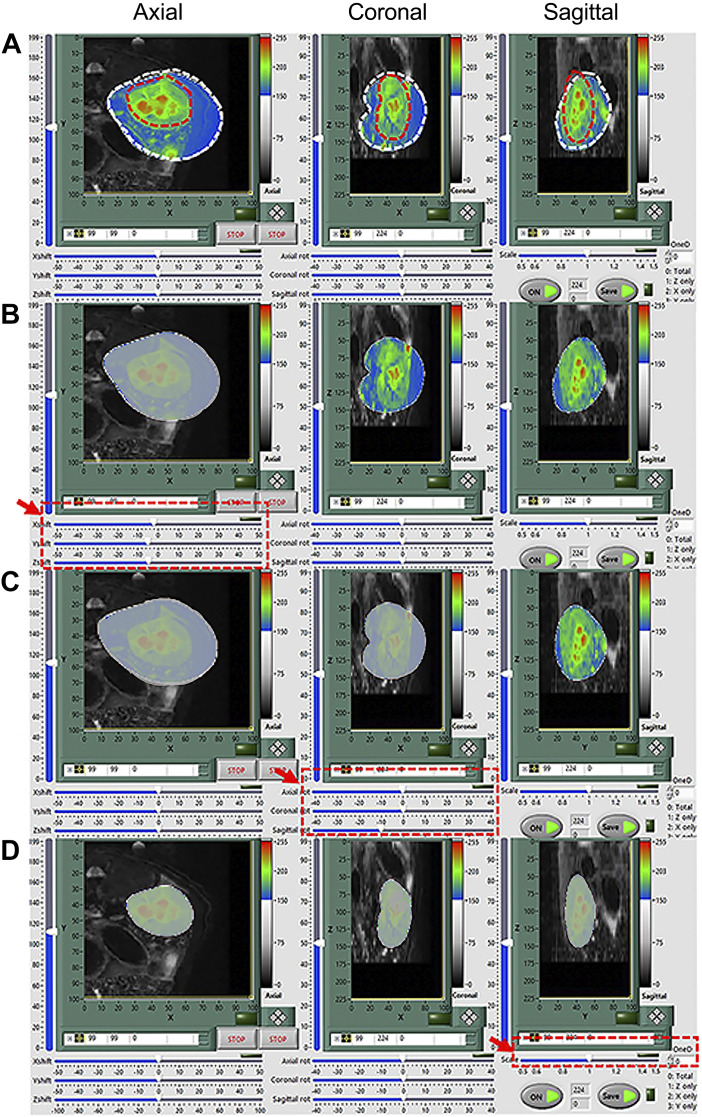
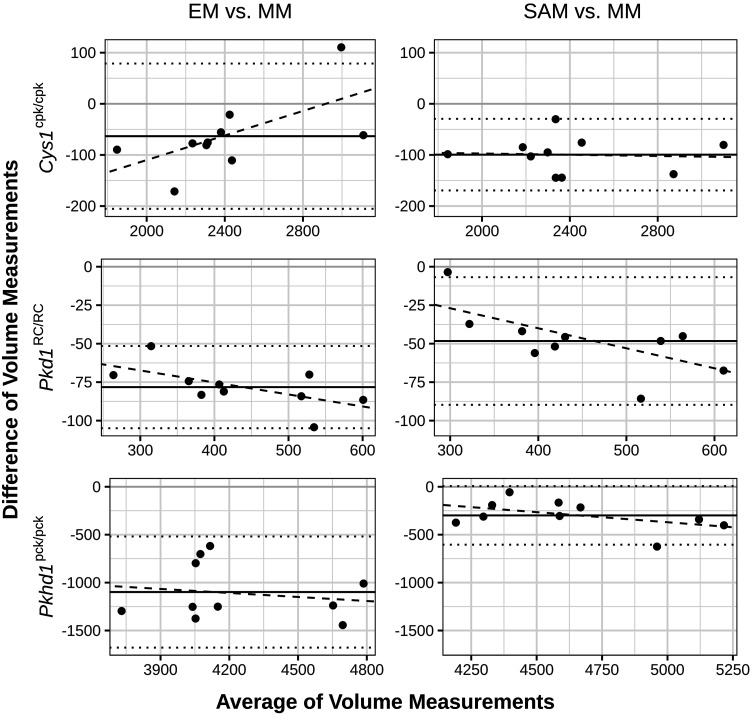
Measurement of total kidney volume (TKV) using magnetic resonance imaging (MRI) is a valuable approach for monitoring disease progression in autosomal dominant polycystic kidney disease (PKD) and is becoming more common in preclinical studies using animal models. Manual contouring of kidney MRI areas [i.e., manual method (MM)] is a conventional, but time-consuming, way to determine TKV. We developed a template-based semiautomatic image segmentation method (SAM) and validated it in three commonly used PKD models: Cys1cpk/cpk mice, Pkd1RC/RC mice, and Pkhd1pck/pck rats (n = 10 per model). We compared SAM-based TKV with that obtained by clinical alternatives including the ellipsoid formula-based method (EM) using three kidney dimensions, the longest kidney length method (LM), and MM, which is considered the gold standard. Both SAM and EM presented high accuracy in TKV assessment in Cys1cpk/cpk mice [interclass correlation coefficient (ICC) ≥ 0.94]. SAM was superior to EM and LM in Pkd1RC/RC mice (ICC = 0.87, 0.74, and <0.10 for SAM, EM, and LM, respectively) and Pkhd1pck/pck rats (ICC = 0.59, <0.10, and <0.10, respectively). Also, SAM outperformed EM in processing time in Cys1cpk/cpk mice (3.6 ± 0.6 vs. 4.4 ± 0.7 min/kidney) and Pkd1RC/RC mice (3.1 ± 0.4 vs. 7.1 ± 2.6 min/kidney, both P < 0.001) but not in Pkhd1PCK/PCK rats (3.7 ± 0.8 vs. 3.2 ± 0.5 min/kidney). LM was the fastest (∼1 min) but correlated most poorly with MM-based TKV in all studied models. Processing times by MM were longer for Cys1cpk/cpk mice, Pkd1RC/RC mice, and Pkhd1pck.pck rats (66.1 ± 7.3, 38.3 ± 7.5, and 29.2 ± 3.5 min). In summary, SAM is a fast and accurate method to determine TKV in mouse and rat PKD models.NEW & NOTEWORTHY Total kidney volume (TKV) is a valuable readout in preclinical studies for autosomal dominant and autosomal recessive polycystic kidney diseases (ADPKD and ARPKD). Since conventional TKV assessment by manual contouring of kidney areas in all images is time-consuming, we developed a template-based semiautomatic image segmentation method (SAM) and validated it in three commonly used ADPKD and ARPKD models. SAM-based TKV measurements were fast, highly reproducible, and accurate across mouse and rat ARPKD and ADPKD models.

Keywords: animal imaging; autosomal dominant polycystic kidney disease; autosomal recessive polycystic kidney disease; magnetic resonance imaging; image analysis tools.


Conflict of interest statement

M.M. reports grants and consulting fees outside the submitted work from Otsuka Pharmaceuticals, Sanofi, Palladio Biosciences, Reata, Natera, Chinook Therapeutics, Goldilocks Therapeutics, and Carraway Therapeutics. D.P.W. has grant support from Calico Laboratories. None of the other authors has any conflicts of interest, financial or otherwise, to disclose.

Figures

None
Graphical abstract
Figure 1.
Figure 1.
The three analyzed methods for kidney volume assessment in small animal polycystic kidney disease models. A: schema of the manual method (MM), ellipsoid formula method (EM), and semiautomated method (SAM). In each image, the dark gray oval represents the kidney that is being measured. In MM, the individual layers of the kidney, which are manually outlined (represented by the lighter gray overlays shown filling the entire kidney). The area of each of these individual layers is calculated using manual outlines, and total kidney volume (TKV) is calculated as a sum of all these layers (see provided equation). EM estimates TKV based on the measurement of two perpendicular lines drawn through the center image slice within the kidney. These measurements [D1 and D2 (corresponding to kidney width and depth) as well as D3 (corresponding to kidney length)] are used to calculate TKV (see provided equation). SAM uses the imaging software shown. The lighter gray outline represents the three-dimensional reference template, which is adjusted in each plane to accurately fit the dimensions of the kidney being measured. The adjustments are illustrated by the blue arrows and the change in size of the light gray overlay. B: representative central kidney regions of the three studied animal models with the kidney boundaries determined either by MM, EM, or SAM. In this study, the region determined by MM was considered a reference to which we compared the performance of the other tested methods. The three studied models represent distinct patterns of renal cyst distribution; most renal tissue parenchyma was preserved in the Pkhd1pck/pck rat and Pkd1RC/RC mouse models, and most of the renal tissue was replaced by cysts in the Cys1cpk/cpk mouse model. Specifically, in Pkhd1pck/pck rats, by 10 wk of age, most cysts localized to the corticomedullary junction or medulla. In Pkd1RC/RC mice (C57BL6/J genetic background), the renal cystic burden was mild at 14 wk of age, with mostly small, isolated cysts localized to both the medulla and cortex. In contrast, in Cys1cpk/cpk mice, by 21 days of postnatal age, nearly all renal tissue parenchyma was replaced by cystically dilated tubules across the cortex and medulla. Scale bar = 1 mm.
Figure 2.
Figure 2.
The front panel of a software package for semiautomated segmentation of a three-dimensional left kidney region. A: kidney images at axial, coronal, and sagittal views overlapped with the reference template image immediately after the template reference image was loaded. The boundary of the template reference is indicated with a white dotted line at each view, whereas that of the measured kidney is indicated with a red dotted line. The reference image was transformed to match the boundary of the kidney image more accurately by conducting translation (B), rotation (C), and scaling (D) to match with the actual kidney region. Specifically, an adjustment in the axial plane (B) moved the kidney image into the center of the template reference image (see the gray overlay). Adjustment in the coronal plane rotated the reference image to overlay the kidney image (C) even more accurately (as indicated by the gray overlays). Finally, an adjustment in the sagittal plane (D) scaled the template reference image to further enhance the match of the kidney image overlay to the measured kidney shape (as indicated by the gray overlays in all three planes). Adjustments made in each plane can be seen on the scale bars below each image and are highlighted by a red outline and arrow.
Figure 3.
Figure 3.
Bland–Altman plots for the agreement between the ellipsoid formula method (EM) vs. manual method (MM) and semiautomated method (SAM) vs. MM for total kidney volume (TKV). In all graphs, the x-axis represents mean TKV (combined volumes or left and right kidneys) obtained with EM vs. the MM reference (left) and SAM vs. the MM reference (right) in mm3. The y-axis represents the difference between TKVs obtained with EM vs. MM (left) and SAM vs. MM (right) in mm3. The horizontal solid line shows the mean bias indicating the average under- or overestimation of EM or SAM vs. the MM reference. The lower and upper horizontal dotted lines represent the limits of agreement (average difference ± 1.96 SD). Finally, the regression line of difference is represented by a dashed line.

Similar articles

Cited by

References

    1. Rahbari-Oskoui F, Mrug M, Saigusa T, Rizk D. Cystic diseases of the kidney. In: Emery and Rimoin’s Principles and Practice of Medical Genetics and Genomics (7th ed.), edited by Pyeritz R, Korf B, Grody W.. New York: Academic Press, 2023, pages 39–94. 10.1016/B978-0-12-812534-2.00005-9. - DOI
    1. Yu ASL, Shen C, Landsittel DP, Harris PC, Torres VE, Mrug M, Bae KT, Grantham JJ, Rahbari-Oskoui FF, Flessner MF, Bennett WM, Chapman AB; Consortium for Radiologic Imaging Studies of Polycystic Kidney Disease (CRISP). Baseline total kidney volume and the rate of kidney growth are associated with chronic kidney disease progression in autosomal dominant polycystic kidney disease. Kidney Int 93: 691–699, 2018. doi:10.1016/j.kint.2017.09.027. - DOI - PMC - PubMed
    1. Chebib FT, Perrone RD, Chapman AB, Dahl NK, Harris PC, Mrug M, Mustafa RA, Rastogi A, Watnick T, Yu ASL, Torres VE. A practical guide for treatment of rapidly progressive ADPKD with Tolvaptan. J Am Soc Nephrol 29: 2458–2470, 2018. doi:10.1681/ASN.2018060590. - DOI - PMC - PubMed
    1. Federal Register. Qualification of Biomarker-Total Kidney Volume in Studies for Treatment of Autosomal Dominant Polycystic Kidney Disease; Draft Guidance for Industry; Availability. Federal Register 80 FR 49244-6 (Docket No. FDA-2015-D-2843), 2015. https://www.federalregister.gov/documents/2015/08/17/2015-20228/qualific....
    1. Kistler AD, Poster D, Krauer F, Weishaupt D, Raina S, Senn O, Binet I, Spanaus K, Wuthrich RP, Serra AL. Increases in kidney volume in autosomal dominant polycystic kidney disease can be detected within 6 months. Kidney Int 75: 235–241, 2009. doi:10.1038/ki.2008.558. - DOI - PubMed

Publication types

MeSH terms

Substances

Supplementary concepts

LinkOut - more resources