. 2023 Jul;243(1):23-38.
doi: 10.1111/joa.13844. Epub 2023 Feb 16.

The HOPX and BLBP landscape and gliogenic regions in developing human brain

Affiliations

The HOPX and BLBP landscape and gliogenic regions in developing human brain

Camilla Bjørnbak Holst et al. J Anat. 2023 Jul.

Abstract

Outer radial glial cells (oRGs) give rise to neurons and glial cells and contribute to cell migration and expansion in developing neocortex. HOPX has been described as a marker of oRGs and possible actor in glioblastomas. Recent years' evidence points to spatiotemporal differences in brain development which may have implications for the classification of cell types in the central nervous system and understanding of a range of neurological diseases. Using the Human Embryonic/Fetal Biobank, Institute of Cellular and Molecular Medicine, Faculty of Health and Medical Sciences, University of Copenhagen, Denmark, HOPX and BLBP immunoexpression was investigated in developing frontal, parietal, temporal and occipital human neocortex, other cortical areas and brain stem regions to interrogate oRG and HOPX regional heterogeneity. Furthermore, usage of high-plex spatial profiling (Nanostring GeoMx® DSP) was tested on the same material. HOPX marked oRGs in several human developing brain regions as well as cells in known gliogenic areas but did not completely overlap with BLBP or GFAP. Interestingly, limbic structures (e.g. olfactory bulb, indusium griseum, entorhinal cortex, fimbria) showed more intense HOPX immunoreactivity than adjacent neocortex and in cerebellum and brain stem, HOPX and BLBP seemed to stain different cell populations in cerebellar cortex and corpus pontobulbare. DSP screening of corresponding regions indicated differences in cell type composition, vessel density and presence of apolipoproteins within and across regions and thereby confirming the importance of acknowledging time and place in developmental neuroscience.

Keywords: BLBP; CNS; HOPX; fetal; human.


Figures

FIGURE 1
FIGURE 1
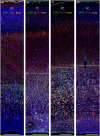
Distribution of toluidine blue (TB) (a), vimentin (VIM) (b), BLBP (c) and HOPX (d) immunoreactivity in consecutive coronal sections of occipital cortex from a 21 wpc fetus (CRL: 200 mm). HOPX, BLBP and vimentin are all present in the endfeet layer (EFL) (arrows in (d)) lining the pial surface and in a large proportion of cells in the outer subventricular zone (OSVZ), separating the inner‐ (IFL) and outer fibrous layer (OFL). The zonal configuration of OSVZ as depicted with VIM, BLBP and HOPX is attenuated towards the calcarine sulcus (CS) and a narrower possible OSVZ emerges below CS where the majority of HOPX‐positive cells is stained with less intensity and oriented tangentially as opposed to the radial orientation of HOPX‐positive cells in the adjacent OSVZ (not shown). The cortical plate as defined by TB is divided into two sections by BLBP. Vimentin stains the ventricular zone (VZ), which is almost devoid of HOPX and contains few BLBP‐positive cells. The framed area in (a) is shown in higher magnification in Figure 2. CS, calcarine sulcus; EFL, endfeet layer; IFL, inner fibrous layer; LW, lateral wall; MW, medial wall; OFL, outer fibrous layer; OSVZ, outer subventricular zone; SVZ, subventricular zone; TB, toluidine blue; VIM, vimentin; VZ, ventricular zone. All figures are of same magnification. Scale bar: 5000 μm.
FIGURE 2
FIGURE 2
Distribution of toluidine blue (TB) (a), vimentin (b), BLBP (c) and HOPX (d) immunoreactivity in consecutive coronal sections of occipital cortex from a 21 wpc fetus (CRL: 200 mm). Described zones of the neocortex are depicted with dotted lines. At this magnification it is evident, that although staining of vimentin, BLBP and HOPX overlap, they have distinct patterns also described briefly in Figure 1. CP, cortical plate; IFL, inner fibrous layer; ISVZ, inner subventricular zone; MZ, marginal zone; OFL, outer fibrous layer; OSP, outer subplate; OSVZ, outer subventricular zone; SP, subplate; VZ, ventricular zone. All figures are of same magnification. Scale bar: 500 μm.
FIGURE 3
FIGURE 3
(a) and (b) are whole‐slide fluorescent scans of occipital cortex from the same 21 wpc fetus as shown in Figure 1. Sections are double‐labeled with antibodies against HOPX and BLBP (a) and HOPX and GFAP (b). In this particular section, GFAP reactive fibers are not seen at this low magnification. The asterisks in (a) and (b) mark a transition to a narrower outer subventricular zone below the calcarine sulcus. In (c), the boxed area in (a) is shown in higher magnification, revealing scattered HOPX‐positive cells and blood vessel walls in the subplate and cortical plate in addition to described findings in Figures 1 and 2. The HOPX and BLBP‐positive endfeet layer facing the subarachnoid space is depicted in (d) (upper boxed area in (c)); HOPX and BLBP‐positive fibers in the subplate in (e) (middle boxed area in (c)) and HOPX and BLBP‐positive radially oriented outer radial glial cells in (f) (similar area shown in lower boxed area in (c)). At this stage, HOPX is not present in the ISVZ and VZ as shown in (g) (boxed area in (b)), in contrast to GFAP, which is prevalent in both zones (arrowheads in b, g). Scale bars: (a, b) 2000 μm; (c, g) 500 μm; (d–f) 100 μm.
FIGURE 4
FIGURE 4
Immunofluorescent staining of HOPX and BLBP in coronal sections of occipital (a), temporal (b), parietal (c) and frontal (d) neocortex from 21 wpc (a) and 19 wpc (b–d) human fetal brains. The parietal cortex shown here has been sectioned close to the frontal lobe, which may explain their similar appearance. The outer fibrous layer (OFL) is visible in (a). The inner fibrous layer (IFL)/outer subventricular zone (OSVZ) seem to increase in size in parietal and frontal cortex with a higher density of horizontal fibers interdigitating with radially oriented radial glial cells and their extensions. The dotted line in (a–d) illustrates a proposed outer demarcation of the OSVZ. FC, frontal cortex; OC, occipital cortex; PC, parietal cortex; TC, temporal cortex. Scale bars: 500 μm.
FIGURE 5
FIGURE 5
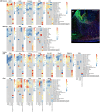
(a) Each heatmap shows log2 signal‐to‐noise ratios of different proteins in 22 regions of interest (ROI) (rows) in selected areas/regions (columns) from 13 wpc (frontal), 19 wpc (temporal, parietal) and 21 wpc (occipital, brain stem and cerebellum) human fetal brain samples profiled using Nanostring GeoMx ® . Values below 1 or missing are depicted in grey. Proteins are grouped according to cell types in which they are known to be prevalent. Apart from indusium griseum (b) (green, HOPX; red, BLBP), examples of selected areas/regions are illustrated on Figure 1, 2 (neocortical zones), Figure 6 (olfactory bulb), Figure 7 (hippocampus), Figure 8 (cerebellar cortex, center of dentate nucleus, axonal fibers and corpus pontobulbare). All regions of interest are depicted in Figure S1–S5. The screening reveals differences in protein abundance between regions/areas and/or ages in fetal developing brain. Scale bar: 500 μm.
FIGURE 6
FIGURE 6
Whole‐slide fluorescent scans (a, b) and higher magnifications (c, d, e) of HOPX and BLBP in frontal cortex from a 19 wpc human fetus (a). Both HOPX and BLBP are prevalent in the olfactory bulb (lower boxed area in (a) shown in higher magnification in c, d, e) and in relation to the rostral extension of the caudal ganglionic eminence (circle in (a)), whereas the signal is sparse in lateral ganglionic eminence. BLBP immunostaining is prominent in the radial glial fiber fascicle (arrowheads) and HOPX delineates the pial border through an immunoreactive endfeet layer, which is accentuated in “limbic cortex” (between arrowheads in higher magnification in (b)). In this region, HOPX immunoreactivity is also scattered throughout the cortical wall. BO, olfactory bulb; CF, callosal fibers; CP, cortical plate; EFL, endfeet layer; L, lateral; M, medial; MZ, marginal zone; SP, subplate; SVZ, subventricular zone; VZ, ventricular zone. Scale bars: (a) 2000 μm; (b) 500 μm; (c), (d, e) 100 μm.
FIGURE 7
FIGURE 7
(a) and (d) are whole‐slide fluorescent scans of the hippocampal formation and temporal cortex from a 19 wpc human fetus. Sections are double labelled with antibodies against HOPX and GFAP (a) and HOPX and BLBP (d). In (b and c), the boxed areas in (a) are depicted. (e) and (f) are higher magnifications of the boxed areas in (d). HOPX immunoreactivity is strongest in fimbria (F) (c, f), in subventricular zone (SVZ) in entorhinal cortex (EC) (b, e) and in the glial endfeet layer facing the subarachnoid space (a, d). GFAP is practically confined to the fimbrio‐dentate junction (FDJ) (a, c). BLBP and HOPX overlap in SVZ, whereas they seem to stain different cell populations in the hippocampus. Of note, the asterisk in (b) indicates presence of intraventricular hemorrhage. CP, cortical plate; EC: entorhinal cortex; F: fimbria; FDJ: fimbrio‐dentate junction; HF: hippocampal fissure; Hip, hippocampus; ISVZ, inner subventricular zone; MZ, marginal zone; OSVZ, outer subventricular zone; SP, subplate; TC, temporal cortex; VZ, ventricular zone. Scale bars: 1000 μm.
FIGURE 8
FIGURE 8
Distribution of HOPX and BLBP in cerebellum and brain stem from a 21 wpc human fetal brain. (b–e) are higher magnifications of boxed areas in (a). HOPX is most prevalent in corpus pontobulbare (CPB) depicted in (a–d). HOPX (b) and BLBP (c) seem to occupy different regions (d) of this cellular aggregate dominated by strong HOPX immunoreactivity. HOPX is also scattered in the brain stem and in the dentate nucleus (a) as well as in blood vessel walls (e). In the cerebellar cortex HOPX is mostly confined to the Purkinje cell layer (e). CB, cerebellum; CP, choroid plexus; CPB, corpus pontobulbare; D, dentate nucleus; EFL, endfeet layer; EGL: external granular/germinal layer; IGL: internal granular layer; P, pons; PCL: Purkinje cell layer. Scale bars: (a): 2000 μm; (b–e) 1000 μm.
FIGURE 9
FIGURE 9
HOPX and BLBP immunoreactivity in brain barrier interfaces in a 21 wpc (a) and a 19 wpc (b–d) human fetal brain. A granular cytoplasmatic stain defines HOPX immunoreactivity in the majority of choroid plexus epithelial cells (a) (blood‐CSF interface at the fourth ventricle). BLBP on the other hand only stains the apical membrane of the choroid plexus epithelial cells, which is also stained by HOPX. The stroma including vasculature is unstained for both HOPX and BLBP. In (b, c) HOPX is seen in the glial endfeet layer facing the subarachnoid space (SAS, arrowheads) (outer CSF‐brain barrier) as well as in epithelial cells of penetrating arterioles (arrows) and multiple capillaries (blood–brain barrier proper) in the cortical wall. Note the HOPX immunoreactivity of leptomeningeal cells in the SAS and the absence of BLBP staining. BLBP is equally present in the endfeet layer and in endfeet surrounding vasculature, but not in the vasculature wall per se (arrows). (d). Scale bars: (a) 100 μm; (b–d): 200 μm.

References

    1. Altman, J. & Bayer, S.A. (2002) Regional differences in the stratified transitional field and the honeycomb matrix of the developing human cerebral cortex. Journal of Neurocytology, 31, 613–632. - PubMed
    1. Bakken, T.E. , Miller, J.A. , Ding, S.L. , Sunkin, S.M. , Smith, K.A. , Ng, L. et al. (2016) A comprehensive transcriptional map of primate brain development. Nature, 535, 367–375. - PMC - PubMed
    1. Barry, D.S. , Pakan, J.M. & Mcdermott, K.W. (2014) Radial glial cells: key organisers in CNS development. The International Journal of Biochemistry & Cell Biology, 46, 76–79. - PubMed
    1. Bayraktar, O.A. , Bartels, T. , Holmqvist, S. , Kleshchevnikov, V. , Martirosyan, A. , Polioudakis, D. et al. (2020) Astrocyte layers in the mammalian cerebral cortex revealed by a single‐cell in situ transcriptomic map. Nature Neuroscience, 23, 500–509. - PMC - PubMed
    1. Bhaduri, A. , Sandoval‐Espinosa, C. , Otero‐Garcia, M. , Oh, I. , Yin, R. , Eze, U.C. et al. (2021) An atlas of cortical arealization identifies dynamic molecular signatures. Nature, 598, 200–204. - PMC - PubMed

Publication types