. 2023 Mar 21;51(5):2215-2237.
doi: 10.1093/nar/gkad066.

PARP1 associates with R-loops to promote their resolution and genome stability

Affiliations

PARP1 associates with R-loops to promote their resolution and genome stability

Natalie Laspata et al. Nucleic Acids Res. .

Abstract

PARP1 is a DNA-dependent ADP-Ribose transferase with ADP-ribosylation activity that is triggered by DNA breaks and non-B DNA structures to mediate their resolution. PARP1 was also recently identified as a component of the R-loop-associated protein-protein interaction network, suggesting a potential role for PARP1 in resolving this structure. R-loops are three-stranded nucleic acid structures that consist of a RNA-DNA hybrid and a displaced non-template DNA strand. R-loops are involved in crucial physiological processes but can also be a source of genome instability if persistently unresolved. In this study, we demonstrate that PARP1 binds R-loops in vitro and associates with R-loop formation sites in cells which activates its ADP-ribosylation activity. Conversely, PARP1 inhibition or genetic depletion causes an accumulation of unresolved R-loops which promotes genomic instability. Our study reveals that PARP1 is a novel sensor for R-loops and highlights that PARP1 is a suppressor of R-loop-associated genomic instability.


Figures

Graphical Abstract
Graphical Abstract
PARP1 association with R-loop structures induces its Poly(ADP-ribosyl)ation activity. PARP1 genetic depletion or inhibition leads to R-loop persistence and triggers genome instability.
Figure 1.
Figure 1.
PARP1 associates with R-loops in vitro. (A) Generation of R-loop-containing substrates for in vitro studies using the pFC53-mAIRN plasmid. For AFM studies, T3 RNAP-transcribed plasmid was linearized with ApaLI to yield an R-loop-containing fragment. For downstream biochemical experiments, transcribed plasmid was treated with RNase A to degrade residual RNAs while preserving R-loop structures. A negative control was generated by treatment of transcribed plasmid with E. coli RNase H (ecRNH) to degrade R-loops. (B) Agarose gel electrophoresis verifying R-loop formation in the pFC-mAIRN plasmid following T3 IVT. Migration of un-transcribed plasmid (lane 1), transcribed plasmid (lane 2), transcribed plasmid treated with RNase A (lane 3), and transcribed plasmid treated with RNase A and ecRNH (lane 4) was analyzed. R-loop formation in the transcribed plasmid is indicated by a shift in migration. ecRNH treatment degrades R-loops and abrogates this shift. (C) EMSA assay of un-transcribed (lanes 1 and 2) or transcribed pFC-mAIRN plasmid fragments (lanes 3 and 4) incubated with the R-loop antibody S9.6 (lanes 2 and 4). Black arrows indicate the super-shift caused by S9.6 binding to R-loops. (D) AFM topography images of transcribed, linear 2795 bp pFC-mAIRN plasmid fragments containing R-loops (right panel, white arrow) and spurs (left panel, white arrow) without PARP1. (E) AFM topography images of un-transcribed, linear 2795 bp pFC-mAIRN plasmid fragments (no R-loops) incubated with PARP1 (white arrows depict PARP1 binding). (F) AFM topography images of transcribed, linear 2795 bp pFC-mAIRN plasmid containing R-loops incubated with PARP1 (white arrows depict PARP1 binding). Examples are from samples incubated at RT for 10 min. XY scale bar = 100 nm. (G) AFM height distribution of R-loops on the linear DNA fragments without PARP1 (0.82 nm ± 0.08 nm, N = 50) versus inactive PARP1 bound to R-loops on the linear DNA (1.38 nm ± 0.56 nm, N = 57). Numbers reported: Mean ± SD. (H) Position distribution of R-loops on the linear DNA fragments without PARP1 (40.8% ± 5.0%, N = 50), PARP1 on the linear DNA with R-loops (+R-loop, 35.0% ± 11.1% not counting end binding, N = 55) and PARP1 on linear DNA without R-loops (-R-loop, 28.4% ± 13.3% not counting end binding, N = 47). Numbers reported: Mean ± SD. The Box–Whisker plots show 25–75%, median, mean and range within 1.5 IQR.
Figure 2.
Figure 2.
PARP1 association with R-loops triggers ADP-ribosylation activity. (A) Anti-PAR 10H western blot following PARP1 auto-modification assay demonstrating that the IVT process does not induce modifications in pFC-mAIRN DNA that mediate unspecific PARP1 binding, indicated by a lack of increase in PAR signal when PARP1 is incubated with plasmid that underwent the mock IVT process compared to the no DNA control. DNase I-activated DNA (aDNA) fragments were used as a positive control for PARP1 activation. A sample without DNA (no DNA) was used as a negative control. (B) Anti-PAR 10H western blot following PARP1 auto-modification assay demonstrating activation of purified PARP1 upon incubation with un-transcribed or T3 RNAP-transcribed pFC-mAIRN plasmid.(C) Quantification of fold stimulation of PARP1 activity over no DNA control observed by anti-PAR western blot illustrated in (B). Data are from 3 independent experiments, indicated by colored data points. P value was obtained using an unpaired student's t-test assuming 95% confidence. (D) Representative AFM topography images of a linear, transcribed 2795 bp pFC-mAIRN fragment containing R-loops incubated with activated PARP1. White arrows indicate PAR branched chains on PARP1. XY scale bar = 100 nm. (E) AFM height distribution of linear, transcribed pFC-mAIRN molecules containing R-loops incubated with activated PARP1. (F) Position distribution of activated PARP1 on linear, transcribed pFC-mAIRN fragments containing R-loops (position distribution on ice = 35.0% ± 9.7%, N = 36; position distribution at 37°C = 32.4% ± 12.6%, N = 21). Numbers reported: mean ± SD. The Box–Whisker plots show 25–75%, median, mean, and range within 1.5 IQR. (G) AFM topography images of PARP1 bridging transcribed pFC-mAIRN fragments at R-loop sites. XY scale bar = 100 nm. (H) Measurement of short arm length of the bridged pFC-mAIRN molecules in (G) from the closest end to the junction point. Short arm lengthR-loop= 314 ± 38.7 nm, short arm lengthmulti-DNA complex= 301.6 ± 79.5 nm, N = 50, P > 0.05) Numbers reported: mean ± SD. The Box–Whisker plots show 25–75%, 5–95%, median, and mean. (I) Anti-PAR western blot following PARP1 auto-modification assay demonstrating activation of purified PARP1 upon incubation with un-transcribed or T7-transcribed pFC-mAIRN DNA. (J) Quantification of fold stimulation of PARP1 activity over no DNA control observed by anti-PAR western blot illustrated in (I). Data are from five independent experiments, identified by colored data points. P values was obtained using an unpaired Student's t-test assuming 95% confidence.
Figure 3.
Figure 3.
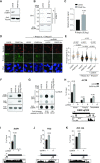
PARP1 associates with R-loop-forming sites in cells. (A) Representative images of S9.6:PARP1 PLA in RNH1-WT-GFP and RNH1-D210N-GFP U2OS cells untreated or induced with DOX. PLA foci (red) are observed due to PARP1 antibody association within a 40 nm distance of the S9.6 antibody. White scale bars represent 10 μm. (B) Quantification of the number of PLA foci per nucleus for each experimental condition illustrated in (A). Orange bars represent the mean. Data are from three independent experiments with 75 to 100 cells counted per experiment. P values were obtained using ordinary one-way ANOVA. (C) Representative images of S9.6:PARP1 PLA analysis in U2OS cells transfected with siRNA for RNH1 or SETX. White scale bars represent 10 μm. (D) Quantification of the number of PLA foci per nucleus for each experimental condition illustrated in (C). Orange bars represent the mean. Data are collected from 100 to 170 nuclei. P values were obtained using ordinary one-way ANOVA. (E) Representative images of ant-PAR immunofluorescence in RNH1-D210N-GFP U2OS cells. PAR signal is shown in red and RNH1-D210N-GFP expression in green (middle row). DNA is shown in blue after DAPI staining. Aphidicolin (APH) (0.4 μM) was used as a positive control. White scale bars represent 10 μm. (F) Quantification of relative PAR signal intensity as shown in (E). Orange bars represent median PAR intensity. Data are from three independent experiments in which 100–150 nuclei were counted for each experiment. P values were obtained using one-way ANOVA analysis. (G) Western blot analysis of chromatin-bound protein fractions isolated from RNH1-WT-GFP and RNH1-D210N-GFP U2OS cells before and after induction with DOX and treatment with 100 nM talazoparib (PARPi) for 24 hrs. (H) Quantification of relative fold change in chromatin PARP1 signal over non-PARPi-treated conditions. Data are from three independent experiments. P values were obtained using Student's t-tests. (I) Representative images of S9.6:PARP1 PLA analysis in RNH1-D210N-GFP U2OS cells treated with PARPi. RNH1-D210N-GFP expression is shown in green and DNA in blue after DAPI staining. It is to be noted that the dimmer GFP signal is due to the pre-extraction and PLA staining processes (second and bottom row). White scale bars represent 10 μm. (J) Quantification of the number of PLA foci per nucleus for each experimental condition illustrated in (I). Orange bars represent the mean. Data are from 100 to 200 nuclei. P values were obtained using ordinary one-way ANOVA.
Figure 4.
Figure 4.
PARP1 prevents R-loop accumulation. (A) Anti-PARP1 western blot analysis in U2OS and PARP1ko U2OS cells demonstrating efficient deletion of PARP1. (B) Anti-S9.6 immuno-slot blot of genomic DNA extracted from U2OS or PARP1ko cells. ecRNH was used as a negative control to degrade R-loop structures. The anti-ssDNA antibody was used as a loading control. White scale bars represent 10 μm. (C) Quantification of relative S9.6 signal on immuno-slot blot in (B) measured from 0.5 μg DNA. Data are from 3 independent experiments. P value was obtained using a Student's t-test. (D) S9.6 immunofluorescence in U2OS and PARP1ko cells. S9.6 signal is shown in green and a nucleolin control is shown in red. RNases T1 and III were used to degrade ss- and dsRNAs and increase specificity of S9.6 signal. RNH1 treatment was used as a negative control to degrade R-loop structures. White scale bars represent 10 μm. (E) Quantification of relative S9.6 signal observed in (D). Orange bars represent mean S9.6 intensity. Data are from 3 independent experiments. P values were obtained using ordinary one-way ANOVA. (F) Western blot analysis of RNH1-D210N-GFP U2OS cells either with PARP1ko and/or PARP1 re-expression by transfection with the 3×-FLAG-PARP1 plasmid. The PARP1 antibody was used to show efficient knockout of PARP1 followed by efficient re-expression upon complementation. The FLAG antibody was used to confirm the presence of FLAG-tagged PARP1 after complementation. (G) Anti-S9.6 immuno-dot blot of genomic DNA extracted from U2OS, PARP1ko or PARP1ko cells complemented with Cas9-insensitive Flag-tagged PARP1. ecRNH was used as a negative control to degrade R-loop structures. The anti-ssDNA antibody was used as a loading control. (H) (Bottom panel) schematic showing three regions of theβ-actin (ACTB) locus that are prone to R-loop formation. (Top panel) qPCR output of R-loop levels in the three ACTB loci regions chosen in U2OS and PARP1ko cells, demonstrating an increase in R-loop levels upon PARP1ko in all three regions. RNH1 was used as a negative control to degrade R-loop structures. Data are from eight independent experiments. Statistical analysis was performed using a Student's t-test. (I) (Bottom panel) schematic showing region of the EGR1 locus that is prone to R-loop formation. (Top panel) qPCR output of R-loop levels in the EGR1 locus in U2OS and PARP1ko cells, demonstrating an increase in R-loop levels upon PARP1ko. RNH1 was used as a negative control to degrade R-loop structures. Data are from 8 independent experiments. P value was obtained using a Student's t-test. (J) (Bottom panel) schematic showing region of the FOS locus that is prone to R-loop formation. (Top panel) qPCR output of R-loop levels in the FOS locus in U2OS and PARP1ko cells, demonstrating an increase in R-loop levels upon PARP1ko. RNH1 was used as a negative control to degrade R-loop structures. Data are from 8 independent experiments. P value was obtained using a Student's t-test. (K) (Bottom panel) schematic showing region of the RPL13A locus that is prone to R-loop formation. (Top panel) qPCR output of R-loop levels in the RPL13A locus in U2OS and PARP1ko cells, demonstrating an increase in R-loop levels upon PARP1ko. RNH1 was used as a negative control to degrade R-loop structures. Data are from 8 independent experiments. P value was obtained using a Student's t-test.
Figure 5.
Figure 5.
PARP1 depletion or inhibition triggers R-loop-mediated genomic instability. (A) Representative images of anti-S9.6 immuno-fluorescence in RNH1-D210N-GFP-expressing U2OS cells treated with DOX and/or PARPiTal. RNases T1 and III were used to degrade unspecific RNAs. S9.6 signal is shown in red, RNH1-D210N-GFP in green, and DNA in blue after DAPI staining. White scale bars represent 10 μm. (B) Quantification of relative S9.6 signal intensity from S9.6 immuno-fluorescence shown in (A). Data in black are from cells treated with RNases T1 and III and data in grey are from cells treated with RNases T1, III and H1. Orange bars represent mean S9.6 intensity. Data were collected from three independent experiments in which 100–200 nuclei per condition were counted. Statistical analyses were performed using ordinary one-way ANOVA. (C) Representative images of anti-γH2AX immunofluorescence in RNH1-D210N-GFP-expressing U2OS cells treated with DOX and/or PARPi for 24 h and pulsed with EdU for 15 min prior to fixation. γH2AX foci are shown in red, DNA is shown in blue after DAPI staining, and EdU signal is shown in grey. EdU-negative nuclei are outlined in white. White scale bars represent 10 μm. (D) Quantification of the number of γH2AX foci per nucleus for each experimental condition shown in (C). The pink box represents EdU-positive nuclei. Orange bars represent the mean. Data are from three individual experiments in which 80–150 nuclei were counted per condition. Statistical analyses were performed using ordinary one-way ANOVA. (E) Representative images of anti-γH2AX immunofluorescence in RNH1-D210N-GFP-expressing U2OS cells, RNH1-D210N-GFP-expressing PARP1ko U2OS cells and RNH1-D210N-GFP-expressing PARP1ko U2OS cells complemented with Cas9-insensitive Flag-PARP1. γH2AX foci are shown in red, DNA is shown in blue after DAPI staining. White scale bars represent 10 μm. (F) Quantification of the number of γH2AX foci per nucleus for each experimental condition shown in (E). Data were collected from three independent experiments in which 300–500 nuclei per condition were counted. Statistical analyses were performed using ordinary one-way ANOVA.

References

    1. Matta E., Kiribayeva A., Khassenov B., Matkarimov B.T., Ishchenko A.A.. Insight into DNA substrate specificity of PARP1-catalysed DNA poly(ADP-ribosyl)ation. Sci. Rep. 2020; 10:3699. - PMC - PubMed
    1. Luscher B., Ahel I., Altmeyer M., Ashworth A., Bai P., Chang P., Cohen M., Corda D., Dantzer F., Daugherty M.D.et al. .. ADP-ribosyltransferases, an update on function and nomenclature. FEBS J. 2021; 289:7399–7410. - PMC - PubMed
    1. Groslambert J., Prokhorova E., Ahel I.. ADP-ribosylation of DNA and RNA. DNA Repair (Amst.). 2021; 105:103144. - PMC - PubMed
    1. Langelier M.F., Riccio A.A., Pascal J.M.. PARP-2 and PARP-3 are selectively activated by 5' phosphorylated DNA breaks through an allosteric regulatory mechanism shared with PARP-1. Nucleic Acids Res. 2014; 42:7762–7775. - PMC - PubMed
    1. Lonskaya I., Potaman V.N., Shlyakhtenko L.S., Oussatcheva E.A., Lyubchenko Y.L., Soldatenkov V.A.. Regulation of poly(ADP-ribose) polymerase-1 by DNA structure-specific binding. J. Biol. Chem. 2005; 280:17076–17083. - PubMed

Publication types