. 2023 Feb 15;150(4):dev201375.
doi: 10.1242/dev.201375. Epub 2023 Feb 16.

High Sox2 expression predicts taste lineage competency of lingual progenitors in vitro

Affiliations

High Sox2 expression predicts taste lineage competency of lingual progenitors in vitro

Lauren A Shechtman et al. Development. .

Abstract

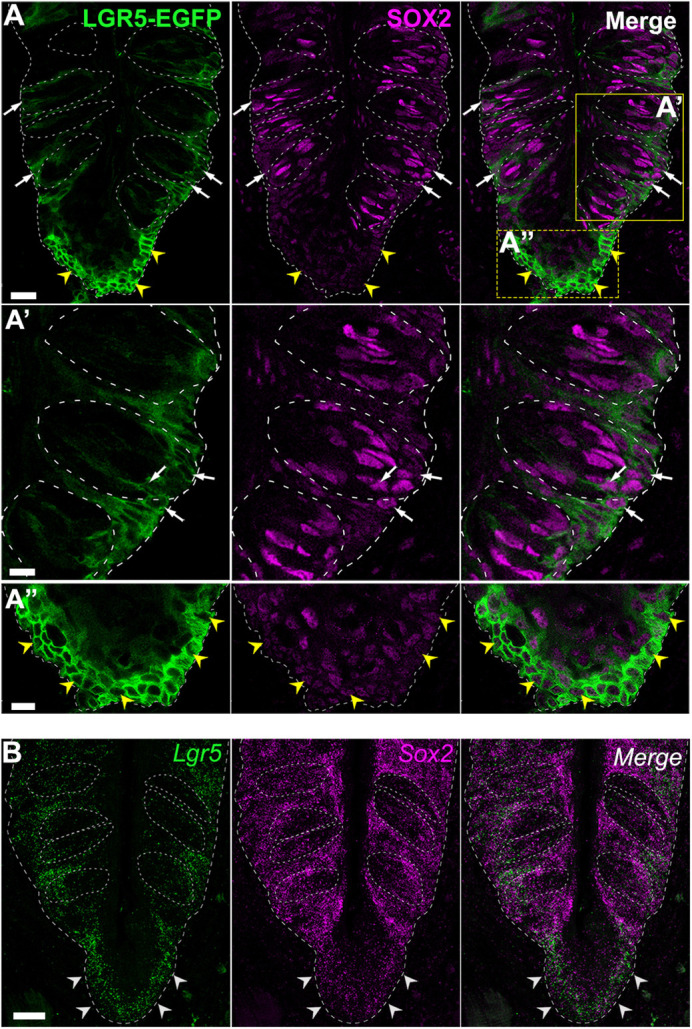
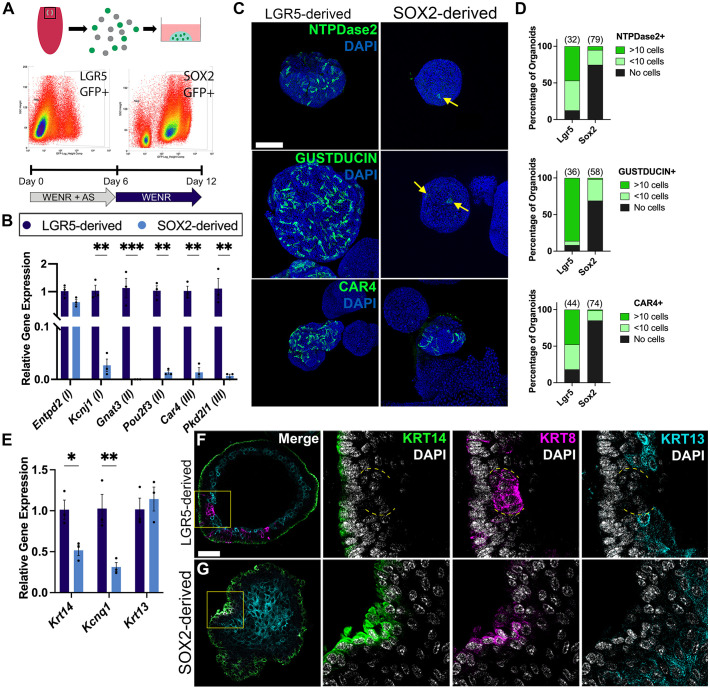
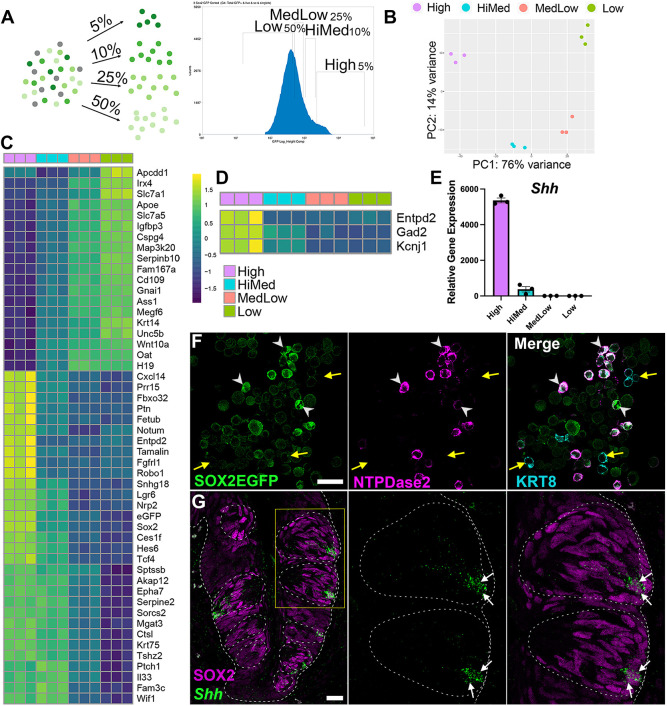
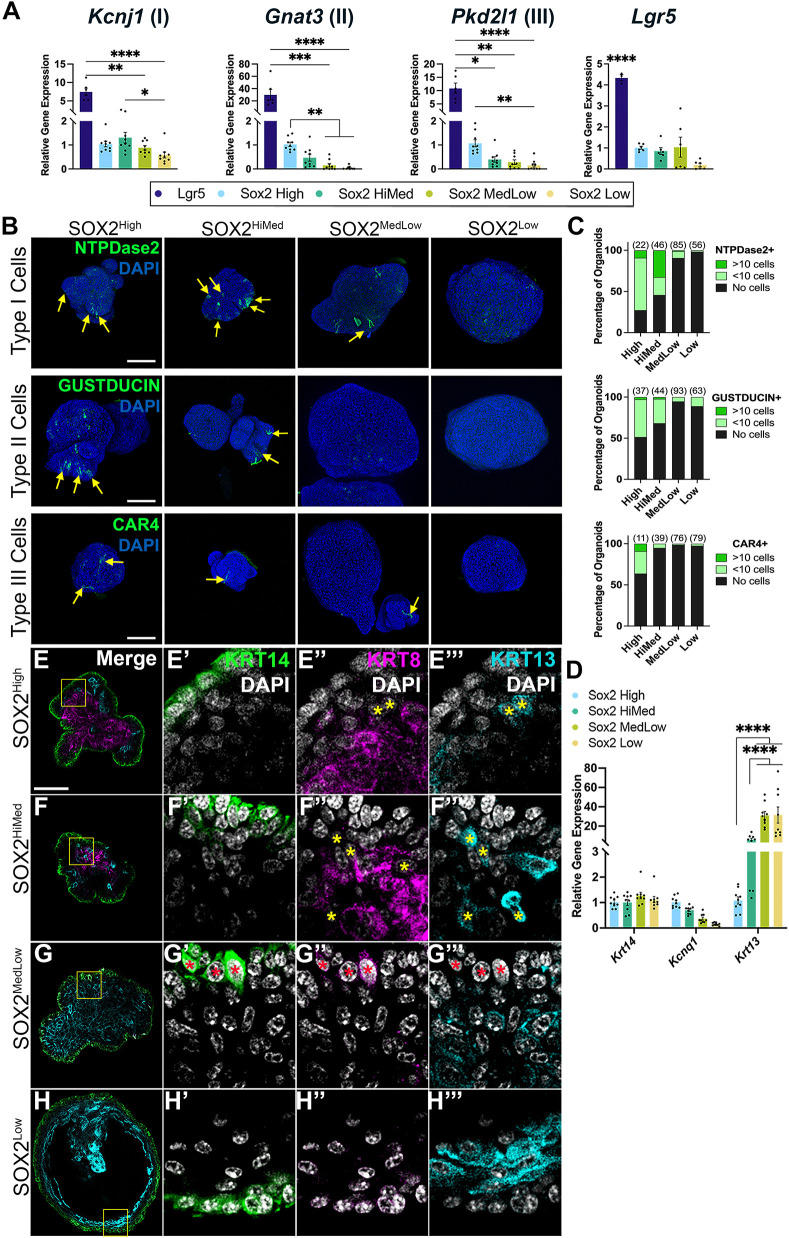
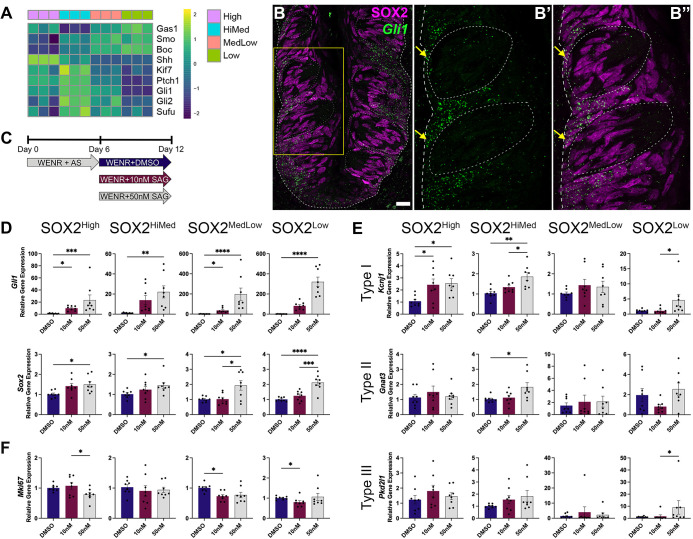
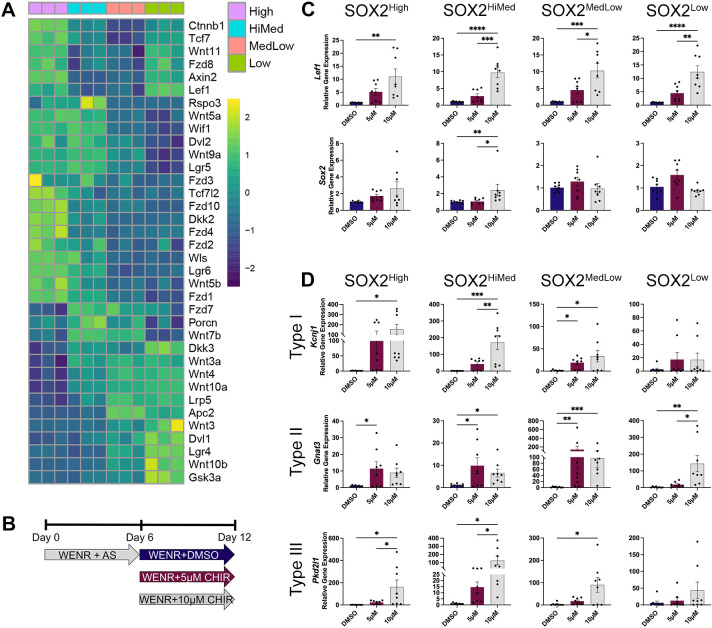
Taste buds on the tongue contain taste receptor cells (TRCs) that detect sweet, sour, salty, umami and bitter stimuli. Like non-taste lingual epithelium, TRCs are renewed from basal keratinocytes, many of which express the transcription factor SOX2. Genetic lineage tracing has shown that SOX2+ lingual progenitors give rise to both taste and non-taste lingual epithelium in the posterior circumvallate taste papilla (CVP) of mice. However, SOX2 is variably expressed among CVP epithelial cells, suggesting that their progenitor potential may vary. Using transcriptome analysis and organoid technology, we show that cells expressing SOX2 at higher levels are taste-competent progenitors that give rise to organoids comprising both TRCs and lingual epithelium. Conversely, organoids derived from progenitors that express SOX2 at lower levels are composed entirely of non-taste cells. Hedgehog and WNT/β-catenin are required for taste homeostasis in adult mice. However, manipulation of hedgehog signaling in organoids has no impact on TRC differentiation or progenitor proliferation. By contrast, WNT/β-catenin promotes TRC differentiation in vitro in organoids derived from higher but not low SOX2+ expressing progenitors.

Keywords: Adult stem cell; Organoid; Taste bud.


Conflict of interest statement

Competing interests The authors declare no competing or financial interests.

Figures

Fig. 1.
Fig. 1.
LGR5-GFP and SOX2 expression partially overlap in mouse CVP. (A-A″) SOX2 immunofluorescence (IF) (magenta) is robust in and around taste buds (dashed ovals), dimmer in LGR5-GFP+ cells (green) in trench wall epithelium (white arrows) and lowest in non-taste epithelium between taste buds. SOX2 IF is also low in deep CVP epithelium, where LGR5-GFP is highest (yellow arrowheads). (B) Lgr5 mRNA (green) is comparably expressed by cells at the basement membrane (dashed line), deep in the CVP (white arrowheads) and associated with taste buds (dashed ovals), whereas Sox2 mRNA expression (magenta) is high in and around buds, but low in non-taste epithelium between buds and in the deep CVP epithelium. Images are optical sections in A-A″ and maximum projections of confocal z-stacks in B. Scale bars: 20 µm in A,B; 10 µm in A′,A″.
Fig. 2.
Fig. 2.
SOX2+ progenitors have limited potential to generate TRC-replete organoids. (A) Procedure to generate organoids from CVP progenitors from Lgr5EGFP or Sox2GFP mice. See Materials and Methods for details. (B) Type I (Entpd2 and Kcnj1), II (Gnat3 and Pou2f3) and III (Car4 and Pkd2l1) TRC marker gene expression is significantly lower in SOX2- versus LGR5 organoids. (C,D) Most LGR5 organoids contain type I (NTPDase2+, green), II (gustducin+, green) and III (CAR4, green) TRCs, but most SOX2 organoids do not. Most TRCs in SOX2 organoids lack conventional taste cell morphology (yellow arrows). Images are maximum projections of confocal z-stacks of whole organoids. In D, n values (in brackets) indicate organoid number analyzed per condition from three independently derived organoid experiments. (E) LGR5 organoids have higher Kcnq1 (TRC marker) and Krt14 (progenitor marker) levels but similar Krt13 (non-taste epithelium marker) levels compared with SOX2 organoids. (F) In LGR5 organoids, KRT14+ cells (green) are basal/external and KRT8+ TRCs (magenta) (yellow dashed outline) are internal and surrounded by KRT13+ non-taste cells (cyan). (G) SOX2 organoids contain mostly KRT13+ cells (cyan); KRT8 (magenta) and KRT14 (green) are often co-expressed. Images are optical sections of immunostained organoids. DAPI nuclear counterstain is blue in C and white in F,G. Scale bars: 100 µm in C; 50 µm in F,G. Data are mean±s.e.m., *P<0.05, **P<0.01, ***P<0.001 (two-way ANOVA).
Fig. 3.
Fig. 3.
Cells with differential SOX2 expression are transcriptionally distinct. (A) SOX2-GFP+ progenitors were separated via FACS into four brightness bins (see text for details). (B) Transcriptomes of the four SOX2-GFP populations cluster appropriately when assessed using principal component analysis. (C) The top 50 genes (by FDR-adjusted P-value) differentially expressed across the four populations identified by a likelihood ratio test. (D,E) Type I TRC markers and Shh are enriched in SOX2High cells. (F) In a dispersed cell preparation of CVP epithelium from Sox2GFP mice, KRT8+ (cyan) taste cells that express high SOX2-GFP (green) are NTPDase2+ (magenta, white arrowheads), while KRT8+ taste cells lacking SOX2-GFP are NTPDase2neg (yellow arrows). Image is an optical section. (G) Shh (green) is expressed in SOX2 IF cells (magenta, white arrows) in CVP taste buds (dashed ovals). Image is a confocal z-stack projection. Scale bars: 20 µm.
Fig. 4.
Fig. 4.
Progenitors with higher SOX2 produce TRC-containing organoids, whereas organoids from progenitors expressing low levels of SOX2 comprise mostly non-taste epithelium. (A) Expression of type I, II and III TRC markers (Kcnj1, Gnat3 and Pkd2l1, respectively) is higher in SOX2High or SOX2HiMed organoids but all SOX2-derived organoids express these genes at lower levels than LGR5-derived organoids. Data are mean±s.e.m. *P<0.05, **P<0.01, ***P<0.001, ****P<0.0001 (one-way ANOVA). (B,C) SOX2High and SOX2HiMed organoids contain type I (NTPDase2, green), type II (gustducin, green) and type III (CAR4, green) TRCs (yellow arrows), and SOX2High organoids contain more type III TRCs than other organoid types. The large majority of SOX2MedLow and SOX2Low organoids do not contain TRCs. n vales (in brackets) indicate total organoids quantified per condition from three independently derived organoid experiments. (D) SOX2High and SOX2HiMed organoids express high levels of a general TRC marker, Kcnq1, and moderate levels of Krt13 (non-taste epithelium). SOX2MedLow and SOX2Low organoids express limited Kcnq1 and highly elevated Krt13. Data are mean±s.e.m. ****P<0.0001 (one-way ANOVA). (E-H‴) KRT14+ (green) cells make up the external epithelium of all SOX2 organoids (E′,F′,G′,H′). SOX2High and SOX2HiMed organoids contain KRT8+ TRCs (magenta, yellow asterisks in E″,F″) interspersed among KRT13+ non-taste cells (cyan, yellow asterisks in E‴,F‴), while SOX2MedLow and SOX2Low organoids are predominantly composed of KRT13+ cells (cyan in G,G‴,H,H‴). SOX2MedLow organoids have sparse KRT8+ cells that co-express KRT14 (magenta, red asterisk in G′-G‴). In A,D, n=9 (three samples each from three independently derived organoid experiments). Images in B are maximum projections of confocal z-stacks of whole organoids with DAPI nuclear counterstain (blue). Images in E-H‴ are optical sections of immunostained organoids; areas outlined in the left column are shown in more detail in the three right columns. DAPI (white) nuclear counterstain. Scale bars: 100 µm.
Fig. 5.
Fig. 5.
Hedgehog (Hh) pathway activation does not increase TRC differentiation in SOX2 organoids. (A) Hh pathway genes are differentially expressed in SOX2 progenitor populations. (B) Gli1 (green) is expressed by SOX2 IF cells (magenta) outside of taste buds (dashed ovals) (B′,B″, arrows). Image is a confocal z-stack projection. Area outlined in B is shown in B′,B″. (C) Organoids were treated with smoothened agonist (SAG) on days 6-12. See Materials and Methods for details. (D) The hedgehog target gene Gli1 and Sox2 are significantly upregulated by SAG. (E) SAG leads to increased expression of a type I TRC marker gene (Kcnj1) but has little effect on type II (Gnat3) and type III (Pkd2l1) TRC markers. (F) SAG has minimal impact on proliferation (Mki67) in any organoid population. Data are mean±s.e.m. *P<0.05, **P<0.01, ***P<0.001, ****P<0.0001 (one-way ANOVA). (D-F) n=8 (two or three samples each from three independently derived organoid experiments). Scale bar: 10 µm.
Fig. 6.
Fig. 6.
β-Catenin augmentation induces TRC marker genes in all SOX2-derived organoid types. (A) WNT/β-catenin signaling pathway genes are differentially expressed across SOX2 populations. (B) Organoids were treated with CHIR99021 (CHIR) from days 6-12. (C) The WNT target Lef1 is significantly upregulated by CHIR in all organoids, but Sox2 expression is unaltered. (D) In SOX2High, SOX2HiMed and SOX2MedLow organoids, CHIR significantly increases expression of markers of type I (Kcnj1), type II (Gnat3) and type III (Pkd2l1) TRCs. In SOX2Low organoids, CHIR also caused elevated Gnat3, while expression of Kcnj1 and Pkd2l1 trended upwards. Data are mean±s.e.m. *P<0.05, **P<0.01, ***P<0.001, ****P<0.0001 (one-way ANOVA). (C,D) n=8 (two or three samples each from three independently derived organoid experiments).

Similar articles

Cited by

References

    1. An, W. F., Germain, A. R., Bishop, J. A., Nag, P. P., Metkar, S., Ketterman, J., Walk, M., Weiwer, M., Liu, X., Patnaik, D.et al. (2010). Discovery of potent and highly selective inhibitors of GSK3b. In Probe Reports from the NIH Molecular Libraries Program, pp. 1-115. www.ncbi.nlm.nih.gov/books/NBK133436
    1. Arnold, K., Sarkar, A., Yram, M. A., Polo, J. M., Bronson, R., Sengupta, S., Seandel, M., Geijsen, N. and Hochedlinger, K. (2011). Sox2(+) adult stem and progenitor cells are important for tissue regeneration and survival of mice. Cell Stem Cell 9, 317-329. 10.1016/j.stem.2011.09.001 - DOI - PMC - PubMed
    1. Arnone, M. I., Dmochowski, I. J. and Gache, C. (2004). Using reporter genes to study cis-regulatory elements. Methods Cell Biol. 74, 621-652. 10.1016/S0091-679X(04)74025-X - DOI - PubMed
    1. Asano-Miyoshi, M., Hamamichi, R. and Emori, Y. (2008). Cytokeratin 14 is expressed in immature cells in rat taste buds. J. Mol. Histol. 39, 193-199. 10.1007/s10735-007-9151-0 - DOI - PubMed
    1. Barker, N., Van Es, J. H., Kuipers, J., Kujala, P., Van Den Born, M., Cozijnsen, M., Haegebarth, A., Korving, J., Begthel, H., Peters, P. J.et al. . 2007). Identification of stem cells in small intestine and colon by marker gene Lgr5. Nature 449, 1003-1007. 10.1038/nature06196 - DOI - PubMed

Publication types